Blog

  • How To Set Up an NGINX Reverse Proxy for Node.js, Python & Go Apps

    How To Set Up an NGINX Reverse Proxy for Node.js, Python & Go Apps

    There is a significant difference between an application that runs on localhost:3000 and one that is ready for public traffic. 

    When it is time to go live, you need SSL, a custom domain, and a secure way to route traffic to your backend. If you are like most developers, you probably grab the top NGINX reverse proxy snippet from Stack Overflow, paste it into your server, and call it a day.

    Then the weird bugs start.

    Your real-time WebSockets silently disconnect every 60 seconds. You check your application logs, only to realize every single visitor’s IP address is logged as a Cloudflare server or your own local proxy’s IP. Then a user tries to upload a basic 2MB image and gets slammed with a frustrating 413 Request Entity Too Large error.

    We have all been there.

    Instead of relying on incomplete configuration snippets, we will show you a more complete NGINX reverse proxy setup that you can adapt to your application and server environment. This will help you prevent common WebSocket timeout problems, preserve the correct client connection information, and terminate SSL cleanly before forwarding requests to your application. 

    What an NGINX Reverse Proxy Actually Does (And Why You Need One)

    If you are using NGINX for the first time, you can read our NGINX configuration basics guide first. But in short, a reverse proxy sits in front of your application server (like Node, Python, or Go) and intercepts all incoming internet traffic.
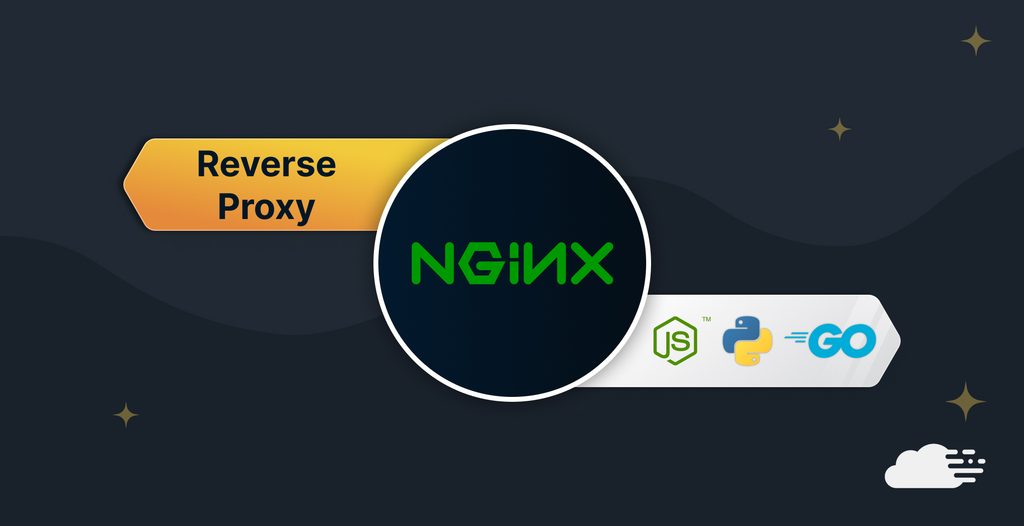
    This proxy handles several important tasks, such as:

    SSL termination, port consolidation, and HTTP/2 to the client

    When people visit a website, they expect secure https:// traffic on port 443 served via modern HTTP/2 protocols. Your application is probably served via plain HTTP/1.1 on port 3000. 

    In this setup, NGINX “terminates” the SSL connection, meaning it handles the heavy lifting of decryption and HTTP/2 multiplexing, and passes plain, unencrypted traffic to your app locally. This will allow you to centralize your certificate management.

    Why Put NGINX in Front of Your Application? 

    You can technically configure a Node.js or Go application to listen directly on port 443 and manage its own TLS certificates. In many production environments, it is simpler to place NGINX in front of the application instead.

    NGINX can handle TLS termination, connection management, request limits, compression, logging, and other web-server responsibilities while your application remains focused on handling application requests.

    Reverse proxy vs forward proxy vs load balancer

    When you are deciding between web servers and reverse proxies, you need to understand the terminology. A forward proxy sits between clients and external services and sends requests on the clients’ behalf. A reverse proxy sits in front of one or more backend servers and receives requests on their behalf. NGINX can also act as a load balancer by distributing requests across multiple backend instances. 

    Before You Configure the Reverse Proxy

    Before setting up NGINX, make sure:

    • Your application is already running.
    • You know the local port or Unix socket used by the application.
    • The application is not unnecessarily exposed on a public interface.
    • Your domain points to the server.
    • Ports 80 and 443 are reachable if you are serving the application publicly.
    • Your SSL certificate is already available if you use the HTTPS configuration shown below.

    You can test a TCP-based application locally before configuring NGINX. For example:

    curl http://127.0.0.1:3000

    If the application does not respond locally or if you see an error message saying “Failed to connect”, then you must fix the application or service first. NGINX cannot proxy successfully to an upstream service that is not running.
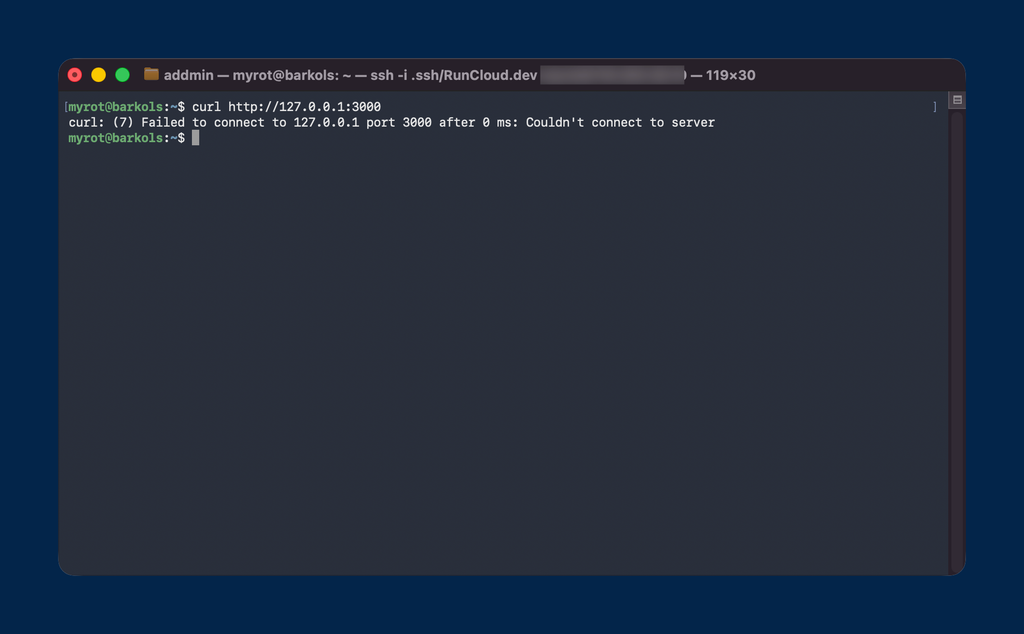
    Check application accessible via CURL

    Example NGINX Reverse Proxy Configuration 

    Most tutorials give you only the basic proxy configuration and leave you to handle features such as WebSockets, client IP forwarding, upload limits, and timeouts separately. The following example provides a more complete starting point that you can adapt to your application and server environment. 

    Example HTTPS Reverse Proxy Configuration 

    The map directive must be defined in the NGINX http context, outside the server block. The server block can then use the resulting $connection_upgrade variable when forwarding WebSocket requests. 

    map $http_upgrade $connection_upgrade { 
        default upgrade; 
        '' close; 
    } 
    server {
        listen 443 ssl;
        http2 on;
        server_name myapp.com;
        # SSL Configuration
        ssl_certificate /etc/letsencrypt/live/myapp.com/fullchain.pem;
        ssl_certificate_key /etc/letsencrypt/live/myapp.com/privkey.pem;
        # Example upload limit
        client_max_body_size 50M; 
        location / {
            # Proxy pass to your application
            proxy_pass http://127.0.0.1:3000;
    
    
            # Support HTTP/1.1 and WebSocket upgrades 
            proxy_http_version 1.1;
            proxy_set_header Upgrade $http_upgrade;
            proxy_set_header Connection $connection_upgrade;
    
    
            # Forward the original host and client connection details
            proxy_set_header Host $host;
            proxy_set_header X-Real-IP $remote_addr;
            proxy_set_header X-Forwarded-For $proxy_add_x_forwarded_for;
            proxy_set_header X-Forwarded-Proto $scheme;
    
    
            # Connection timeouts
            proxy_read_timeout 300;
            proxy_send_timeout 300; 
        }
    }

    If NGINX receives traffic directly from the client, $remote_addr contains the client’s IP address. If your site sits behind another proxy or CDN such as Cloudflare, you must also configure NGINX to trust that proxy and restore the original client IP. Otherwise, $remote_addr will contain the proxy’s IP address instead.

    If you use RunCloud, you can create and manage reverse proxy configurations from the RunCloud dashboard rather than manually editing generated NGINX configuration files.

    Configure Multiple Upstream Application Instances 

    If you run multiple instances of your application, you can define an upstream block outside the server block. NGINX can then distribute requests across those application instances.

    upstream my_nodejs_app {
        server 127.0.0.1:3000;
        server 127.0.0.1:3001;
    }

    You would then change your location block to use proxy_pass http://my_nodejs_app.

    Reverse Proxy a Node.js App (with PM2)

    When you deploy a long-running Node.js application on a VPS, you will usually run it under a process manager or service manager so that it can restart after a crash or server reboot. PM2 is a common option. 

    Run the Node.js App with PM2 on Port 3000 

    For an application that accepts a -p port argument, you could start it with PM2 on port 3000:

    pm2 start server.js --name "my-app" -- -p 3000

    The exact command depends on how your application accepts its host and port settings.

    The proxy_pass + headers config for Node

    Many Node.js frameworks use the Host and X-Forwarded-Proto headers when determining the original hostname and protocol. Forwarding these headers allows the application to identify that the original client connection used HTTPS even though NGINX communicates with the application over local HTTP.

    Depending on your framework, you may also need to configure the application to trust the reverse proxy before it uses forwarded headers.

    If you manage the application with RunCloud, you can create the reverse proxy from the RunCloud dashboard. Set the web application’s stack to Native NGINX + Custom Config, then use the predefined Proxy configuration under NGINX Config and set it to the port used by your application. 

    Zero-downtime reload pattern

    After changing a standard NGINX configuration, test the configuration before reloading the service:

    nginx -t && systemctl reload nginx

    A graceful reload applies valid configuration changes without unnecessarily interrupting active connections.
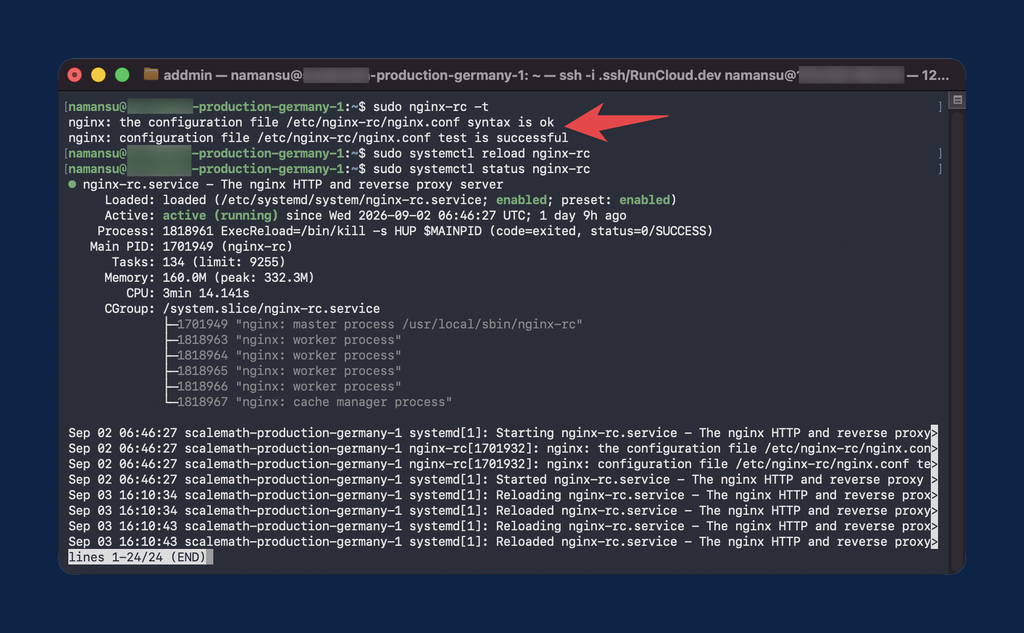
    Check NGINX config syntax

    If your server is managed by RunCloud, use the NGINX Config tools in the RunCloud dashboard to configure web applications. RunCloud uses its own NGINX package and configuration structure, so generic nginx service commands and paths may not match a RunCloud-managed server. 

    Reverse Proxy a Python App 

    Python applications handle concurrency differently than Node.js, usually relying on WSGI (Gunicorn) or ASGI (Uvicorn) servers.

    Gunicorn on a Unix socket vs TCP port

    Gunicorn can listen either on a local TCP port, such as 127.0.0.1:8000, or on a Unix socket. Unix sockets can be useful when NGINX and Gunicorn run on the same server because access can be controlled through filesystem permissions.

    For example:

    gunicorn --bind unix:/tmp/myapp.sock wsgi:app

    The NGINX upstream config for Unix sockets

    To point NGINX to a Unix socket instead of a TCP port, specify the socket path using NGINX’s Unix-domain socket syntax:

    proxy_pass http://unix:/tmp/myapp.sock:;

    Disable Proxy Buffering for Streaming Responses 

    NGINX buffers proxied responses by default. For applications that depend on incremental delivery, such as Server-Sent Events or streamed application responses, buffering can delay data reaching the client.

    You can disable proxy response buffering for the relevant location:

    proxy_buffering off;

    Reverse Proxy a Go App

    Go’s net/http package can serve HTTP traffic directly without requiring a separate web server. Placing NGINX in front of a Go application can simplify TLS termination, compression, rate limiting, logging, and other HTTP-level configuration. NGINX includes gzip support, while Brotli requires Brotli module support in the NGINX build. 

    The minimal proxy_pass for a Go binary

    If your Go application is listening on 127.0.0.1:8080, set proxy_pass to that address:

    proxy_pass http://127.0.0.1:8080;

    You can then add the required forwarding headers, timeout settings, and WebSocket configuration for your application.

    Configure WebSocket Proxying in NGINX 

    If you are running real-time applications like chat servers or automating workflows by hosting n8n behind Docker and NGINX, you need WebSockets. But WebSockets break easily behind NGINX if you miss three critical details.

    Older NGINX versions default to HTTP/1.0 when proxying HTTP requests to upstream servers. NGINX 1.29.7 and later default to HTTP/1.1.

    Explicitly setting the proxy version remains useful when you need compatibility with older NGINX installations and makes the WebSocket requirement clear:

    proxy_http_version 1.1;

    A WebSocket connection begins as an HTTP request containing an Upgrade header. NGINX needs to pass the relevant upgrade information to the upstream application.

    A reusable configuration can define the appropriate Connection value with a map:

    map $http_upgrade $connection_upgrade {

        default upgrade;

        ''      close;

    }


    Then use:

    proxy_set_header Upgrade $http_upgrade;

    proxy_set_header Connection $connection_upgrade;

    This sends Connection: upgrade only when an upgrade has been requested.

    Increase the WebSocket Read Timeout 

    The default proxy_read_timeout is 60 seconds. If the upstream server sends no data during that period, NGINX can close the connection.

    For long-lived WebSocket connections, you can increase the timeout:

    proxy_read_timeout 86400;

    This example allows up to 24 hours between successive read operations. Applications can also use WebSocket ping/pong messages or other heartbeat traffic to prevent idle connections from reaching the timeout.

    How to Set Up an NGINX Reverse Proxy in RunCloud

    If your server is managed by RunCloud, you can configure the reverse proxy from the dashboard without manually editing the generated NGINX configuration files.

    1. Log in to the RunCloud dashboard and select your server.
    2. Open Web Applications and select the application you want to configure.
    3. Open Settings and change the Web Application Stack to Native NGINX + Custom Config.
    4. Open NGINX Config and select Add a New Config.
    5. Choose Predefined Config and select the Proxy configuration.
    6. Set the proxy destination to the port used by your Node.js, Python, or Go application.
    7. Configure options such as proxy buffering or WebSocket support if your application requires them.
    8. Select Run and Debug to validate the NGINX configuration.
    9. Once the configuration passes validation, select Create Config.
    10. Test the application through its public URL or with curl.

    RunCloud recommends creating and editing custom NGINX configuration through the dashboard. Generated application configuration files should not be edited manually because RunCloud manages those files.

    Troubleshooting Common NGINX Reverse Proxy Problems

    502 Bad Gateway

    A 502 error usually means NGINX cannot connect to the upstream application.

    Check that the application is running and listening on the address or socket configured in proxy_pass.

    For a TCP-based application, test the upstream directly:

    curl http://127.0.0.1:3000

    Also, confirm that the port in proxy_pass matches the port used by the application.

    413 Request Entity Too Large

    If uploads fail with a 413 response, increase client_max_body_size to a value appropriate for your application:

    client_max_body_size 50M;

    Avoid setting a much larger limit than your application actually needs.

    WebSockets Disconnect or Fail to Connect

    Check that WebSocket upgrade headers are passed to the application and that the proxy uses HTTP/1.1 where required for compatibility.

    If connections close after periods of inactivity, review proxy_read_timeout and your application’s WebSocket heartbeat behavior.

    Redirect Loops

    If NGINX terminates HTTPS but the application believes the request arrived over HTTP, the application may repeatedly redirect the request to HTTPS.

    Make sure NGINX forwards:

    proxy_set_header X-Forwarded-Proto $scheme;

    You may also need to configure your framework to trust the reverse proxy.

    Incorrect Client IP Addresses

    If NGINX sits directly behind the client, $remote_addr represents the client address. If another proxy, such as Cloudflare, sits in front of NGINX, configure trusted proxy ranges and the appropriate real-IP header before relying on $remote_addr.

    Manage Reusable NGINX Configurations with RunCloud Templates 

    Note: Use the web application’s NGINX Config tools when configuring a reverse proxy for an individual application. NGINX Templates are useful when you want to reuse and centrally manage the same configuration across multiple applications. 

    If you manage the same NGINX rules across several web applications, repeatedly copying configuration files makes those configurations harder to maintain consistently.

    RunCloud NGINX Templates let you create reusable configuration files in your workspace and link them to multiple web applications. You can manage these templates centrally from Settings > NGINX Templates rather than manually editing each application’s configuration over SSH.

    RunCloud provides two template areas:

    • My Templates contains templates created or duplicated into your workspace.
    • Public Templates contains read-only templates provided by RunCloud and approved community members. You can duplicate a Public Template into your workspace before editing or installing it.

    This provides several benefits for server management: 

    • Centralized configuration: Link a template to multiple web applications and manage the configuration from one place.
    • Reusable templates: Create your own templates or duplicate a Public Template into your workspace as a starting point.
    • Configuration testing: Test a template against an existing web application before installing it.
    • Controlled propagation: When you update a linked template, RunCloud lets you propagate the new configuration to the selected web applications.
    • Safer deployment: RunCloud checks the NGINX configuration before applying it. If validation fails, the invalid configuration is not activated.
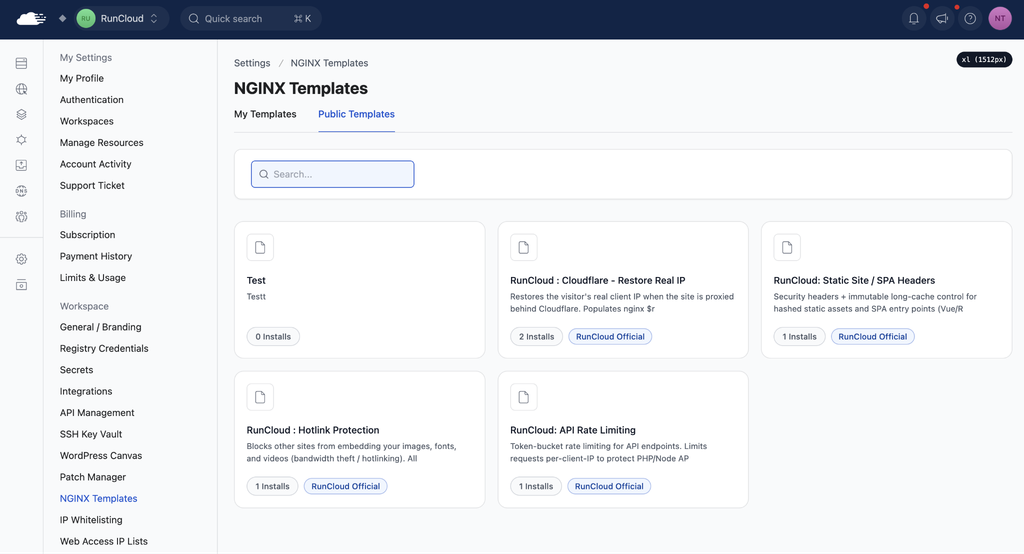
    RunCloud NGINX template dashboard for creating reverse proxy

    This makes NGINX Templates useful when the same configuration needs to be maintained across several applications without manually updating each one. 

    Wrapping Up

    An NGINX reverse proxy gives you a central place to handle HTTPS, route requests to your application, forward request information, and configure features such as WebSocket support and upload limits.

    The exact configuration depends on your application, whether another proxy or CDN sits in front of NGINX, and which NGINX version you are running. Testing each configuration change before applying it is therefore essential.

    RunCloud provides dashboard tools for managing NGINX configuration without manually editing generated application configuration files. You can create reverse proxy configurations, validate them before applying them, and manage reusable configurations through NGINX Templates.

    This gives you a safer way to manage reverse proxy configuration across your applications while retaining control over application-specific settings such as ports, WebSockets, buffering, and forwarded headers.

    If you want to manage your NGINX reverse proxy and web applications from a central dashboard, sign up for RunCloud and deploy your next application. 

    FAQs

    What is the difference between NGINX and Apache as a reverse proxy?

    Both NGINX and Apache can act as reverse proxies. NGINX uses an event-driven architecture and is commonly used as a dedicated reverse proxy in front of application servers. Apache supports reverse proxying through modules such as mod_proxy and offers several Multi-Processing Modules with different connection-handling models.
    The better choice depends on your existing server stack, configuration requirements, and operational preferences.

    Should I use Caddy or Traefik instead of NGINX?

    Caddy and Traefik are alternatives worth considering depending on your environment. Caddy focuses heavily on simple configuration and automatic HTTPS, while Traefik is commonly used with container and service-discovery workflows.
    NGINX remains a good choice when you need detailed control over proxying, routing, headers, caching, or load balancing.

    Why does my WebSocket disconnect every 60 seconds behind NGINX?

    NGINX uses a default proxy_read_timeout of 60 seconds. If the upstream sends no data during that period, NGINX can close the connection.
    You can increase proxy_read_timeout for long-lived WebSocket connections or use application-level ping/pong messages or other heartbeat traffic to keep the connection active.

    How do I pass the real client IP through NGINX and Cloudflare?

    If Cloudflare sits in front of NGINX, configure NGINX’s real-IP module to trust only Cloudflare’s published proxy IP ranges and use the appropriate client-IP header. This allows NGINX to replace the Cloudflare proxy address with the original visitor address before forwarding it to your application.
    Do not trust forwarded client-IP headers from arbitrary sources, because clients can otherwise supply forged values.

    Can NGINX do load balancing between multiple Node.js processes?

    Yes. NGINX can distribute traffic across multiple Node.js instances using an upstream block. The available load-balancing methods include the default round-robin behavior as well as methods such as least_conn and ip_hash.
    Choose the method according to how your application handles sessions, connection duration, and backend capacity.

    Does NGINX HTTP/2 work with the upstream backend?

    The protocol used between the client and NGINX is separate from the protocol NGINX uses to communicate with an upstream application. For normal HTTP reverse proxying, NGINX can proxy requests to HTTP upstream servers independently of whether the client connected using HTTP/2 or HTTP/3.
    If your application uses a protocol such as gRPC, use the corresponding NGINX proxy module and configuration rather than the standard HTTP proxy_pass configuration.

    What is the cleanest way to add SSL to a Node.js app?

    A common production approach is to terminate TLS at NGINX and proxy requests to the Node.js application over a local connection. This centralizes certificate management and allows the application to run without managing its own public TLS listener.
    You can obtain and renew certificates with a tool such as Certbot or use your server-management platform’s SSL tools.

  • How To Install And Configure Object Cache Pro for WordPress

    How To Install And Configure Object Cache Pro for WordPress

    Are you tired of slow server responses on your WordPress website? If so, you may want to consider implementing object caching.

    Object caching is a powerful technique that can greatly enhance your website’s performance by reducing database queries and speeding up page load times.

    In this article, we’ll guide you through setting up Object Cache Pro and provide the steps to configure it properly.

    Let’s get started!

    Why Should You Use Object Cache Pro?

    Object Cache Pro is a business-class Redis object cache backend for WordPress, providing reliable, highly optimized, and fully customizable caching for your website. It’s optimized for WooCommerce, Jetpack, and Yoast SEO – making it an ideal solution for businesses.

    Object Cache Pro seamlessly integrates with WordPress and offers deep insights through its Site Health and Query Monitor integrations, as well as its Debug Bar panels. Object Cache Pro offers faster binary serialization support, LZF, LZ4, and ZSTD compression, asynchronous flushing, batch key prefetching, batcache, and cache analytics.

    How to Configure Object Cache Pro for WordPress on RunCloud

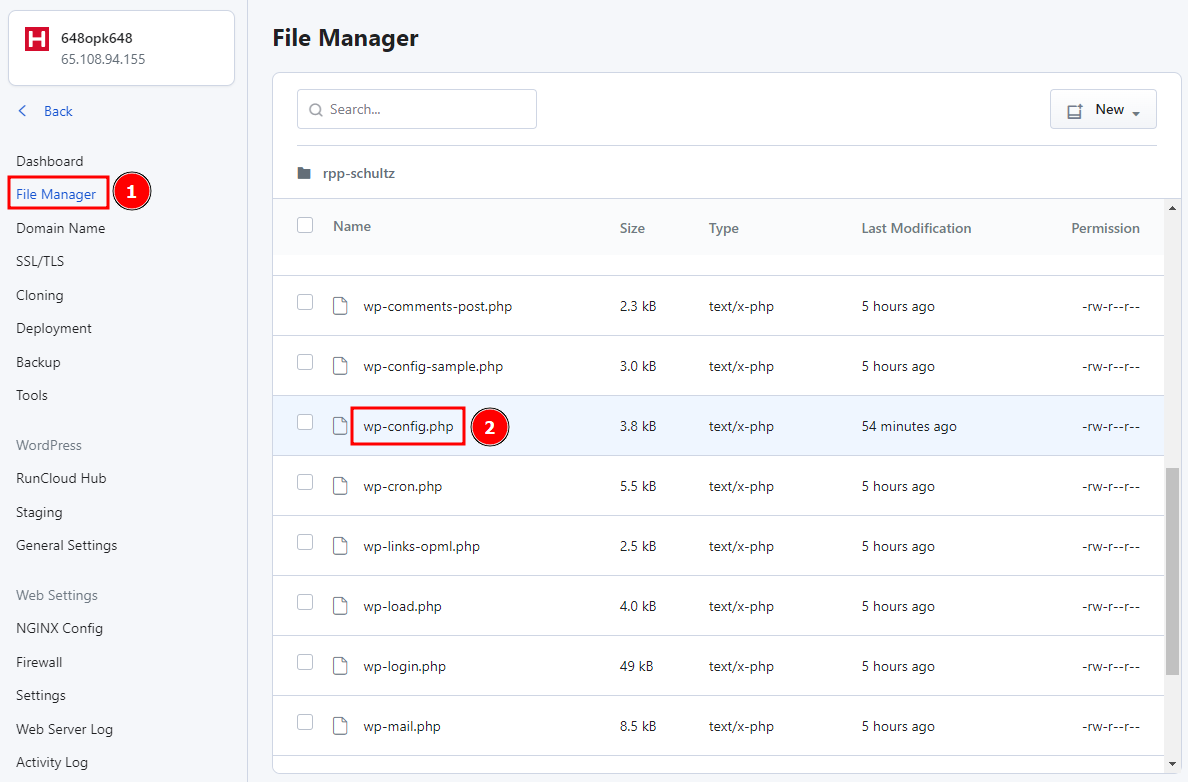
    Before installing the plugin, we recommend configuring the license key to avoid any hiccups during the installation. The easiest way to do this is by editing the wp-config.php file on the RunCloud dashboard.

    Open the wp-config.php file in the file manager and add the following code below the line that says ‘Add any custom values between this line and the “stop editing” line’. Don’t forget to replace the license key in the text snippet.

    define('WP_REDIS_CONFIG', [
    'token' => '<your-license-token>',
    'host' => '127.0.0.1',
    'port' => 6379,
    'database' => $REDIS_DATABASE,
    'prefix' => 'db${REDIS_DATABASE}:',
    'maxttl' => 86400,
    'timeout' => 1.0,
    'read_timeout' => 1.0,
    // 'prefetch' => true,
    // 'split_alloptions' => true,
    'debug' => false,
    ]);
    define('WP_REDIS_DISABLED', false);

    After you have added the file, you can browse the list of configurations to change any other settings that you like. Once you are satisfied with it, you can save and close the file.

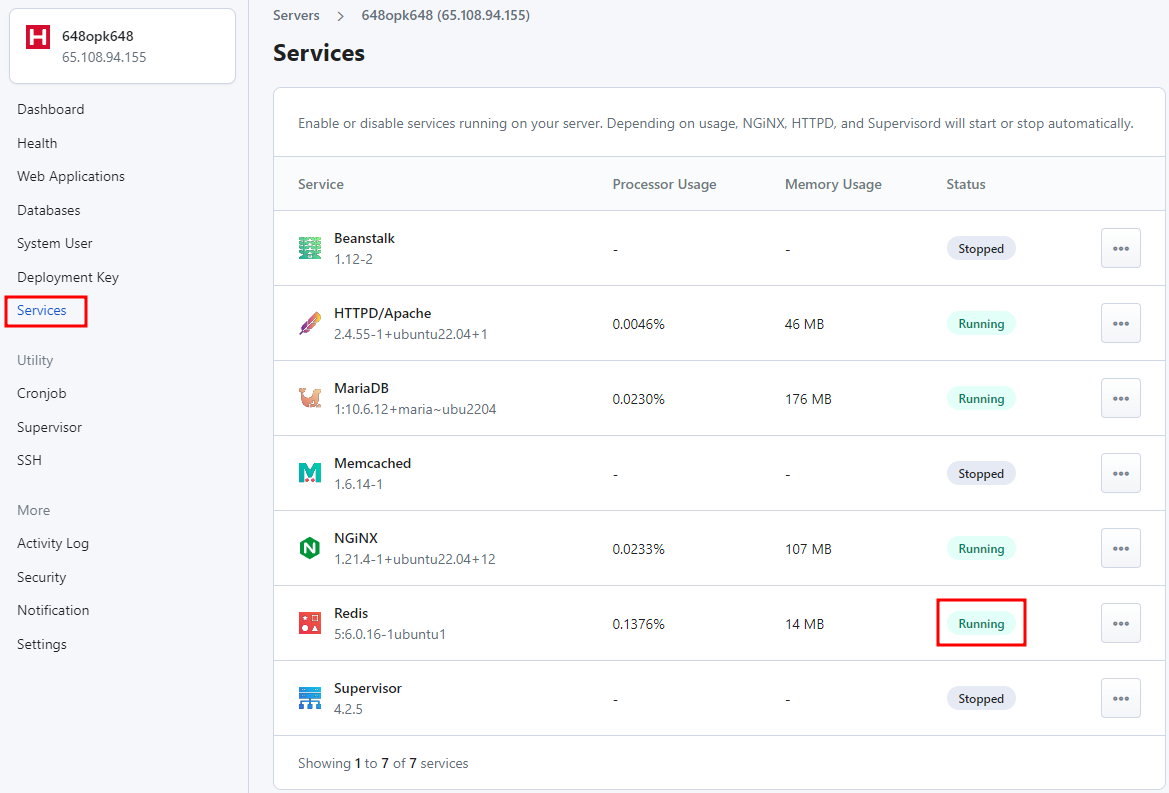
    After adding the license token, verify that Redis is running on your server. To do this, go to the Services menu and check the status, making sure it says “Running” next to Redis. If it’s stopped, you can just start it.

    How to Install Object Cache Pro for WordPress

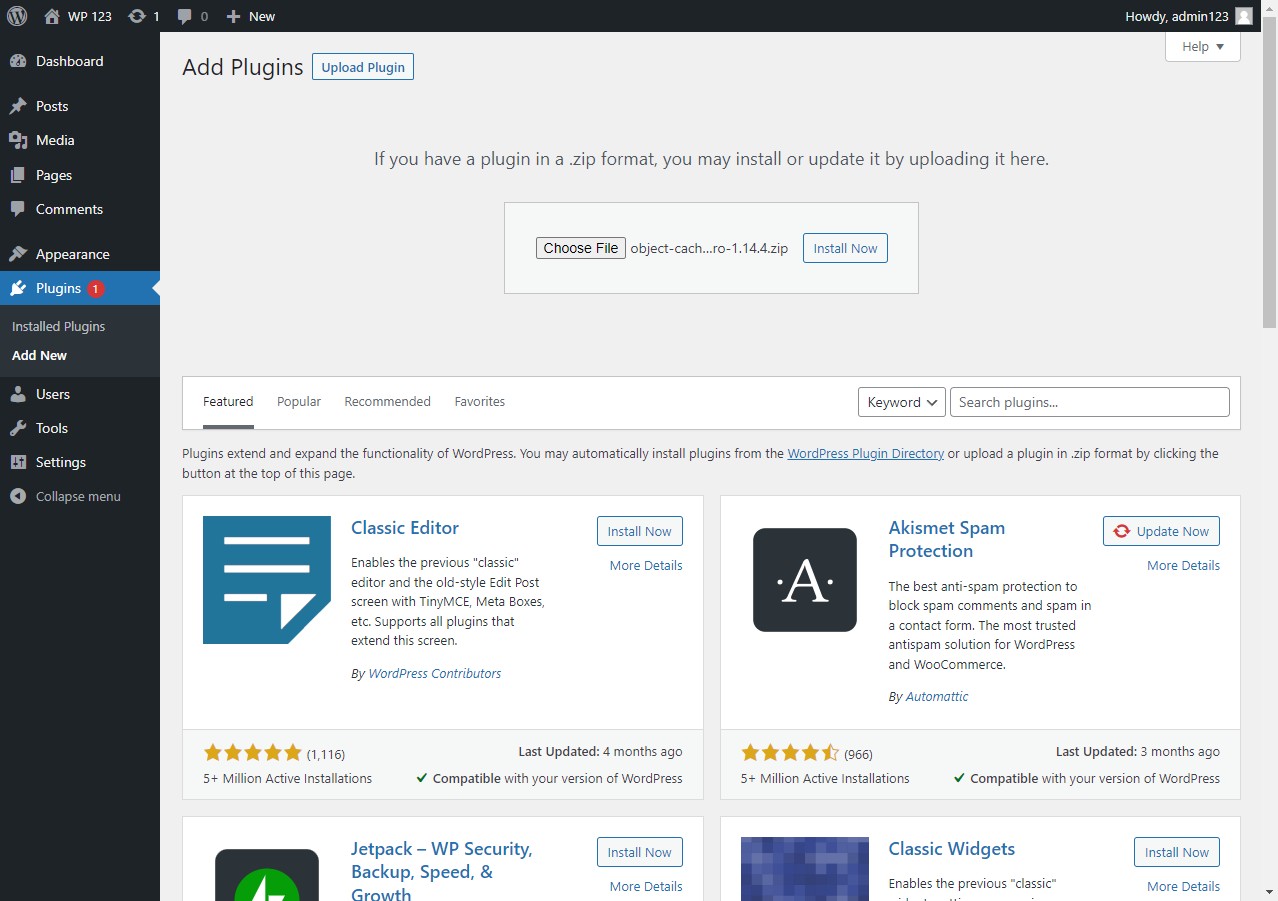
    Once you have configured the settings, you can install the plugin by uploading the zip file. Go to your WordPress dashboard and open the plugins tab. Click on “Add Plugins” and select “Upload Plugin”, then locate the zip file and install it.

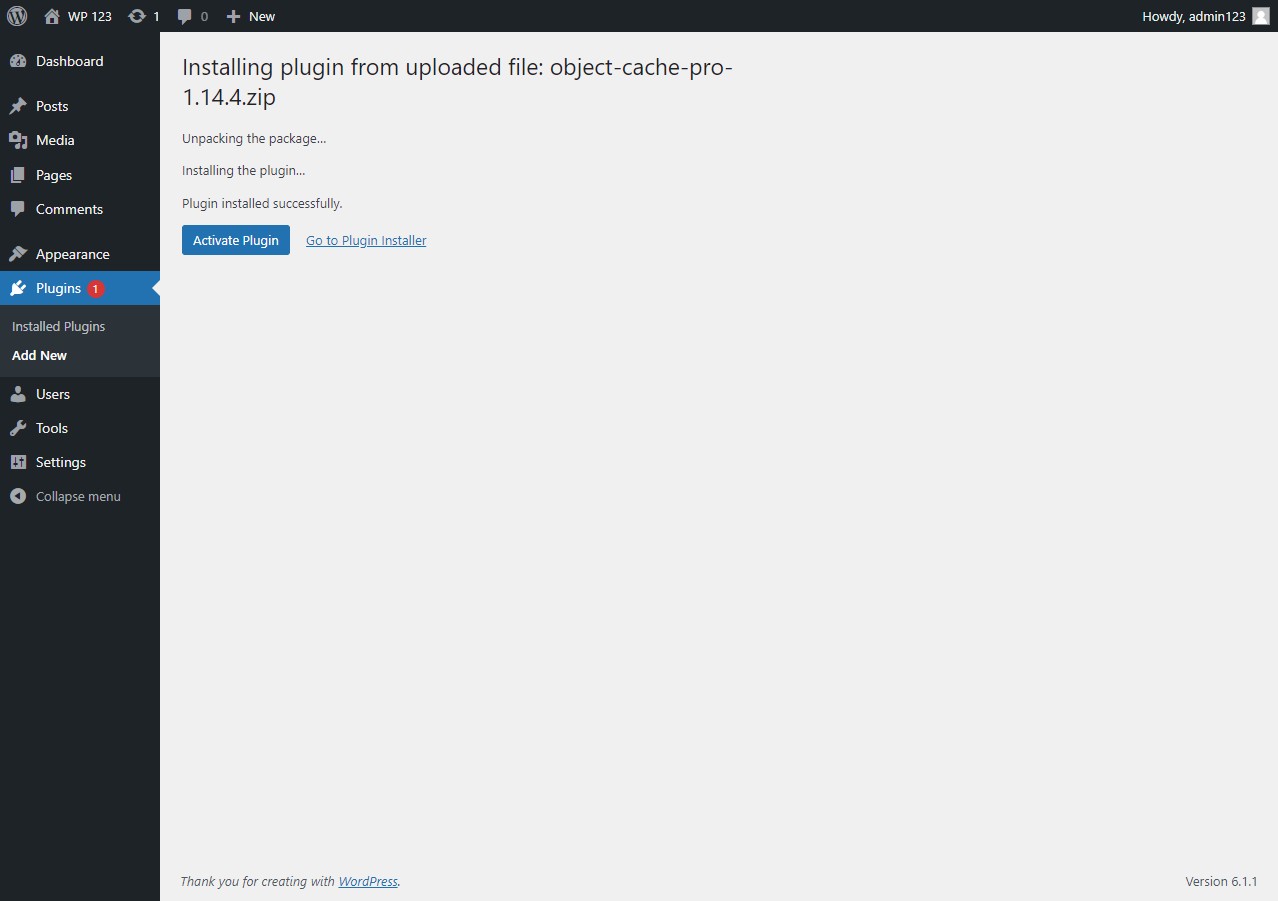
    After installation, click on the “Activate Plugin” to enable it.

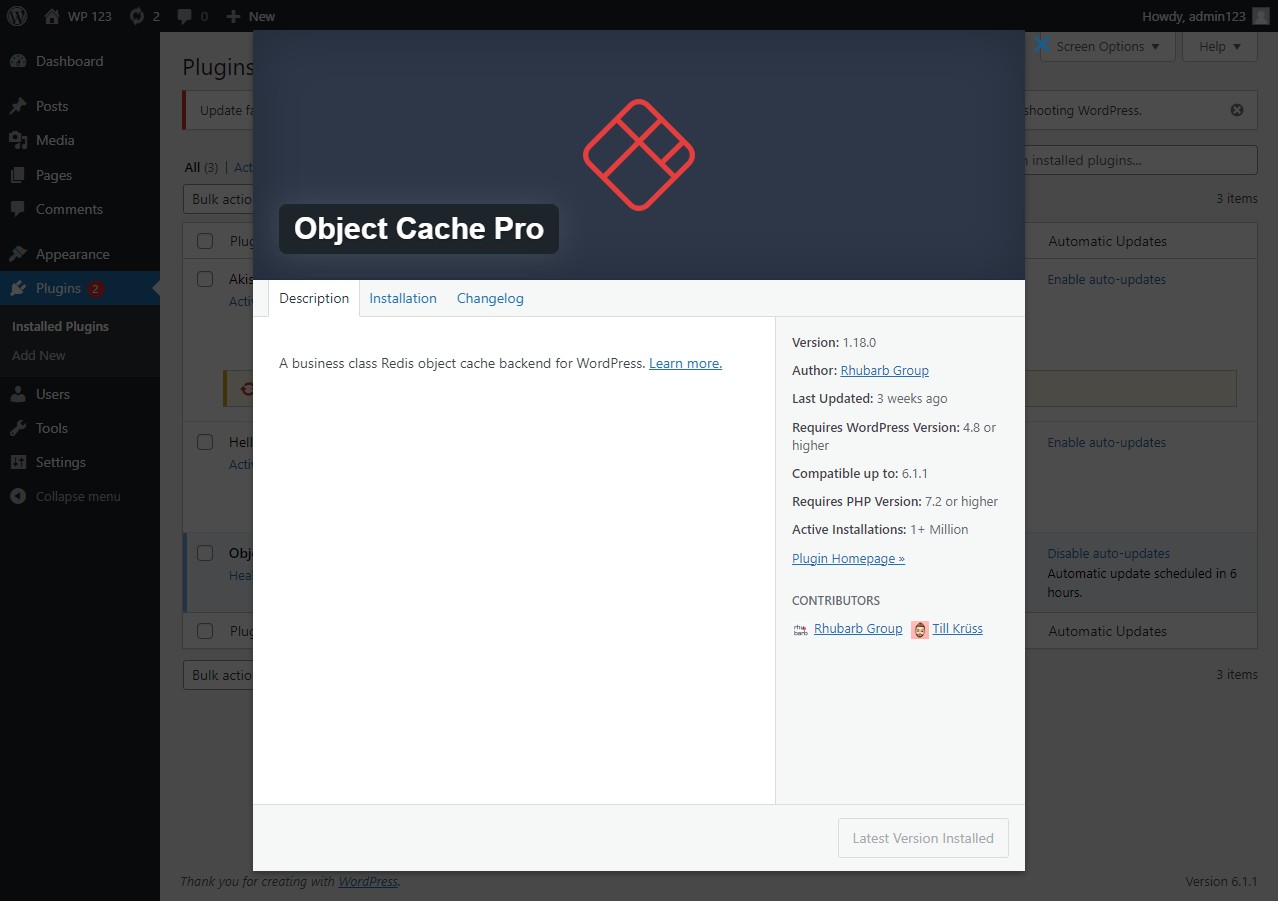
    Go to the plugins menu and click on “View Details” next to Object Cache Pro – a modal will appear with information about the plugin. Make sure it says “Latest Version Installed” on the bottom right. If you’re using an older version, simply update it.

    After this, enable auto-updates to update the plugin automatically when a new version is released.

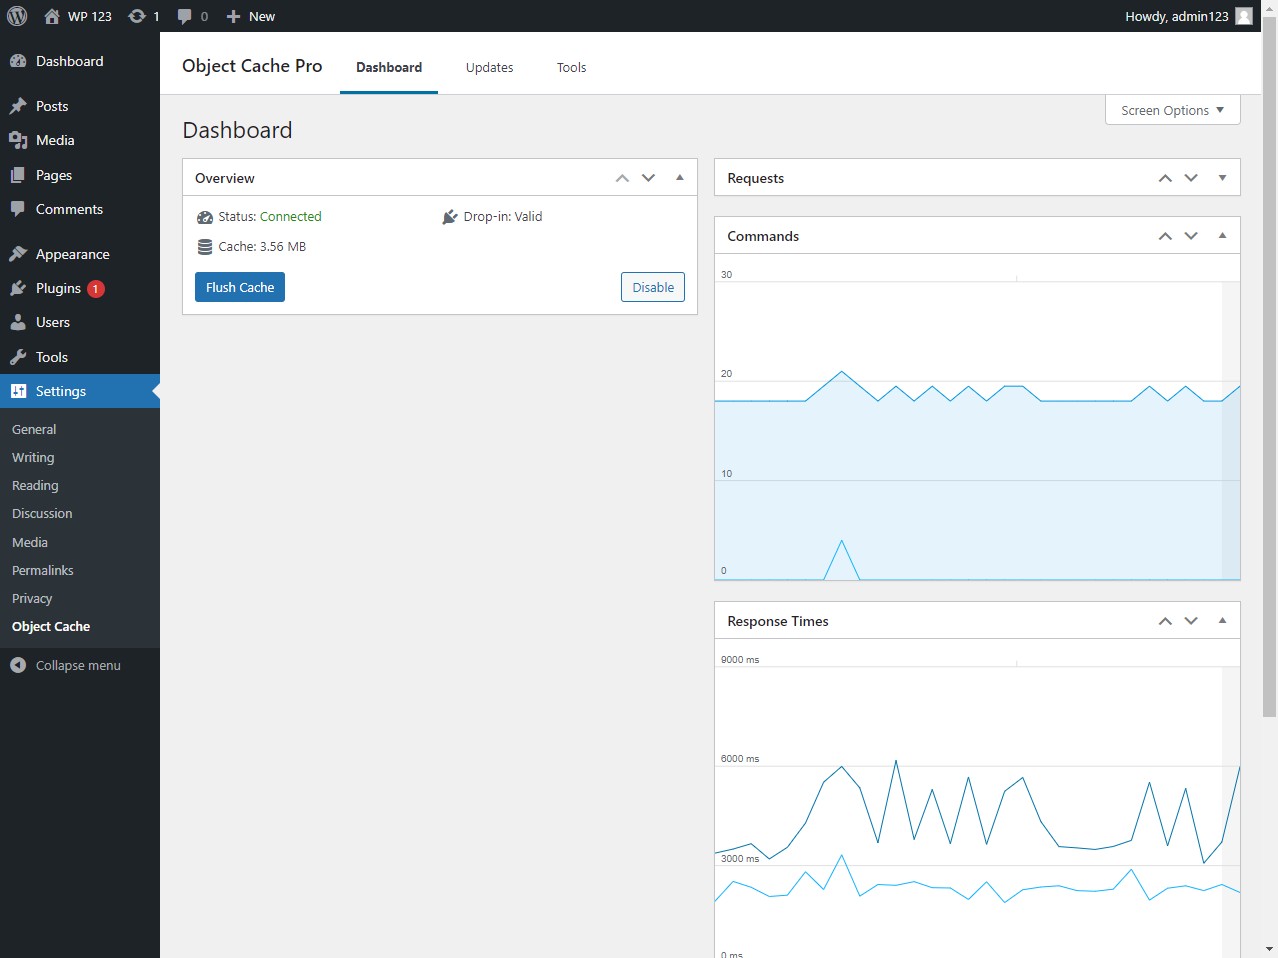
    After installing the plugin, you can open its settings to check whether everything is working correctly. You should see “Status: Connected” in the widget on your Dashboard. If not, head to Tools > Site Health for more information.

    After Action Report

    Object Cache Pro can greatly enhance the performance and speed of your WordPress website by reducing the database load and server response time. The step-by-step guide provided in this article should help you successfully set up object caching on your WordPress website.

    If you find this guide useful, you should also read:

    If you are looking for an easy-to-use platform to manage your server and save time and resources, give your website the best chance to shine by signing up for RunCloud.

    With RunCloud, you can easily deploy, manage, and monitor your server. Give RunCloud a try today and take your website’s performance to the next level.

  • How to Set Up Cloudflare Tunnel to Access Your Server Without Opening Ports (2026 Guide)

    How to Set Up Cloudflare Tunnel to Access Your Server Without Opening Ports (2026 Guide)

    Exposing public ports on your server is a bit like leaving your front door wide open. If you’re managing Linux instances or running a web server, your systems are likely being pinged thousands of times a day by automated bots and scanners.

    In the past, securing a server meant taking on the headache of complex firewall rules, juggling SSH keys, or setting up jump hosts. But there’s a better way. Cloudflare Tunnel simplifies this approach by letting you expose your web applications, SSH access, and databases to the internet or only to authorized users, without opening a single inbound port on your firewall.

    In this guide, we’ll walk through how Cloudflare Tunnel works, how it compares with traditional VPNs and proxies, and the step-by-step process for getting it running on Ubuntu or Debian.

    What is Cloudflare Tunnel?

    Before we talk about Cloudflare Tunnel, let’s first look at how we’ve traditionally handled server access. Usually, when you connect via SSH or access a web app, traffic flows from your device across the internet directly to your server’s public IP address. That requires your firewall to keep those “doors” (ports 80, 443, and 22) wide open.

    Cloudflare Tunnel flips this dynamic entirely. Instead of your server listening for incoming connections, a lightweight background process, the cloudflared daemon, reaches out to Cloudflare’s edge data centers. Because the connection is strictly outbound, your server’s firewall can safely block all incoming traffic. You don’t even need a public IP address.

    How the Daemon and Named Tunnels Work

    When you set up a “Named Tunnel,” Cloudflare assigns it a unique ID (UUID) and creates a set of cryptographic credentials. Your cloudflared daemon uses these to stay connected. When a user tries to access your domain, Cloudflare routes that request through this secure, pre-established tunnel directly to your daemon, which then proxies it locally to your app or service.

    The cloudflared daemon connects to Cloudflare using these credentials. When a user requests your domain, Cloudflare passes that request through the secure tunnel directly to cloudflared, which proxies it locally to localhost:80, localhost:22, or whichever internal port your app uses.

    CloudFlare tunnel website screenshot

    Suggested read: Enable Zero-Trust SSH with Cloudflare on Windows, Mac, Linux, and ChromeOS 

    Comparing Cloudflare Tunnel to a VPN

    You might be wondering, “Why not just use a VPN?” While they both provide access, they serve different needs:

    • Cloudflare Tunnel works at the application layer (Layer 7). It’s perfect for exposing specific services, like a website or SSH, without giving someone keys to your whole network.
    • Traditional VPNs work at the network layer (Layer 3). They directly connect your device to the remote network and grant access to every IP address and port on that subnet.

    If you need full network-level routing, a dedicated VPN, or a mesh network like Tailscale is usually the better tool. But for securing individual apps or SSH access, Cloudflare Tunnel is hard to beat.

    Cloudflare Tunnel vs. VPN vs. Reverse Proxy

    If you’re trying to figure out which tool fits your infrastructure, here’s a quick breakdown:

    FeatureCloudflare TunnelTraditional VPNReverse Proxy (NGINX/Caddy)
    Inbound Firewall PortsNone (0 ports open)Requires 1 open portRequires ports 80 & 443 open
    Public IP Required?No (works behind CGNAT)YesYes
    Traffic ScopeApplication-level (Layer 7)Network-level (Layer 3)Application-level (Layer 7)
    Access Control IntegrationBuilt-in Zero Trust / SSORequires external AAA/RADIUSRequires manual auth modules
    DDoS ProtectionIncluded via CloudflareRequires third-party mitigationExposed to direct IP attacks

    Step-by-Step Instructions for Configuring Cloudflare Tunnels

    Now that we’ve covered the fundamentals and how Cloudflare Tunnel compares to traditional networking methods, let’s dive into setting it up. In the following section, we’ll walk you through the step-by-step process of installing and configuring Cloudflare Tunnel directly on your Linux server.

    Step 1: Getting Started with cloudflared

    Cloudflare allows you to create Quick Tunnels for free without creating a Cloudflare account. This is useful for previewing and shipping ideas globally in seconds. However, in this section, we will build long-lasting, remotely managed tunnels, and the quickest way to do so is from the Cloudflare dashboard.

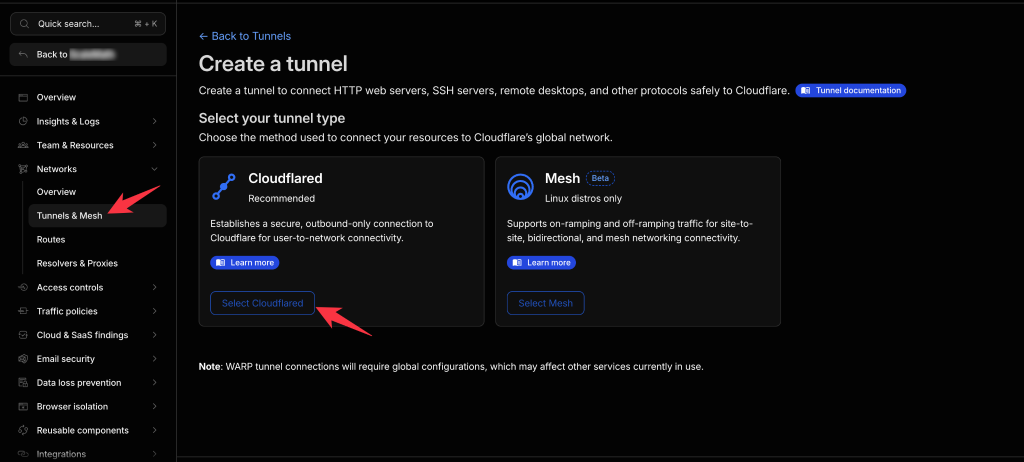
    Log in to your Cloudflare account and open the Tunnel management page. You can access this from Zero Trust > Networks > Tunnels & Mesh > Cloudflared.

    Cloudflare zero trust tunnel and mesh

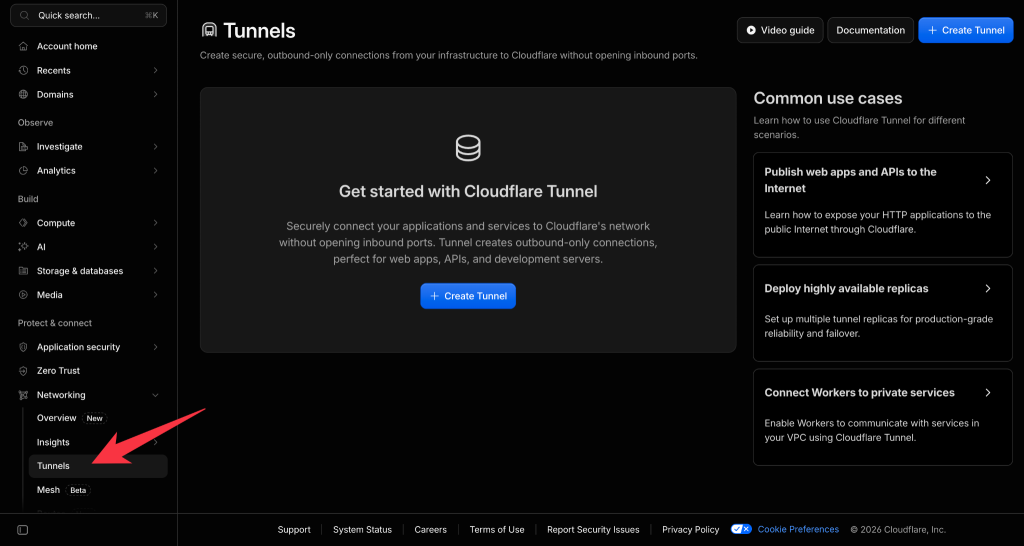
    Alternatively, you can also access the same Cloudflare Tunnel menu by navigating to Networking > Tunnels.

    Cloudflare tunnel dashboard

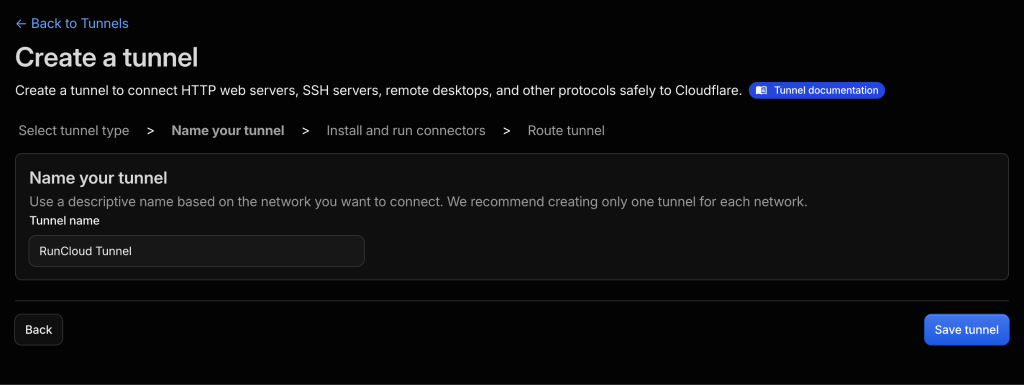
    On the next screen, you need to provide a descriptive name for your tunnel. After entering the name, click “Save tunnel” to create a new tunnel. 

    creating a cloudflare tunnel

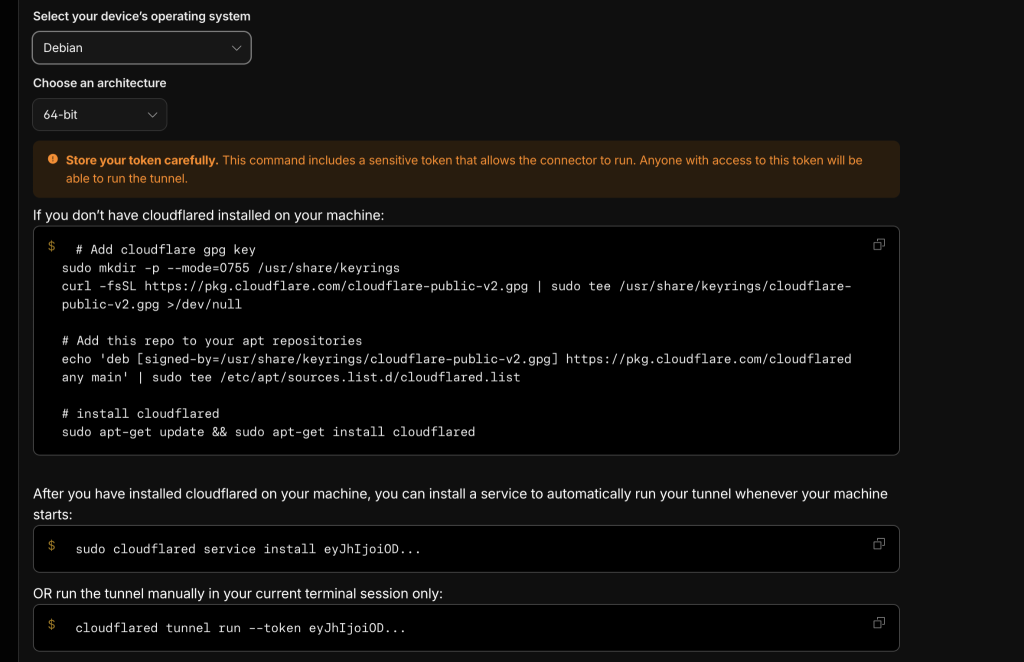
    With your tunnel configured, the next step is to install the cloudflared daemon on your server to establish the connection. The Cloudflare dashboard provides the installation commands for all operating systems. Simply copy and paste them into your terminal to get everything up and running.

    Suggested read: Cloudflare DNS for RunCloud (Security & Performance) 

    Authenticating the Daemon

    After the installation is complete, you’ll need to link your server to your Cloudflare account. If you followed the steps, you will see two commands on your Cloudflare dashboard. After you have installed cloudflared on your machine, you can pick what you want:

    • Install a service to automatically run your tunnel whenever your machine starts.
    • Run the tunnel manually only in your current terminal session.

    Copy and paste whichever command you wish to use. For this tutorial, we will only create a one-time tunnel. 

    Cloudflare tunnel installation commands

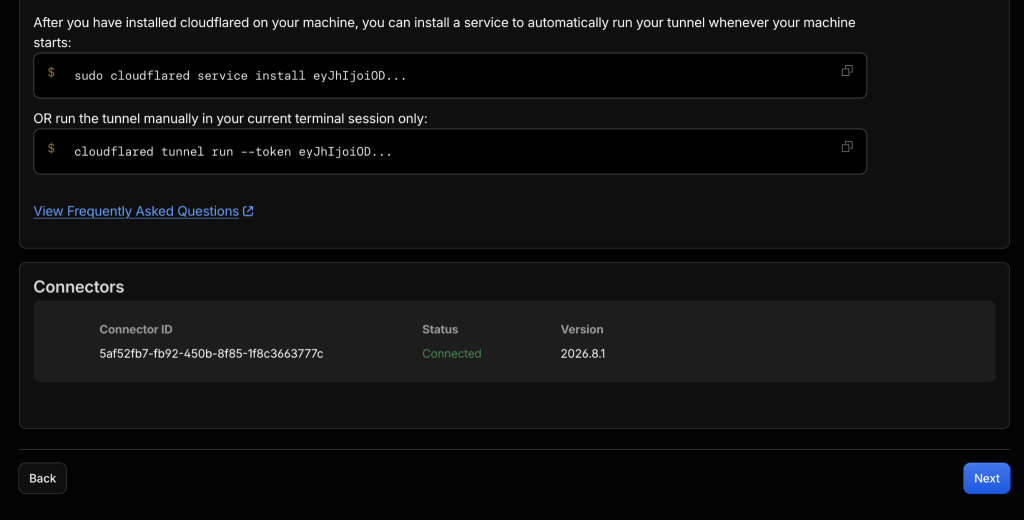
    Once the tunnel is up and running, you will see your device listed in the Cloudflare dashboard. If you want, you can install the daemon on more devices using the same command, or scroll to the bottom and click Next to add routes.

    Cloudflare tunnel commands

    Suggested read: How to Use Cloudflare Firewall Rules to Protect Your Web Application 

    Step 2: Publish Application Route

    Now that your tunnel is running, you can securely expose your local applications to the internet directly from the Cloudflare dashboard without needing further CLI commands.

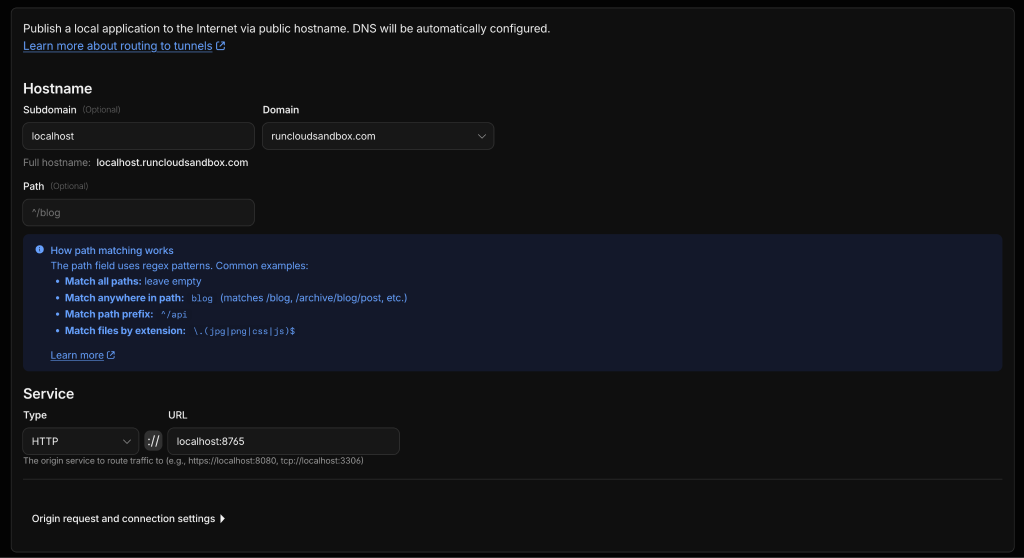
    To publish your application route:

    1. Under the Hostname section, enter your desired subdomain (e.g., ‘localhost’) and select one of the domains connected to your Cloudflare account.
    2. Optionally, specify a path to route specific URL paths to this service, or just leave it blank.
    3. In the ‘Service’ section, select the protocol (e.g., HTTP) and enter the local address of your application. For example, if your app runs on ‘localhost:8765’, enter ‘localhost:8765’.
    4. After making the necessary changes, save the settings. 
    Cloudflare tunnels setup

    Once saved, your application will be accessible via the public hostname you configured (e.g., ‘localhost.runcloudsandbox.com’). Anyone on the internet can now access your application as long as your tunnel is up and running. To stop unwanted visitors from viewing your application, we will now add Access policies to restrict traffic.

    Cloudflare Tunnels are not limited to standard HTTP traffic. You can easily route HTTPS, RDP, SSH, arbitrary TCP, and virtually any other protocol through them. The platform is extremely flexible and allows you to connect almost any self-hosted service or application. 

    Suggested read: Protect Your WordPress Login Pages with Cloudflare Zero Trust 

    Step 3: Secure Your Route with Cloudflare Zero Trust

    To prevent unauthorized users from accessing your server, you can secure it with Cloudflare Zero Trust. Whether you are protecting web applications, CLI connections, or SSH access, Cloudflare Zero Trust lets you gate access with identity controls. 

    While Cloudflare supports a wide range of authentication methods, this guide focuses on setting up a simple email-based One-Time Password (OTP) for quick setup.

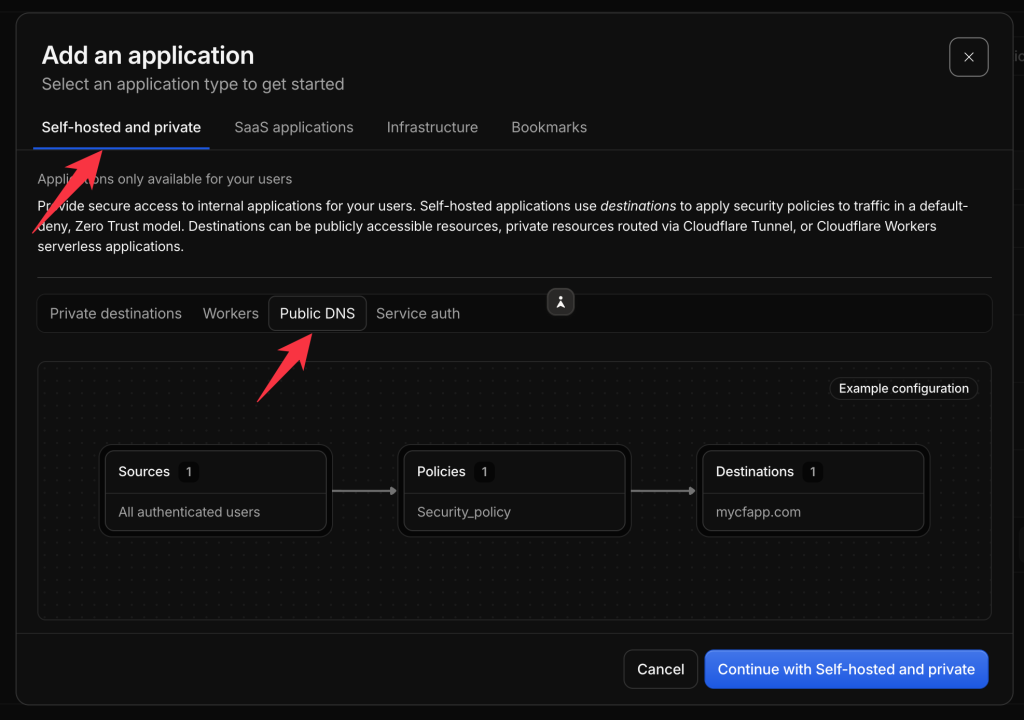
    1. Navigate to Zero Trust > Access Control > Applications.
    2. Add a new Self-hosted application using the Public DNS template, then click Continue.
    application setup in cloudflare zero trust
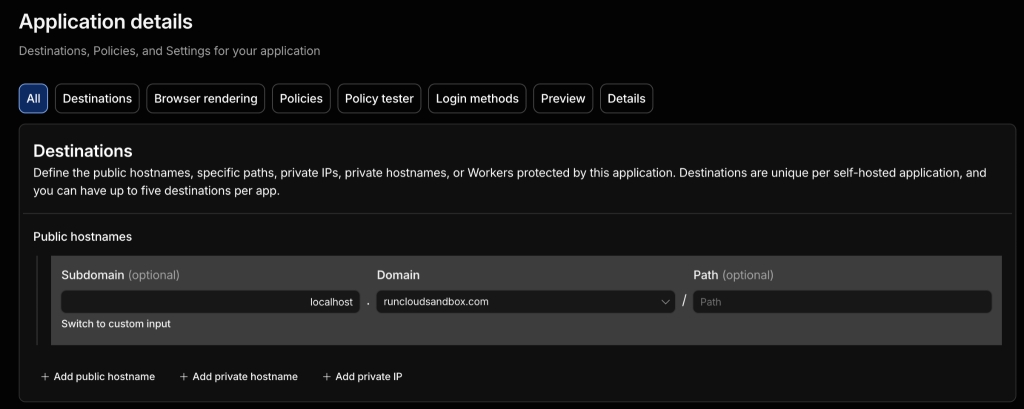
    1. On the next screen, under the Destinations section, set the subdomain, domain, and path settings to the same values that you configured in Step 2.
    domain setup in cloudflare zero trust
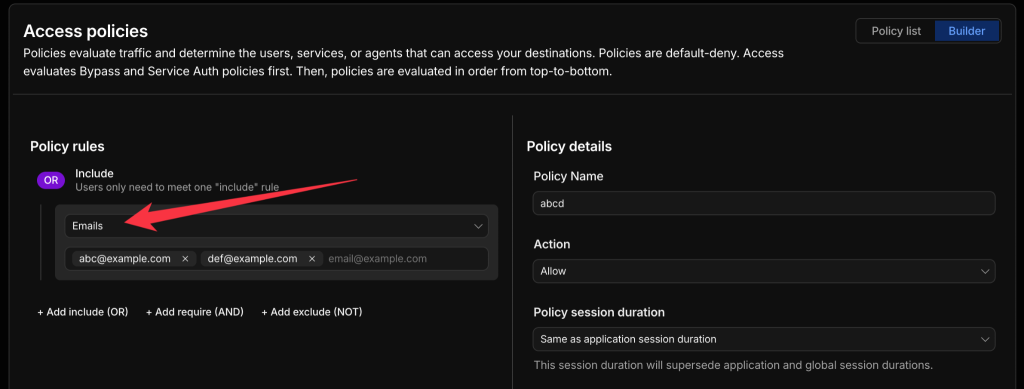
    1. Under the access policies section, create a new policy and create an access rule. You can create very complex rules as per your requirements. But to keep things simple, you can select “Email” from the dropdown and enter the list of email addresses that you want to allow access to. 
    access policies in cloudflare zero trust
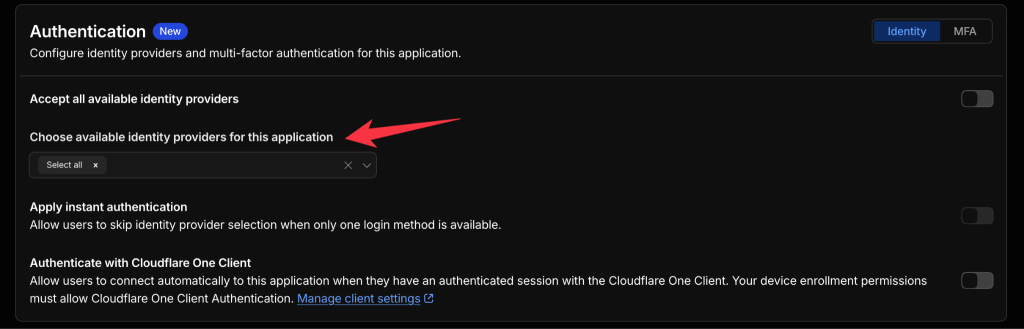
    1. After setting up your policy, you need to configure an identity provider. Scroll down to the Authentication section and under the “Choose available identity providers for this application” dropdown list, select “one-time pin”.
    2. After configuring your changes, save your settings. It usually takes a couple of minutes to take effect. 
    Authentication methods in Cloudflare zero trust
    1. After saving, anyone who tries to access your protected path will see this security prompt before they can access your application.

    Suggested read: The 8 Best Cloudflare Alternatives in 2026 

    A Simpler Alternative: RunCloud Web Terminal

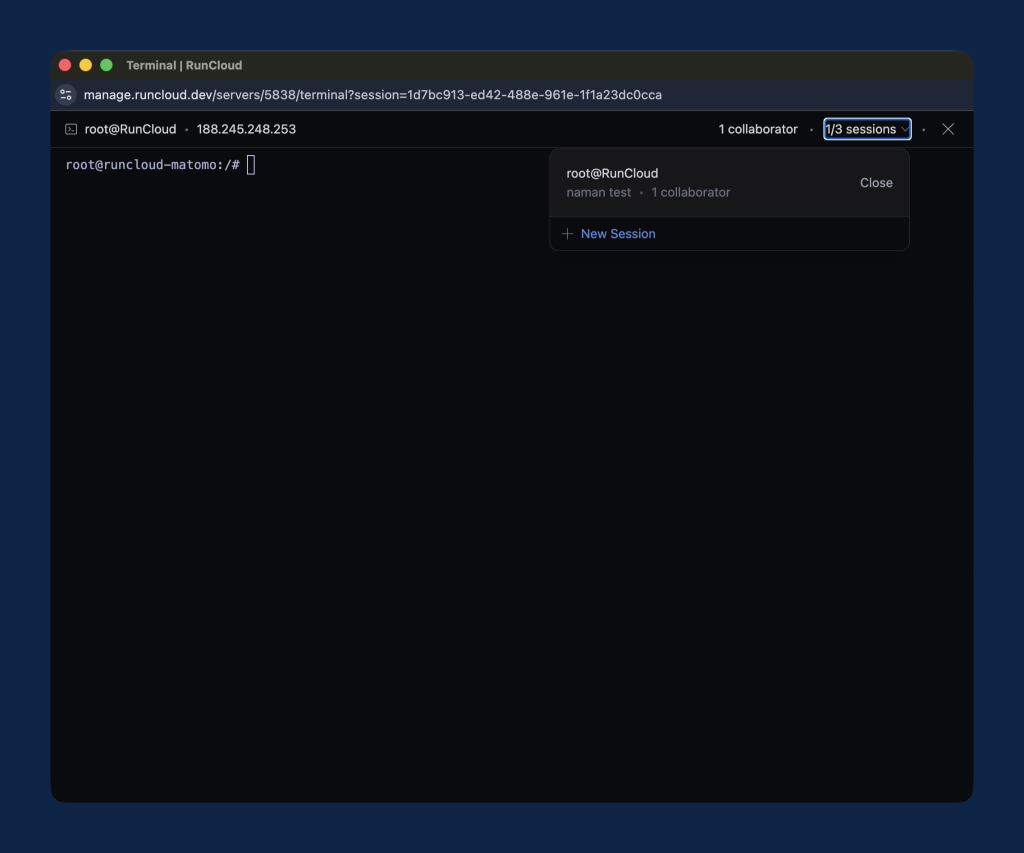
    While Cloudflare Tunnel is excellent for many use cases, you might be looking for a more streamlined way to access your server’s shell without the overhead of local configurations. That’s where the RunCloud Web Terminal comes in.

    This feature provides a collaborative, browser-based shell right in your RunCloud dashboard. It’s perfect for when you need to inspect logs, run a quick command, or collaborate with a teammate without opening ports or managing SSH keys locally.

    RunCloud web terminal dashboard

    Why you’ll love the RunCloud Web Terminal:

    • Zero Local Hassle: Access your shell from any device with a browser.
    • No Key Management: Forget about distributing and rotating SSH keys; access is handled securely through RunCloud’s permissions.
    • Enhanced Security: It’s off by default and requires 2FA, ensuring only you or those you authorize can access the shell.
    • Real-Time Collaboration: You and your team can work in the same terminal window, making debugging a collaborative effort.
    • Encrypted & Safe: Everything happens over an encrypted WebSocket connection via the RunCloud agent, keeping your secrets safe.

    It’s a fantastic way to maintain control while keeping your server’s SSH ports locked down.

    Wrapping Up

    Cloudflare Tunnel improves server security by eliminating the need to leave ports open. By routing your web apps, databases, and custom protocols through secure, outbound-only connections, you can unlock true Zero Trust protection against port scans and automated attacks.

    However, when you pair this with RunCloud, managing a secure infrastructure becomes even simpler. RunCloud takes your server management to the next level with built-in features like the RunCloud Web Terminal. This feature comes configured out of the box, and there is no need to configure additional policies or install daemons, so it is quick and easy to access your command line securely without ever exposing SSH ports to the public internet.

    Start your journey with RunCloud today.

    Frequently Asked Questions

    Is Cloudflare Tunnel free?

    Yes, Cloudflare Tunnel is completely free to use as part of the Cloudflare Zero Trust platform. You can connect your server to Cloudflare without paying for extra bandwidth or connection limits. This makes it an affordable, enterprise-grade solution for securing your web applications and managing your servers.

    Is Cloudflare Tunnel secure enough for production servers?

    Yes, Cloudflare Tunnel is built for production environments and uses outbound-only connections to prevent unauthorized access. By eliminating the need to open inbound public ports on your firewall, it protects your server from direct IP-based attacks and port scans. You also get automatic encryption and full integration with Cloudflare security and DDoS protection features.

    What is the difference between Cloudflare Tunnel and a VPN?

    A traditional VPN grants users full network access to your entire infrastructure, which creates significant security risks if a device is compromised. In contrast, Cloudflare Tunnel safely exposes only specific applications without exposing your underlying network or server IP address. 

    Can I tunnel SSH and a web app over the same cloudflared instance?

    Yes, a single cloudflared daemon instance can route multiple services simultaneously. You can configure your setup to direct web traffic to port 80 and SSH traffic to port 22 simultaneously. This setup lets you manage server access and web applications efficiently through one secure connection.

    What happens to my tunneled services if Cloudflare has an outage?

    If Cloudflare experiences an outage, your tunneled services will become temporarily unreachable from the public internet. However, your underlying server and applications remain safe and operational behind your firewall. Once Cloudflare restores its global network, the cloudflared daemon automatically reconnects your services without requiring a server reboot.

    Should I tunnel my database with Cloudflare Tunnel?

    You can tunnel database connections for internal administration or secure remote access between private servers. However, you should not expose database ports directly to the public web for general application traffic. Combining Cloudflare Tunnel with Cloudflare Access ensures that only authenticated administrators can securely access your database.

  • The 11 Best Website Uptime Monitoring Tools Compared (2026)

    The 11 Best Website Uptime Monitoring Tools Compared (2026)

    Downtime costs money and credibility. For SaaS companies and online businesses, a few minutes offline can mean lost customers, broken trust, and missed revenue. That’s why choosing the right website uptime monitoring tools is more than a technical decision – it’s a business priority.

    But with dozens of options on the market, how do you know which tool gives you the reliability, features, and pricing your team needs?

    We’ve tested and compared the best website uptime monitoring tools in 2026, breaking down their core features, pricing, and use cases so you can make a confident, informed choice.

    You’ll leave with a short list that fits your budget and growth plan – and keeps your site online.

    What is Website Uptime Monitoring?

    Website uptime monitoring means checking (from multiple locations) that your site loads and works, and alerting you the moment it doesn’t.

    A monitoring service is an automated system that continuously checks your website from multiple global locations. If this service detects that your site is down, slow, or displaying an error, it quickly alerts you via email, SMS, Slack, or similar channels.

    Why Uptime Monitoring is Essential for Websites

    Launching a website isn’t enough – what matters is keeping it online, fast, and reliable every hour of the day. For SaaS businesses, uptime isn’t just about user experience – it directly affects customer retention, revenue, and SLA commitments. Here’s why uptime monitoring matters:

    Improved Website Reliability and User Trust

    When users try to visit your site and find it unavailable, their trust in your brand diminishes. A website that is frequently down appears unprofessional and unreliable. Consistent uptime builds confidence and shows users that you are a dependable business, which is important for retaining visitors and customers.

    Faster Incident Response and Reduced Downtime

    Without monitoring, the first sign of downtime often comes from frustrated customers or public complaints. By that point, you’ve already lost revenue and credibility. Uptime data helps you prove SLA compliance, report to stakeholders, and keep customer trust.

    Better SLA Compliance and Performance Tracking

    Most SaaS businesses commit to strict uptime SLAs – often 99.9% or higher. Uptime monitoring provides the data to demonstrate compliance, generate reports for stakeholders, and build trust with customers and investors. It also provides long-term performance history, helping you spot recurring issues before they escalate.

    Data-Driven Insights for Optimization

    Modern tools track more than availability – latency, page speed, and regional performance are included. For instance, if you consistently see high latency in Asia, you can add a CDN to reduce slow-region drop-offs.

    Suggested Read: Uptime Monitoring Tools: Why You Need Them, and What to Look for

    Key Metrics Tracked by Uptime Monitoring Tools

    Uptime monitoring isn’t just a simple “yes” or “no” check. These tools track several key metrics to give you a complete picture of your website’s health.

    • Uptime Percentage: This is the percentage of time your website was online and available over a specific period (e.g., 99.95% in the last 30 days). This is the headline reliability number you’ll report to leadership and clients.
    • Response Time (Latency): This measures how quickly your server responds to a request. A sudden spike in response time can be an early warning that your server is overloaded, even before it goes down. Consistently slow response times in a specific geographic area can indicate that you need to optimize your infrastructure for that region.
    • Page Load Time is the total time it takes for a webpage to fully load in a user’s browser. This metric is one of the most important factors for user experience, as slow-loading pages lead to high bounce rates. Tracking this helps you identify if a recent code change or a large image negatively impacts performance.
    • HTTP Status Code Errors (e.g., 404, 500): This tracks the error codes your server sends back. A surge in “404 Not Found” errors could indicate broken links on your site after a redesign. A “500 Internal Server Error” means your application has a serious problem that needs immediate attention.
    • SSL Certificate Status: This check ensures your website’s SSL certificate is valid and not expired. This prevents the ‘Your connection is not private’ browser warning. However, if you are using RunCloud, then RunCloud renews SSL certificates one month before expiry.

    Suggested Read: Using Dynatrace to Monitor RunCloud Servers

    Top 11 Website Uptime Monitoring Tools Compared

    ToolFree PlanCheck FrequencyKey FeaturesBest ForStarting Price (USD)
    Better StackYes – 10 monitors, 3-min checks30 sec (paid), 3 min (free)Monitoring + incident management, status pages, integrationsTeams needing integrated monitoring + incident response$24/
    UptimeRobotYes – 50 monitors, 5-min checks5 min (free), 1 min (paid)Simple setup, generous free plan, status pagesStartups, small businesses, personal projects$7–8/mo
    PingdomNo (Paid from $10/mo)1 min+Synthetic checks, RUM, transaction monitoring, diagnosticsGrowing SaaS teams needing end-to-end visibility$10/mo
    Site24x730-day trial only1 min+All-in-one: uptime, RUM, server, API monitoringTeams needing one platform for uptime, RUM, servers, and APIs$35/mo
    Oh DearNo (10-day free trial only, no credit card required)Every 1 minuteBroken link crawler, scheduled task/cron monitoring, application status pagesWeb agencies, PHP/Laravel developers, sysadmins, and SaaS founders€15/month (up to 2 sites)
    StatusCakeYes – 10 monitors, 5-min checks30 sec–5 minUptime, page speed, domain & SSL checks, status pagesAgencies or small teams needing broad coverage$15/mo
    DatadogNo (Paid per test)1 min+Synthetic monitoring, APM/logs integration, self-healing testsMedium/large SaaS with complex systems$5 per 10k API tests
    New RelicYes – 100 checks/moVaries by usageSynthetic checks linked with APM, full-stack correlationTeams already using New Relic APMConsumption-based – free tier available
    UptrendsNo (Pay-as-you-go credits)30 sec–5 minConcurrent global monitoring, transaction flows, error snapshotsTeams needing accuracy & minimal false positives$5/mo (credits)
    SematextPay-as-you-go available1 min+Uptime + API monitoring, Core Web Vitals, public/private locationsTeams needing both public & internal monitoring$29/mo
    PulseticYes – Basic uptime + status page1–5 minUptime + branded status pages, simple incident commsTeams that prioritize clear incident comms with branded status pages, startups, and agenciesFrom $9/month (Solo)

    Better Stack

    Better Stack is more than an uptime checker – it’s a full incident management and monitoring platform. For teams running SaaS products or high-traffic websites, it helps ensure issues are caught quickly, alerts reach the right person, and communication with users stays clear. With checks running as often as every 30 seconds from multiple global locations, you avoid false positives and get accurate visibility. Its incident timelines, screenshots, and integrations with tools such as Slack, Datadog, and AWS make it suitable for teams that route alerts into Slack/PagerDuty and need on-call scheduling.

    Key Features

    • 30-second multi-location checks with screenshots and detailed logs
    • Incident management tools with on-call scheduling and smart alert merging
    • Integrations with major platforms (Datadog, Prometheus, Grafana, AWS, GCP, etc.)
    • Customizable public status pages for transparent communication
    Better Stack homepage promoting its monitoring and incident response platform.

    Pricing

    • Free plan includes basic checks, alerts, and status page functionality.
    • Paid tiers (from $29/month) add faster monitoring, richer alerting, and team workflows.

    When to Choose This Tool

    Better Stack is ideal if you need more than just basic monitoring. It’s a strong fit for SaaS companies, agencies managing multiple clients, and larger projects with dedicated support teams. Its greatest strength is combining monitoring with incident response, saving time and reducing missed alerts. If you’re solo or on a tiny project, it’s more than you need.

    Suggested Read: How UptimeRobot Can Save Your Website from Downtime Disasters

    UptimeRobot

    UptimeRobot is one of the most popular website uptime monitoring tools thanks to its simplicity and generous free plan. Setup takes minutes – add a URL, and you’re done. It covers the essentials without adding complexity, and supports HTTP(s), ping, port, keyword, SSL, and heartbeat monitoring. For small businesses, personal projects, or startups, it’s a cost-effective way to stay ahead of downtime before customers notice.

    Key Features

    • Free plan with up to 50 monitors checked every 5 minutes
    • Paid plans (from $7/month) offer 60-second checks, SSL/domain expiry alerts, and longer log retention
    • Status pages (public or private) for sharing uptime performance with customers or teams
    • Alerts delivered via email, SMS, Slack, MS Teams, Telegram, and more

    Pricing

    • Free: 50 monitors, 5-minute intervals
    • Pro plans: from $7/month for 60-second checks and advanced features
    • Higher tiers include more monitors, faster checks, and enterprise-ready features
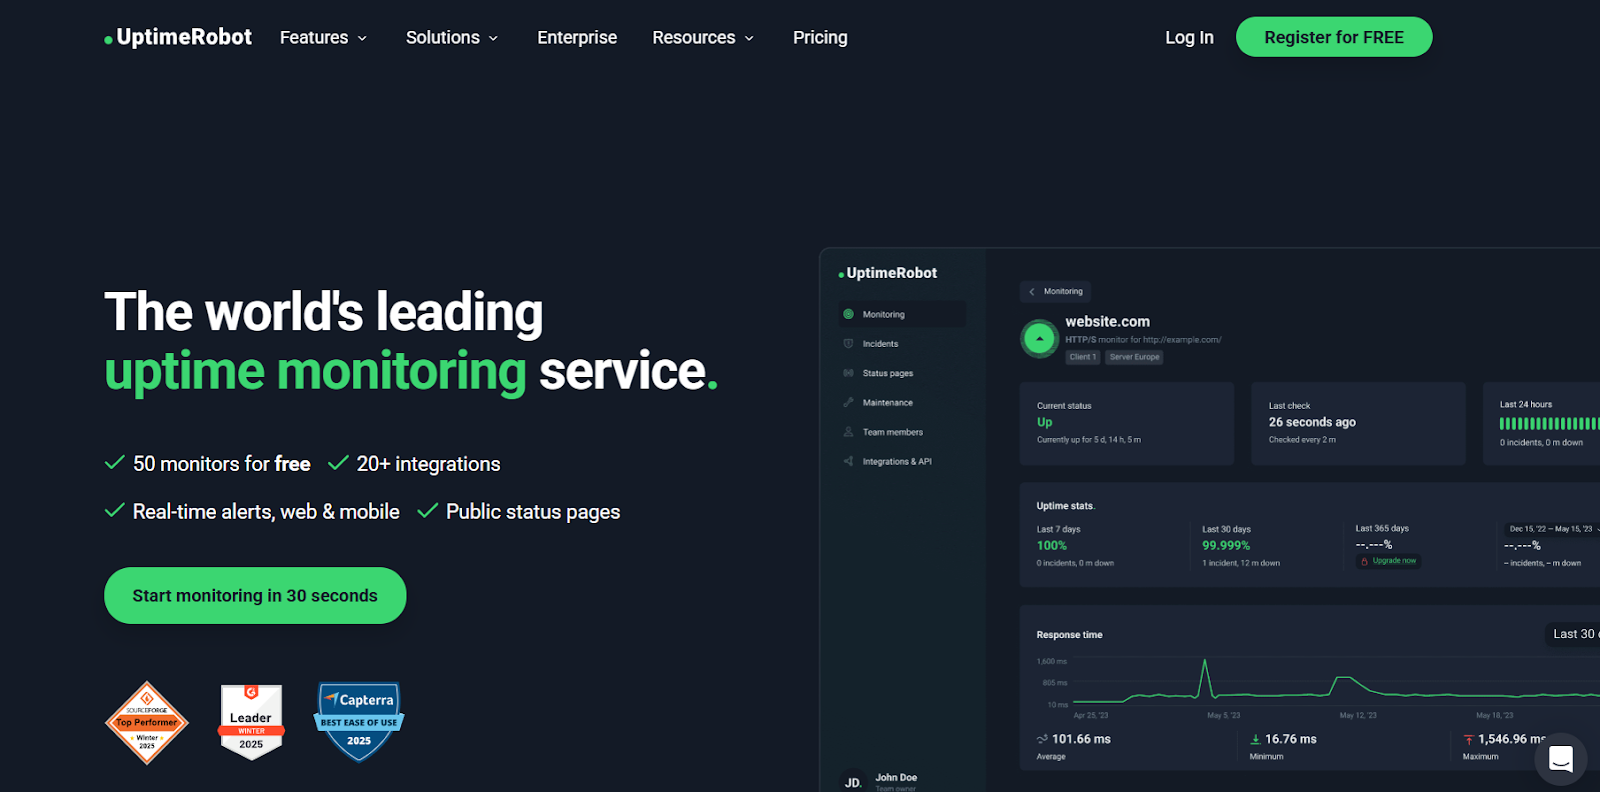
    UptimeRobot homepage showing its uptime monitoring dashboard and website performance statistics.

    When to Choose This Tool

    UptimeRobot is best suited to small businesses, personal sites, and early-stage startups that need dependable monitoring without high costs. The free plan is among the most generous available, making it a great entry point. Free checks run every 5 minutes – fine for basics, but not for mission-critical apps, so larger SaaS companies will likely need to upgrade to faster paid plans or consider a more advanced solution.

    Suggested Read: How to Reduce Cache Misses & Avoid Them: Proven Tips [FIXED]

    Pingdom

    Pingdom is a robust website and digital experience monitoring platform. It covers uptime checks, synthetic user flows, real-user monitoring (RUM), and page speed analysis – all from one dashboard. Plans start at $10/month and scale to high-volume enterprise use with thousands of checks, making it a strong fit for growing digital businesses.

    Key Features

    • Synthetic monitoring from 100+ global locations; instantly detect outages.
    • Transaction and page speed monitoring; includes root-cause tools like traceroutes and server response insights.
    • Real User Monitoring provides insights into how users experience performance, segmented by browser, geography, and device.
    • Public status pages and rich alerting (SMS, email, Slack, PagerDuty, etc.).
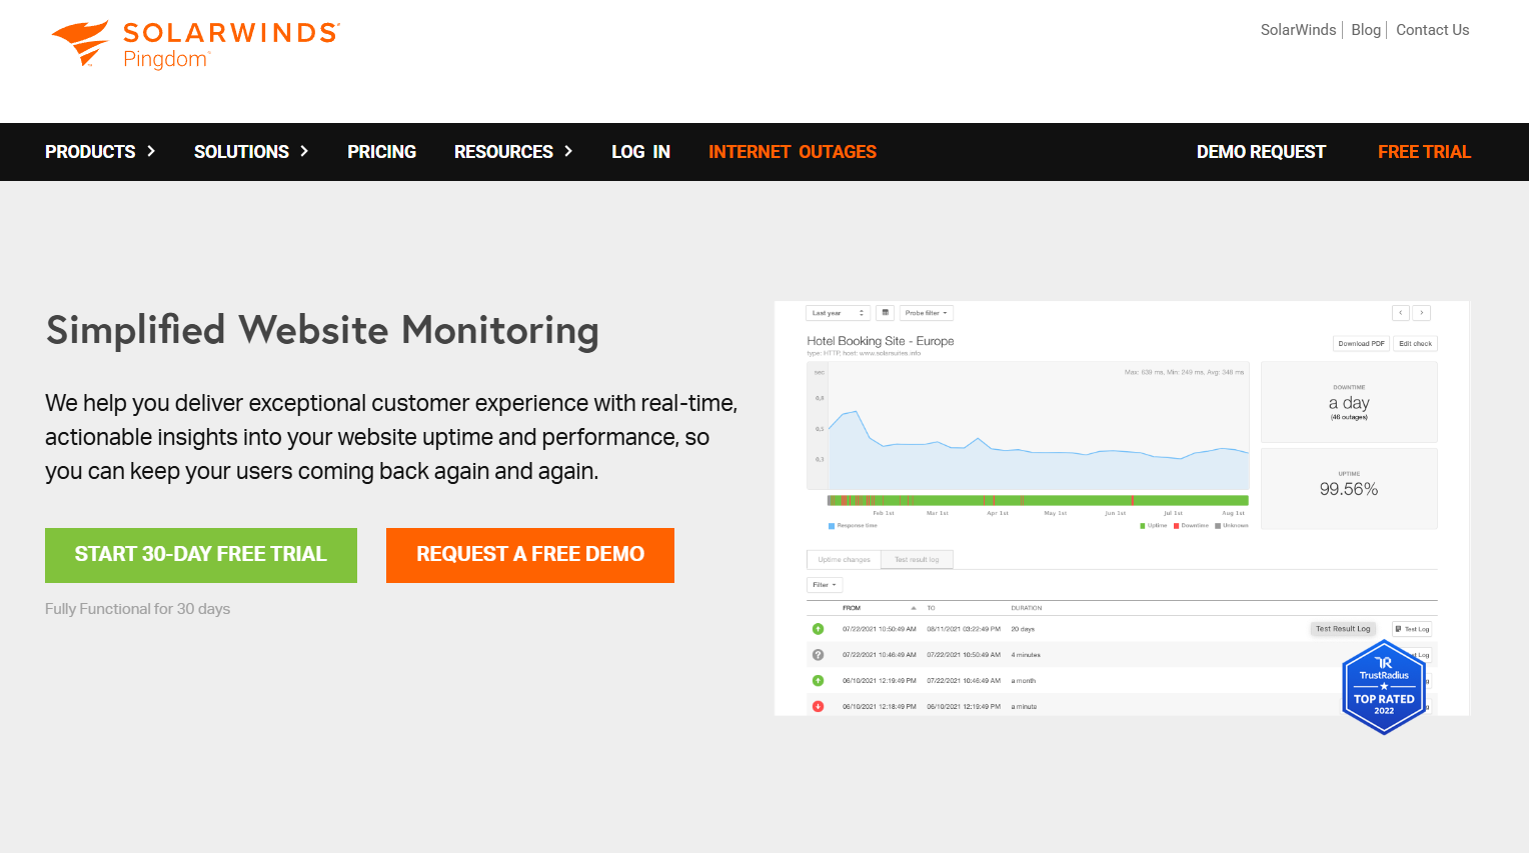
    Pingdom website monitoring page showing uptime and performance data in a monitoring dashboard.

    Pricing

    • Synthetic Monitoring plans begin at $10/month for 10 uptime monitors, one advanced check, and 50 SMS alerts. Scale up to tens of thousands of monitors at higher tiers.
    • RUM plans also start at $10/month for 100,000 pageviews and scale up to 1 billion pageviews.

    When to Choose This Tool

    Choose Pingdom if you need deep, multi-layered insight into your website’s performance and availability. It fits well with growing SaaS companies, high-traffic sites, or agencies managing complex user journeys. You’ll get the most value when you monitor checkout, signup, and other revenue paths end-to-end, but the interface has a learning curve, and pricing can escalate quickly as you scale.

    Site24x7

    Site24x7 is an all-in-one monitoring service from Zoho that goes beyond simple uptime checks. In addition to website availability monitoring, it offers server health tracking, API monitoring, and Real User Monitoring (RUM). With over 120 global test locations, it provides a single convenient dashboard for UX metrics and backend health.

    Key Features

    • Synthetic transaction monitoring simulates user flows such as login, checkout, or search to ensure business-critical processes function correctly.
    • Real User Monitoring (RUM) captures actual visitor performance by device, browser, and region.
    • Server and application monitoring covers CPU, memory, disk, and API endpoints.
    • Global network of 120+ monitoring locations provides detailed regional insights.
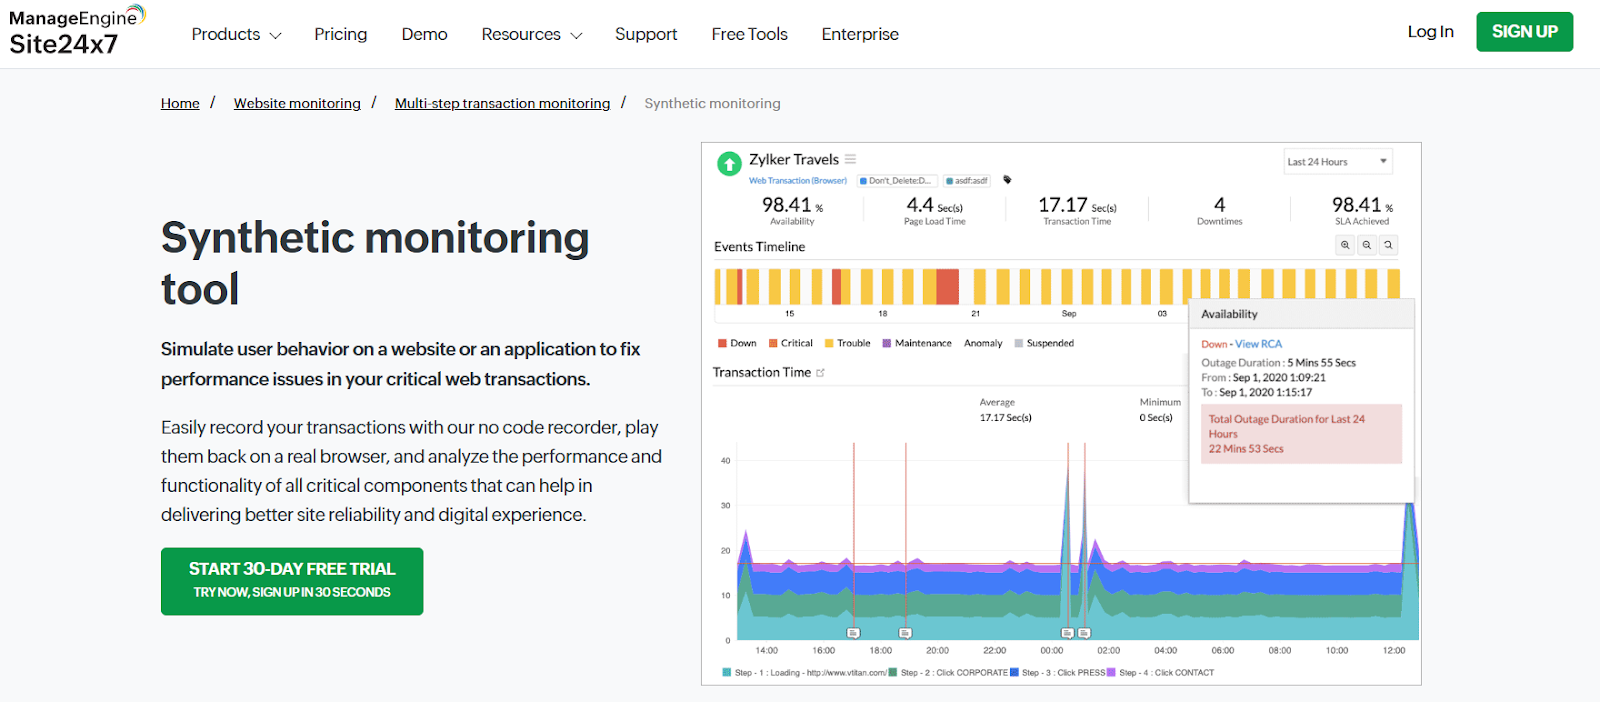
    Site24x7 synthetic monitoring page showing transaction performance charts and availability data.

    Pricing

    • Pro Plan: starts around $35/month (billed annually) with website and server monitoring.
    • Classic Plan: $89/month, offering expanded resources and checks.
    • Enterprise Plan: from $225/month, supporting large-scale monitoring needs.
    • All plans include a 30-day free trial.

    When to Choose This Tool

    Site24x7 is a strong choice for mid-sized to large teams who want a unified monitoring solution covering websites, servers, APIs, and user experience. It’s particularly useful for SaaS businesses with complex infrastructure or global audiences, since synthetic and RUM monitoring together provide a full performance picture. Pricing at higher tiers can stretch small budgets – its more advanced tiers can be costly for smaller projects compared to lighter tools like UptimeRobot.

    Suggested Read: How do you check Linux CPU usage or utilization? (5 Ways)

    Oh Dear

    Oh Dear takes a broad approach to website monitoring, combining uptime, SSL certificate, broken link, performance, cron job, and other checks into a single service. All features, including team features such as SSO, are available across its plans, with pricing based primarily on the number of sites you monitor. 

    In addition to basic uptime monitoring, Oh Dear provides a comprehensive health check for your entire website ecosystem.

    It can also monitor application health, API endpoints, scheduled tasks, and other processes that basic uptime checks may miss, alerting you to issues such as SSL certificate problems, broken links, failed cron jobs, and application health failures before they affect users.

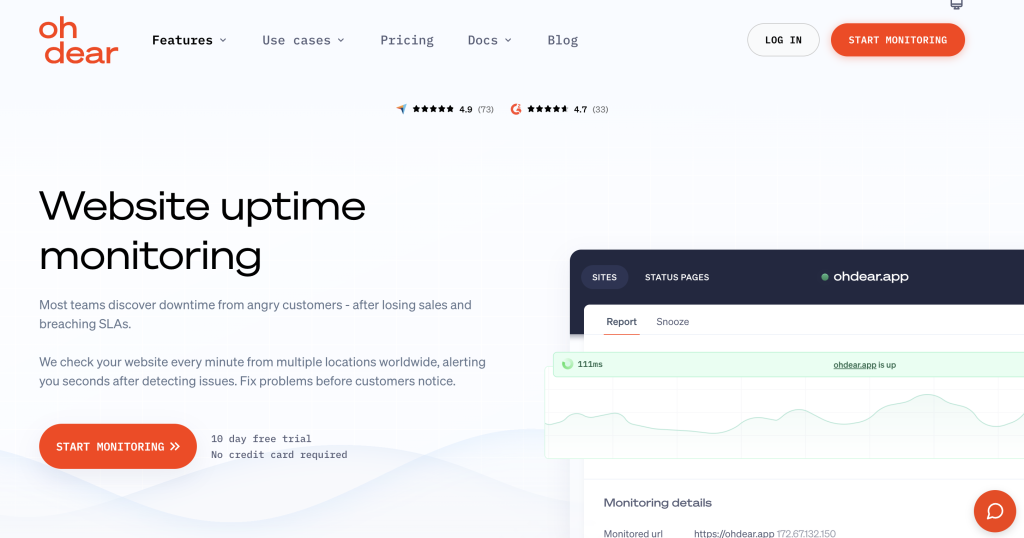
    Oh Dear website uptime monitoring page showing response time and monitoring details.

    Key Features

    • Holistic Health Monitoring: Tracks uptime, SSL certificates, broken links, mixed content, DNS records, and domain expiration dates in one place.
    • Deep Application Insights: Monitors scheduled tasks (cron jobs), API endpoints, and application health (queues, storage, cache) to ensure your backend processes are functioning correctly.
    • Performance & SEO: Tracks Lighthouse scores and monitors sitemaps to identify performance and SEO-related issues.
    • Client Reporting: Generates monthly reports and supports customizable status pages for sharing monitoring information with clients.
    • Instant Multi-Channel Alerts: Sends notifications via Slack, email, SMS, PagerDuty, and webhooks the moment an incident is detected.

    Pricing

    Oh Dear offers a transparent pricing structure where every plan includes full access to all features, so you never have to worry about missing out on essential monitoring tools. Pricing is based simply on how many sites you need to monitor:
    • Solo: €15/month for up to 2 sites.
    • Freelance: €49/month for up to 10 sites.
    • Studio: €99/month for up to 25 sites.
    • Larger plans are available for agencies and businesses monitoring more sites.

    When to Choose This Tool 

    Oh Dear is a good fit for web agencies, developers, and SaaS teams that want more than basic uptime monitoring without having to manage several separate services. Its combination of uptime, SSL, broken link, performance, DNS, cron job, API, and application health monitoring is particularly useful when you manage multiple websites or applications.

    It may also suit teams that want predictable access to features, since all plans include the same monitoring and team features. The main pricing variable is the number of sites you need to monitor.

    StatusCake

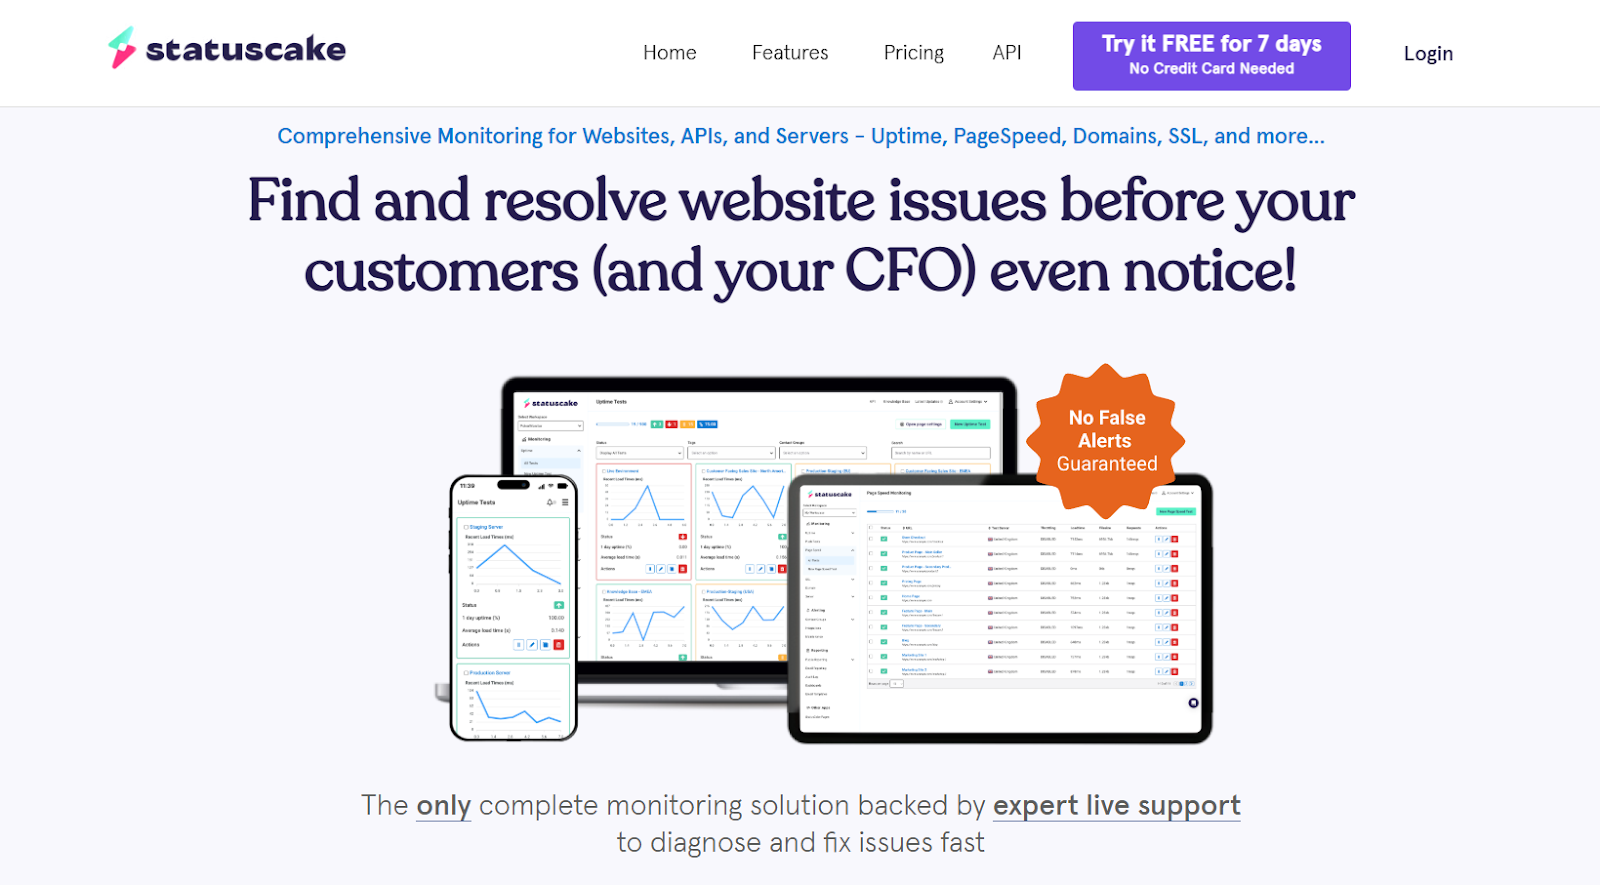
    StatusCake delivers reliable uptime monitoring, page speed, domain, server, and SSL checks. With 43 testing locations, flexible alerting, and a free tier, it covers uptime, page speed, domain/SSL, and server checks in a simple UI.

    Key Features

    • Flexible uptime checks at intervals as low as 30 seconds (depending on plan).
    • Page speed monitoring, domain expiration notifications, server resource checks, and SSL auditing.
    • Alerting via email, SMS, Slack, Discord, Telegram, and more.
    • Public status pages, sub-account management, tagging, and audit logs for team visibility and client reporting.
    StatusCake homepage showing website monitoring dashboards across desktop, tablet, and mobile devices.

    Pricing

    • Basic (Free): 10 uptime monitors at 5-minute intervals.
    • Superior: $15/month for 100 monitors, 1-minute tests, page speed, domain, server, and SSL monitoring.
    • Business: $50/month for 300 monitors, 30-second checks, team account access, and detailed logging.

    When to Choose This Tool

    StatusCake works when you need a wide feature set out of the box – especially helpful if you must track performance, domains, security, and server health together. It’s well-suited for agencies, small businesses, or teams managing multiple client sites. Benefits include deep visibility and strong alerting flexibility, but there are no RUM or scripted transactions, and some alerts/support options are available only on higher plans.

    Suggested Read: How To Install New Relic Monitoring on RunCloud

    Datadog

    Datadog is an observability platform that monitors more than just uptime. Its Synthetic Monitoring feature allows you to simulate user journeys and API calls from multiple global locations and correlate failures with backend traces, logs, and infrastructure metrics. This makes it especially valuable for teams running complex SaaS applications, where identifying the root cause of downtime is just as important as detecting it.

    Key Features

    • Codeless browser tests that simulate multi-step user interactions such as signup or checkout.
    • API monitoring with chained requests to validate data flows across services.
    • AI-powered “self-healing” tests that adapt automatically to minor UI changes.
    • Deep integration with Datadog’s wider observability suite: logs, metrics, APM, security monitoring, and incident management.
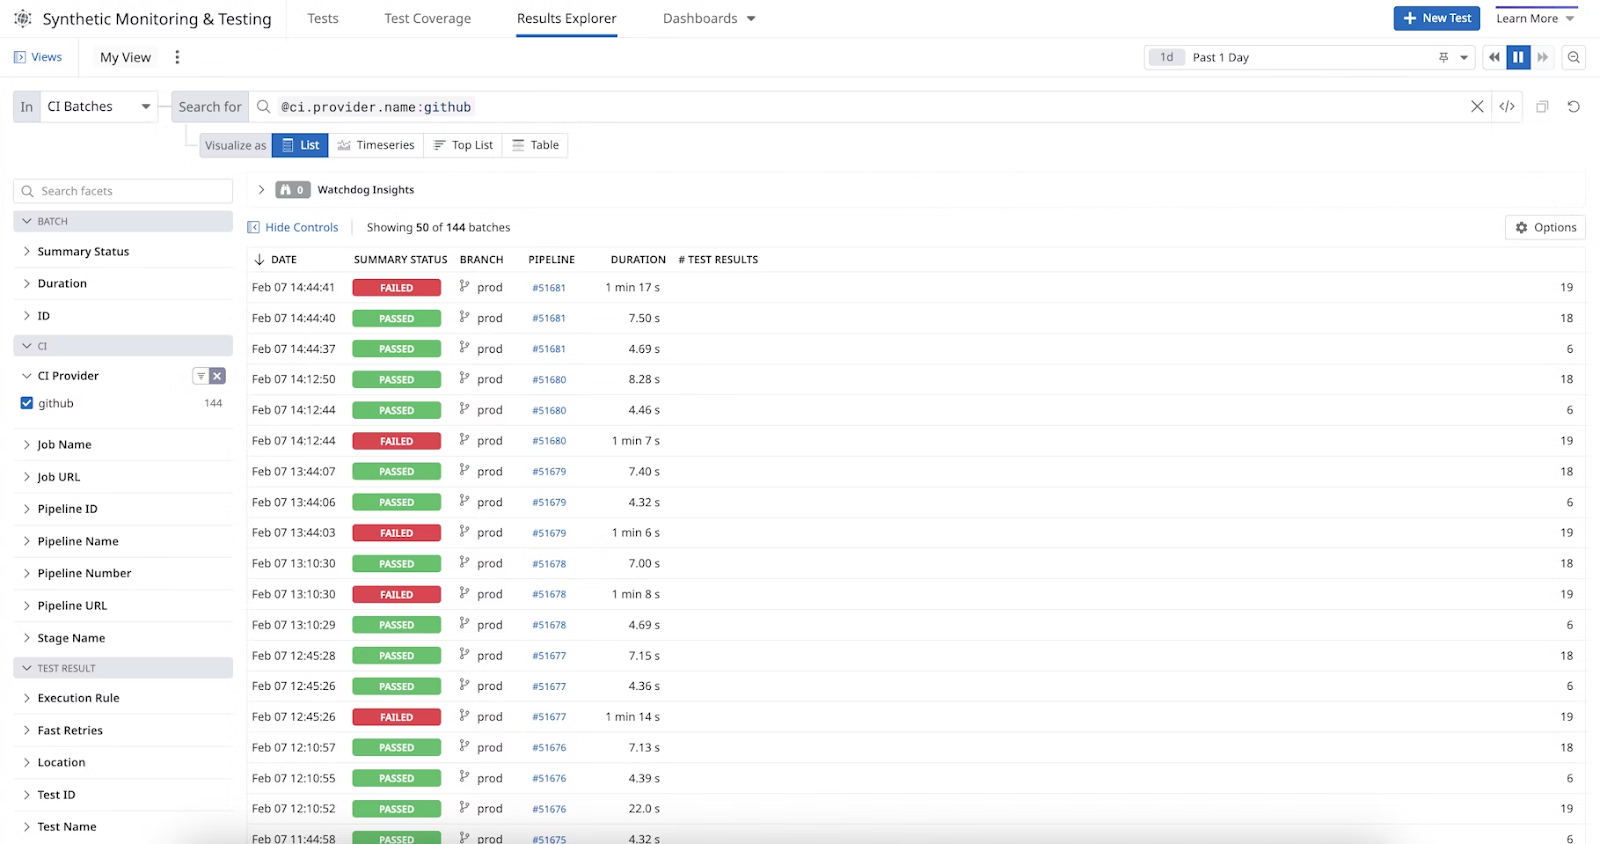
    Datadog Synthetic Monitoring results showing passed and failed CI test batches.

    Pricing

    • Synthetic API tests: start at $5 per 10,000 monthly test runs.
    • Browser tests: $12 per 1,000 test runs per month.
    • Additional pricing applies for Datadog’s broader observability products (infrastructure monitoring, APM, logs)

    When to Choose This Tool

    Datadog is best suited for medium to large SaaS companies or enterprises that already use – or want to consolidate monitoring within – a full observability platform. Its strength lies in combining uptime checks with deep diagnostics; use it when you need to quickly jump from alert to trace/logs. The main drawback is cost: Datadog can become expensive at scale, and smaller teams that only need uptime monitoring may find it more than they need.

    New Relic

    New Relic is a comprehensive observability platform with built-in synthetic monitoring. Its Synthetics feature allows you to simulate traffic and scripted user journeys from global locations, ensuring that critical workflows such as login, search, and checkout function correctly. Because it integrates tightly with New Relic’s Application Performance Monitoring (APM), logs, and infrastructure tools, it connects synthetic failures to APM traces, errors, and infrastructure data.

    Key Features

    • Browser-based monitoring to simulate multi-step user flows.
    • API monitoring to test endpoints, validate responses, and track performance.
    • Global testing from a distributed fleet of locations.
    • Full-stack correlation: connect synthetic failures directly to APM traces, error logs, and infrastructure data.
    New Relic Synthetic Monitoring page promoting simulated user journey monitoring for web applications.

    Pricing

    • Consumption-based model: you pay for the number of synthetic checks run.
    • Generous free tier includes 100 free synthetic checks per month.
    • Additional usage is billed per check; pricing scales with volume and is bundled into New Relic’s overall observability platform.

    When to Choose This Tool

    New Relic suits SaaS teams and enterprises that want monitoring embedded in a full observability ecosystem. If your developers already use New Relic APM, adding synthetic checks is a seamless way to connect uptime events to performance diagnostics. It’s especially valuable for teams managing complex applications where pinpointing the “why” behind downtime is critical. If you only need basic uptime, it’s heavy, and pricing can be harder to forecast.

    Suggested Read: How To Monitor Your Web App’s RAM & CPU Usage with Netdata

    Uptrends

    Uptrends is a dedicated website and infrastructure monitoring platform with a strong emphasis on accuracy and global coverage. With over 230 checkpoints worldwide, it verifies uptime and performance from multiple locations simultaneously, helping to eliminate false positives. Alongside uptime checks, it offers real browser, API, and transaction monitoring. Use it to script real flows – login, search, checkout – in real browsers.

    Key Features

    • Concurrent monitoring from multiple checkpoints to confirm true outages.
    • Real browser monitoring that measures full page load performance with waterfall reports.
    • Multi-step transaction monitoring for workflows such as logins, searches, and checkout processes.
    • Detailed error snapshots and traces for faster debugging.
    • Support for APIs, servers, and infrastructure components.
    Uptrends synthetic monitoring page for monitoring websites, APIs, and web applications.

    Pricing

    • Flexible, credit-based pricing model: credits are purchased and applied to different monitors (uptime, transaction, browser, API).
    • Entry-level uptime checks start from around $5 per month; more advanced monitors consume more credits.
    • The plan’s scale depends on usage, making it modular but potentially complex to budget.

    When to Choose This Tool

    Uptrends is well-suited for teams that need highly accurate monitoring with minimal false alarms, especially for global audiences. Its transaction and browser monitoring are useful for SaaS companies where user workflows must always function correctly. Agencies may also find credit-based pricing flexible when managing different types of clients. Credit pricing is flexible, but it’s easy to overspend if your checks grow.

    Suggested Read: How to Check Running Processes in Linux Using ps, top, htop, and atop Commands

    Sematext

    Sematext Synthetics is a flexible monitoring platform that combines uptime, API, and performance monitoring. It offers public test locations and private agents, so you can monitor both internal services behind your firewall and public-facing websites. Alongside uptime, it’s good for teams tracking reliability and Core Web Vitals in one place.

    Key Features

    • Uptime monitoring for websites, APIs, SSL certificates, and multi-step calls.
    • Core Web Vitals tracking, including Largest Contentful Paint (LCP) and Cumulative Layout Shift (CLS).
    • Flexible deployment: run checks from Sematext’s global network or from private locations.
    • Public and private status pages for transparent communication.
    • Detailed performance reports with waterfall charts.
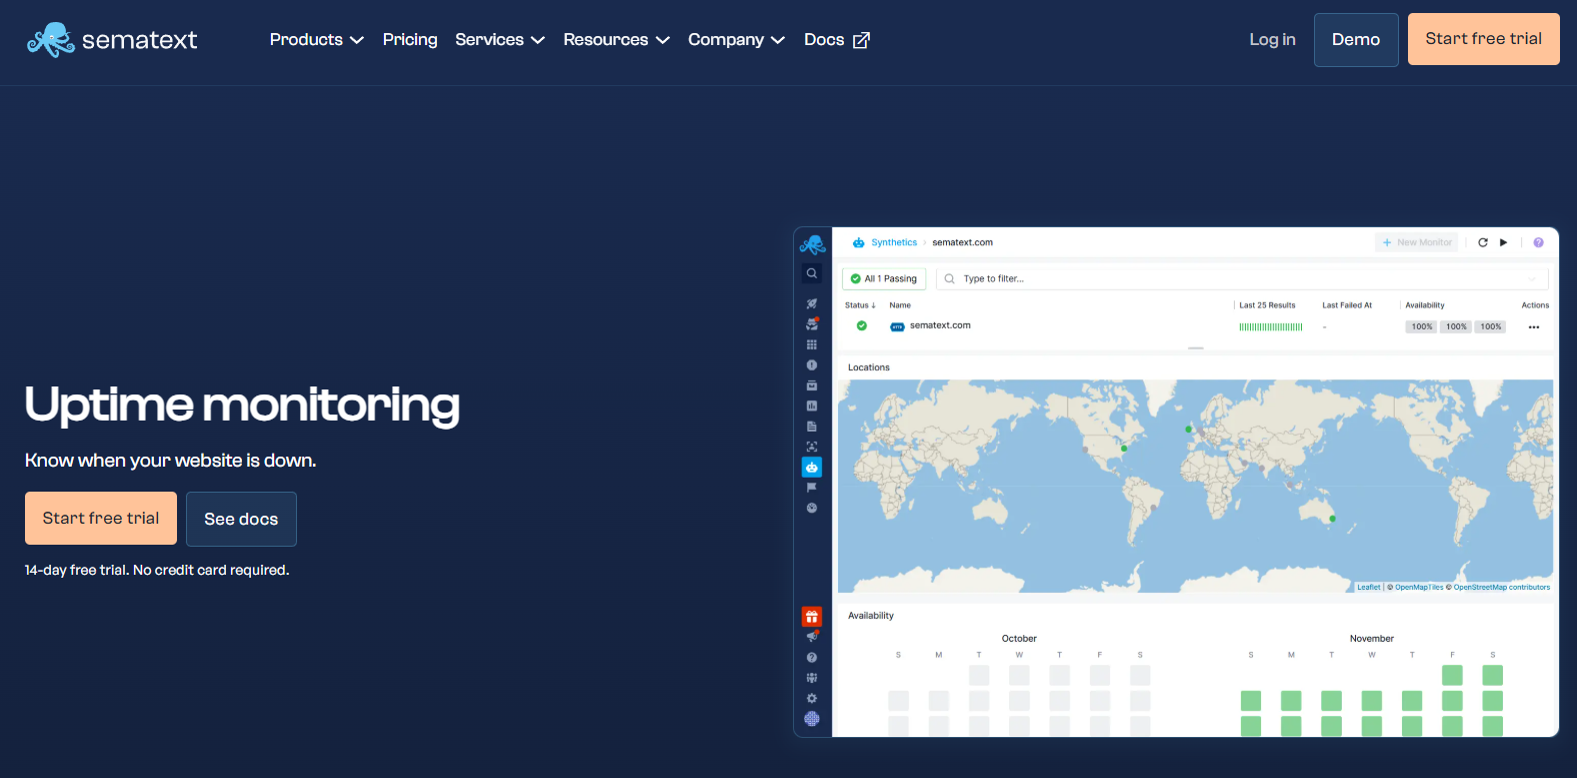
    Sematext uptime monitoring page showing global monitoring locations and website availability data.

    Pricing

    • Pay-as-you-go: charges per monitor, with granular usage control.
    • Standard plan: from $29/month for a bundle of HTTP and Browser monitors.
    • Pro plan: from $99/month, with higher limits and advanced features.

    When to Choose This Tool

    Sematext is best for teams that want flexibility, especially those needing to monitor both public and private applications. It’s useful for SaaS products where internal APIs or dashboards need to be as reliable as external websites. Core Web Vitals monitoring adds value for businesses focused on UX and SEO. It is less integrated than full observability suites, and costs rise with more monitors.

    Pulsetic

    Pulsetic is a modern uptime monitoring service that emphasizes status pages and incident communication. In addition to standard uptime and API checks, it allows teams to create visually appealing, branded status pages that keep customers informed during outages or maintenance. Alerts can be delivered via Slack, Telegram, email, or webhooks, making it a simple option for clean status pages and clear incident updates.

    Key Features

    • Uptime monitoring from multiple global regions with instant alerts.
    • Beautiful, customizable status pages hosted on your own domain.
    • Built-in incident management for posting updates and scheduling maintenance.
    • Flexible alerting via Slack, Telegram, email, and webhooks.
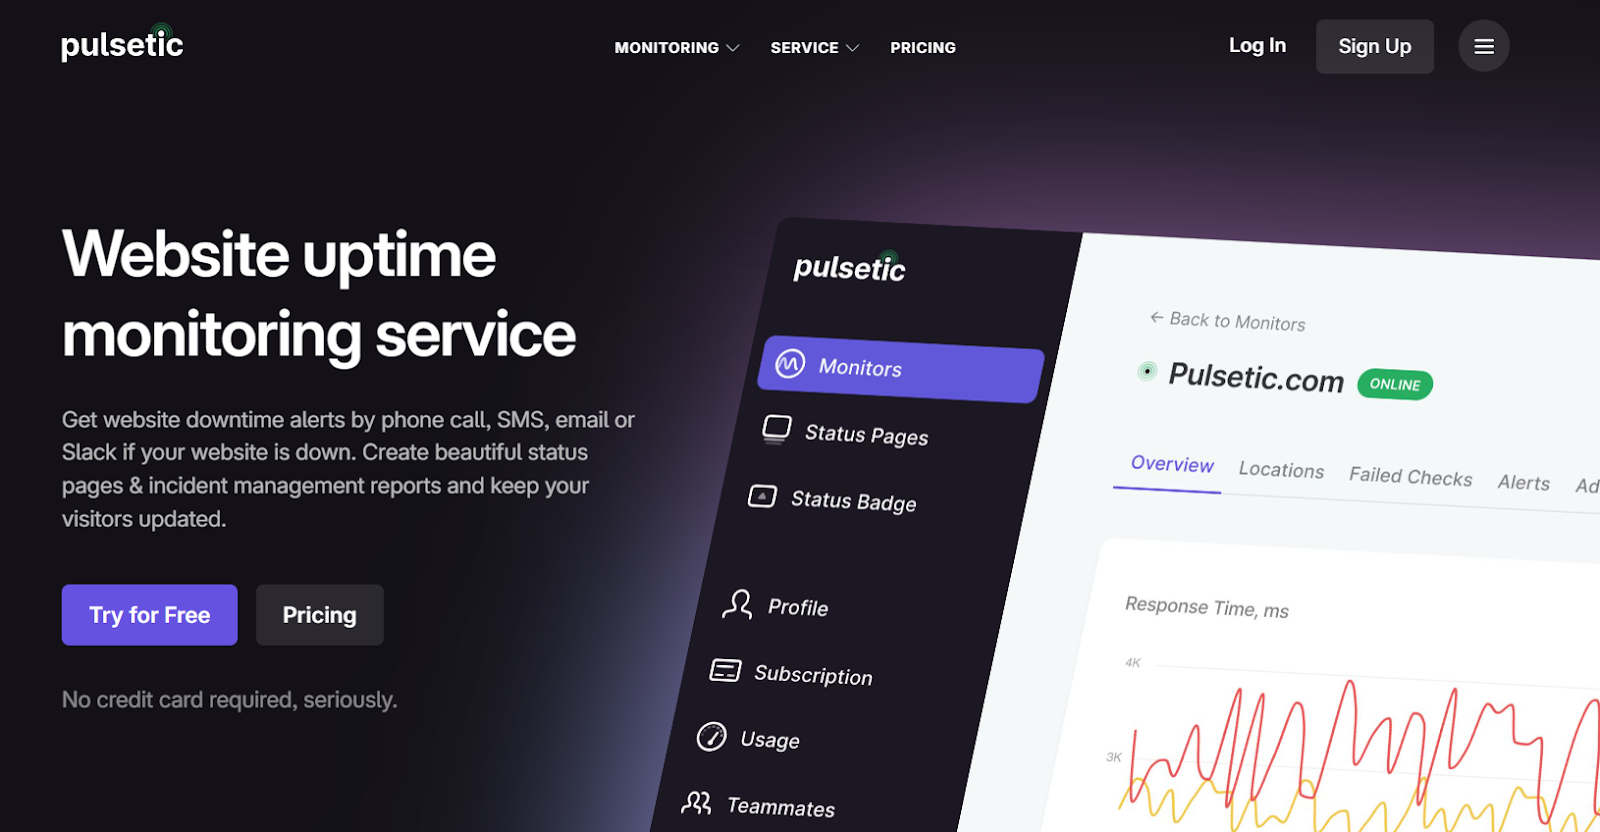
    Pulsetic website uptime monitoring page showing an online monitor and response time graph.

    Pricing

    • Free plan for basic uptime monitoring and simple status pages.
    • Paid tiers:
    • Solo: $9/month for individuals and freelancers.
    • Team: $19/month for collaborative use.
    • Organization: $49/month for larger businesses with more complex needs.

    When to Choose This Tool

    Pulsetic is best for teams that want uptime monitoring and professional, customer-facing status pages. It’s particularly useful for SaaS startups and agencies that need to communicate incidents clearly and maintain trust during downtime. The main limitation is that it lacks some advanced features (such as synthetic transactions or deep analytics) offered by larger platforms, so it is not designed for enterprise-scale synthetic or analytics needs.

    Final Thoughts

    Choosing the right uptime monitoring tool gives you visibility into outages, faster response times, and the data you need to keep customers confident in your service. But monitoring is only half the equation. If your hosting environment and server management aren’t reliable, even the best monitoring tool will spend more time alerting you to problems than helping you prevent them.

    That’s where RunCloud comes in.

    By pairing a powerful monitoring tool with RunCloud’s server management platform, you create a foundation that minimizes downtime from the start. With automated SSL renewals, server-level caching, and auto-healing services, RunCloud helps ensure your applications run smoothly – even during traffic spikes or unexpected errors.

    If uptime is critical to your business (and it should be), combine proactive monitoring with a hosting setup designed for resilience.

    Start building on RunCloud today and give your monitoring tools less to worry about.

    FAQs on Website Uptime Monitoring Tools

    What is the best free uptime tool?

    Many services offer excellent free plans for basic checks. UptimeRobot is a popular choice for getting started, as it provides reliable monitoring at no cost. You might consider paid services for more frequent checks and advanced features as your needs grow.

    How does uptime monitoring work?

    It works by using a global network of servers to act like virtual visitors to your website. These servers “ping” or try to load your site every few minutes, and if they receive an error or no response, the system triggers an immediate alert to notify you.

    Which tool sends instant alerts?

    Virtually all modern uptime monitoring tools, such as Better Stack and Pingdom, are built to send instant alerts. They can notify you through various channels such as email, SMS, and push notifications, ensuring you know about a problem the moment it happens.

    What is the easiest uptime checker?

    Tools like UptimeRobot are often considered the easiest for beginners because their setup is straightforward. You just enter your website’s URL and tell it where to send alerts. Services with clean user interfaces and clear instructions simplify the process.

    How often should uptime be checked?

    For most websites, checking every one to five minutes is the industry standard. This frequency provides a good balance between detecting issues quickly and avoiding unnecessary load on your server.

    Which tool is best for small sites?

    A tool with a generous free plan, like UptimeRobot or Better Stack, is often the best choice for small websites. These services provide the essential monitoring features you need without extra costs, which is perfect when you’re just starting out.

    What uptime tool works with Slack?

    Modern monitoring services, such as Better Stack, Pingdom, and StatusCake, offer excellent Slack integrations. This allows you to receive downtime alerts directly in your team’s channels.

    Is there an open-source uptime tool?

    Several excellent open-source options exist, with Uptime Kuma being one of the most popular. These tools give you full control and have no subscription fees, but they do require you to host and maintain the monitoring software on your own server.

    Which service tracks global uptime?

    Nearly all major uptime monitoring services, including Pingdom and Uptime.com, track global uptime by default. They use a network of “check locations” or “probes” spread across different continents to ensure your website is accessible to your entire audience, not just users near your server.

    What tool offers the most accurate reports?

    Accuracy comes from using multiple global check locations to confirm an outage before sending an alert, a feature found in most reputable tools like Pingdom or Better Stack. For the most complete picture, you can combine these external reports with internal server health data to quickly diagnose if the issue is with the network or the server itself.

  • Laravel Hosting: Best Platforms for Deploying Laravel Apps

    Laravel Hosting: Best Platforms for Deploying Laravel Apps

    Laravel currently powers over 1.5 million websites globally, and the ecosystem is growing faster than ever. Because of this massive growth, finding the best Laravel hosting has become a top priority for development teams, agencies, and enterprise architects. 

    This article compares several leading Laravel hosting solutions, including their strengths, pricing models, and suitability for different development workflows. 

    Common Challenges with Hosting Laravel Apps

    When choosing how to host a Laravel application, developers may need to consider the following challenges:

    1. The DevOps Burden of Unmanaged Servers: It takes a frustrating amount of time and effort to manage servers manually. Configuring NGINX, securing firewalls with iptables, manually renewing Let’s Encrypt certificates, and troubleshooting PHP-FPM bottlenecks require significant effort.
    2. Vendor Lock-in: Some managed and serverless platforms encourage the use of provider-specific databases, caching services, storage systems, or deployment configurations. The more closely an application depends on these services, the more work may be required to migrate it elsewhere. 
    3. Cost Predictability at Scale: Usage-based pricing can make monthly costs harder to predict, particularly during sustained traffic increases or unexpected spikes. In some cases, this can cost more than a flat-rate compute instance. 
    4. Architectural Isolation: Some server configurations make it difficult to run applications that require conflicting PHP versions or supporting services. Without suitable isolation, these differences can cause dependency conflicts. 

    Top Laravel Hosting Platforms

    The platforms below take different approaches to server management, application isolation, pricing, and scalability. The best Laravel hosting option will depend on your technical requirements and preferred level of infrastructure control.

    Laravel Forge

    Laravel Forge is a developer-focused server management tool and has been the go-to choice in the PHP community since 2014. It is created by the team behind the Laravel framework itself and is designed to provision and manage VPS instances across popular cloud providers such as DigitalOcean, AWS, and Hetzner. 

    The greatest strength of Forge is its deep, native understanding of the modern PHP ecosystem. It provides first-class support for managing background queue workers via Supervisor, handling scheduled cron tasks, and deploying database clusters straight from a clean, minimalist dashboard. If you work primarily within the Laravel ecosystem, Forge provides a closely integrated way to provision servers and deploy applications. 

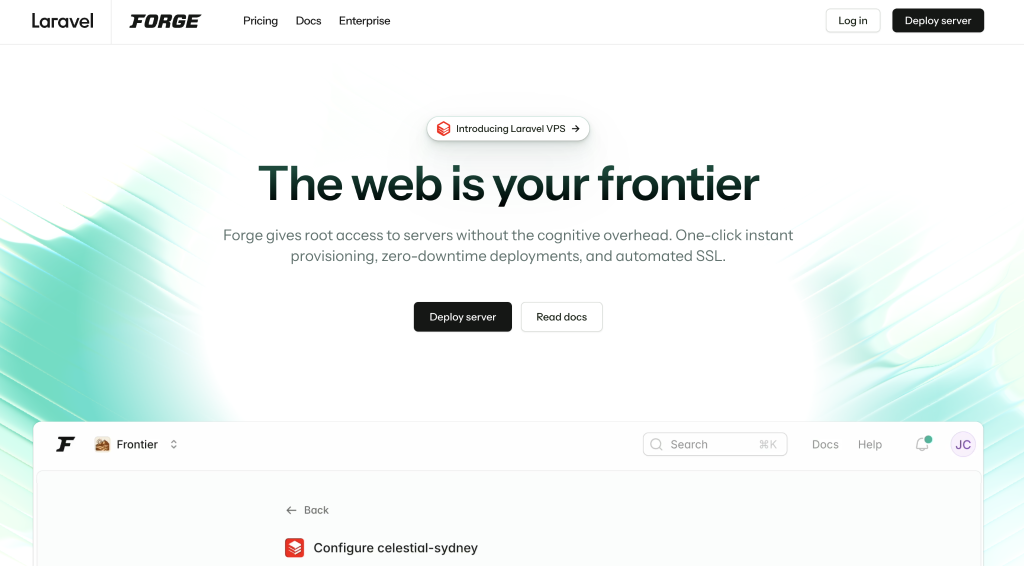
    Laravel Forge website homepage

    Suggested read: What is Laravel? A Comprehensive Guide for 2026

    While Forge is incredibly powerful, it traditionally installs your software stack natively onto the server’s operating system. This approach is highly efficient but may occasionally require extra care when running multiple applications on the same server that require conflicting versions of secondary services. For teams that prefer a deployment service created by the Laravel team, Forge remains a strong option. 

    Cost: Forge uses a SaaS model. The Hobby plan starts at $12 per month for managing a single server. As your needs grow, you can upgrade to the Growth plan at $19 per month for unlimited servers, or the Business plan at $39 per month to unlock advanced deployment workflows and priority support. You simply pay this flat management fee alongside your separate raw cloud server costs.

    Laravel Cloud & Laravel Vapor

    If you want to eliminate server management, you can use one of two first-party cloud solutions: Laravel Vapor and the newly launched Laravel Cloud. Laravel Vapor is a serverless deployment platform powered by AWS, while Laravel Cloud is a managed application platform built specifically for Laravel. Both reduce the amount of infrastructure that developers must manage directly. 

    Laravel Vapor deploys applications to AWS Lambda and can automatically scale application capacity in response to changing traffic. This makes it suitable for applications with variable or unpredictable workloads. Laravel Cloud supports hibernation for compatible compute resources. These resources can scale to zero while idle and resume in under 500 milliseconds when traffic returns, reducing compute charges during inactive periods. 

    Laravel Cloud website homepage

    Suggested read: How to Install and Deploy Bagisto (Laravel eCommerce)

    These platforms suit developers who want to reduce the amount of infrastructure they manage directly. Laravel Cloud automatically injects your environment variables, handles dedicated worker clusters for queue processing, and offers native support for managed databases. You can connect your repository and deploy your code while the platform manages much of the underlying routing and infrastructure. Scaling behavior and resource allocation can then be configured for the application. 

    Cost: These platforms rely on usage-based billing. Vapor offers a free Sandbox tier, while its paid plans and any underlying AWS resources incur separate charges. Laravel Cloud’s Starter plan costs $5 per month and includes $5 in monthly usage credits. Further charges depend on the resources used. This pricing can suit small or variable workloads, although costs may be harder to forecast than those of a fixed-price server. 

    Cloudways

    Cloudways provides a good balance between traditional shared hosting and complex cloud infrastructure by offering a fully managed experience. Instead of buying a server from DigitalOcean and connecting it to a separate control panel, Cloudways bundles the server and the management interface into a single, unified monthly bill.

    Cloudways includes caching, SSL management, backups, and several server security features. Other services, including CDN and malware-protection products, may be available as paid add-ons. Their platform is incredibly user-friendly, allowing you to launch applications, configure SSL certificates, and manage automated backups with just a few clicks.

    Cloudways website homepage

    Suggested read: How to Deploy Laravel with Docker on VPS in 2025 (Comprehensive Guide)

    The primary trade-off with Cloudways is its pricing structure at scale. Because they bundle the service, you pay a markup on the underlying server cost. While this is fantastic for one or two small servers, if you are running a digital agency that manages dozens of large servers, you may find that these markup fees become quite expensive compared to purchasing unmanaged servers directly. 

    Cost: Cloudways is highly attractive for single-server setups. Cloudways currently advertises DigitalOcean-based managed hosting plans starting at $11 per month, which include server resources and Cloudways’ management platform. Cloudways also provides 24/7 support, which may appeal to business owners who do not want to manage servers without assistance.

    Ploi

    Ploi is a SaaS server management panel designed for developers and agencies. Ploi connects to your VPS and offers an easy-to-navigate, functional interface. It also provides several unique features that anticipate the needs of modern web agencies.

    For example, it includes out-of-the-box support for load balancing, status pages, and staging-to-production deployment workflows. Furthermore, its seamless one-click installations across platforms such as WordPress, Statamic, and Nextcloud make it incredibly versatile for agencies managing mixed technology stacks.

    Ploi also offers a Team Management feature to help you collaborate with team members. You can create a team and maintain full control over who has access to what. It provides granular, role-based permissions that you can configure per user, per server, and per site. This makes it possible to grant a team member specific access, such as database-only rights, without compromising other areas. 

    Ploi website homepage

    Suggested read: Laravel With Git Deployment The Right Way

    It successfully takes complex infrastructure tasks, such as setting up load balancers or configuring database backups with external providers, and simplifies them into intuitive processes. 

    Cost: Ploi offers a free plan for one server. Its paid Basic plan costs €8 or $10 per month for up to 5 servers, while higher plans increase the server allowance and add more features. 

    Upsun

    Upsun is a modern, multi-cloud Platform-as-a-Service (PaaS) that offers deep, native integrations specifically tailored for Laravel development. Unlike traditional VPS management tools, Upsun manages the underlying infrastructure entirely across AWS, Azure, and GCP, while allowing you to define managed services (such as PostgreSQL, Redis, or RabbitMQ) directly in your configuration files.

    A notable Upsun feature is its support for preview environments. When you create a new Git branch, Upsun can automatically spin up an isolated preview environment that inherits live data, services, and routing from your production setup. This allows your team to test bug fixes and new features in a highly realistic, production-like setting before ever pushing to the live app.

    Upsun website homepage

    Upsun also includes built-in integrations for Blackfire.io to profile your database queries and queue jobs, along with environment-specific toggles for Laravel Telescope. It even supports dedicated worker containers for Laravel Horizon, ensuring your background queues never compete with your web traffic for resources.

    Cost: Because Upsun uses resource-based, per-second pricing, the final cost depends on the resources and services used. Its pricing calculator can provide an estimate, though the monthly total may vary based on the precise CPU, RAM, and storage your application consumes, alongside variable and fixed components such as user licenses (€10.00/user/month), project fees (€9.00/project/month), storage (€0.49/GB/month), backups (€0.10/GB/month), and request volume (€1.00/100,000 requests). 

    RunCloud

    RunCloud (that’s us!) is a server management platform for teams who want to use their own cloud servers and manage them through a graphical interface. It can connect to compatible Ubuntu servers from a wide range of cloud providers.

    What sets RunCloud apart is its innovative use of Docker-containerized servers. If you use the Dockerized server stack on RunCloud, you can isolate different web applications on your server. 

    RunCloud Laravel Environment editor

    This isolation can prevent dependency conflicts between applications and reduce the impact of an application-level problem on other containers. It also allows different applications to use different supported PHP versions on the same server. Container isolation does not remove the need to secure and update the host server and each application.

    RunCloud also offers Git with atomic deployment functionality. This minimizes application downtime during updates by preparing your new release in an isolated directory before updating the active web root symlink. To coordinate this process across your organization, you can use RunCloud’s teams and workspaces features to partition your projects and manage access permissions for your team members.

    Laravel Artisan

    You can also use the RunCloud API to configure applications, trigger deployments, and automate recurring server-management tasks. For high-performance setups, follow our guide to set up Laravel Octane on RunCloud servers.

    Cost: RunCloud uses flat-rate subscription plans, with cloud-server charges paid separately. The Essentials plan costs $9 per month for one server. The Professional plan costs $19 per month and supports up to 50 servers, while the Business plan costs $49 per month and supports up to 100 servers. Business also includes features such as atomic deployment, team management, a Web Application Firewall, and API access. 

    Total Cost of Ownership for Hosting Laravel Apps

    The relative cost of a PaaS, serverless platform, or server management panel depends on the application’s traffic, resource requirements, staffing needs, and operational model. A control panel may offer predictable management fees, while a PaaS can reduce the time spent on infrastructure maintenance.

    Direct cost comparisons between these platforms are difficult because they include different services and use different billing models. RunCloud and Forge charge a management subscription in addition to the cost of your servers. Cloudways combines managed hosting and server resources into a single price. Laravel Cloud and Upsun charge according to the resources and services used. 

    Infrastructure ModelManagement Fee TierCompute Cost ModelTCO: 1 Server / MoTCO: 10 Servers / Mo
    RunCloud (Essentials/Pro)$9 to $19 / moRaw compute ($6/svr)$15.00$79.00
    Laravel Forge (Hobby/Pro)$12 to $39 / moRaw compute ($6/svr)$18.00$99.00
    Cloudways (Managed)Bundled markupApprox. $14/svr base$14.00$140.00
    Laravel Cloud (PaaS)$5 to $200+ / moUsage-based / Scale$5.00+ usageVariable (High)
    Upsun (PaaS)Resource-basedUsage / Per SecondVariableVariable (High)

    Final Thoughts

    In this post, we have discussed several tools for managing and hosting your Laravel applications. Forge offers close ties to the Laravel ecosystem; Laravel Cloud and Vapor reduce the need for direct infrastructure management; Cloudways bundles hosting and management; Ploi provides agency-focused server tools; and Upsun offers a managed multi-cloud platform. RunCloud suits teams that want to retain control of their cloud servers while managing them through a central panel. 

    RunCloud offers a 7-day free trial for developers and teams who want to test its server management, deployment, and application isolation features.

    Start using RunCloud Today.

  • Best Free and Paid Plesk Alternatives for Web Hosting in 2026

    Best Free and Paid Plesk Alternatives for Web Hosting in 2026

    Plesk remains a capable server management platform, but its pricing, architecture, and feature set will not suit every developer or agency. Some users may prefer a lower-cost panel, a lighter server footprint, stronger multi-server management, or a platform designed more directly for cloud infrastructure. 

    The available alternatives range from traditional hosting panels to managed cloud platforms, developer provisioning tools, and decoupled server management services.

    In this article, we compare the strengths, limitations, pricing models, and intended users of several Plesk alternatives. This will help you identify whether a traditional control panel, managed service, developer tool, or cloud server management platform best fits your needs. 

    Best Plesk Alternatives in 2026

    The following options cover several product categories, including traditional hosting panels, managed cloud hosting, developer provisioning platforms, and cloud server management tools. 
    cPanel

    cPanel is a widely used web hosting control panel and, like Plesk, is owned by WebPros. It is designed primarily for shared hosting, reseller hosting, and account-based server management, although its structure may be less suitable for development teams seeking a unified cloud management workflow. 

    cPanel provides a graphical platform for managing websites, hosting accounts, databases, email, domains, and common server administration tasks.

    cPanel is widely known for its extensive ecosystem of third-party plugins and integrations. Its interface will be familiar to many hosting customers, which can reduce the learning curve for users moving between providers. It also includes tools for managing databases through phpMyAdmin, installing applications, creating email accounts, and administering common hosting services.

    WebHost Manager (WHM) allows administrators to create and manage multiple hosting accounts, customize branding, assign packages, and control account-level resources. Depending on the license, configuration, and installed extensions, cPanel can support automated backups, SSL management, malware protection, and WordPress administration through WP Toolkit. 

    cPanel website homepage

    One limitation for hosting providers is cPanel’s account-based licensing model. Costs increase as more hosting accounts are added, which can make pricing less predictable for providers managing a growing number of customer accounts. 

    cPanel also lacks Plesk’s multi-OS flexibility, as it runs exclusively on Linux distributions. This limitation makes it unusable for teams requiring native ASP.NET or MSSQL support. cPanel separates customer-level hosting management from server administration through WebHost Manager. This supports distinct administrator, reseller, and customer roles, but teams accustomed to a single multi-server dashboard may find the workflow less unified than newer cloud management platforms. 

    Cloudways

    Cloudways is a managed cloud hosting platform that sits between users and infrastructure providers such as DigitalOcean, AWS, and Google Cloud. It combines the underlying server with platform management, support, monitoring, backups, security maintenance, and deployment tools. As a result, its plans cost more than purchasing the same infrastructure directly from the provider. 
    Key Features

    Cloudways is strongest in the following areas:

    • Managed performance stack: Cloudways provides caching and performance tools such as Varnish, Redis, and Memcached, depending on the selected server and application configuration. 
    • Choice of cloud providers: Users can deploy servers through supported providers such as DigitalOcean, AWS, and Google Cloud without managing each provider’s infrastructure directly.
    • Managed security features: Cloudways provides tools such as SSL certificate installation, IP allowlisting, platform-level security updates, and account security controls.
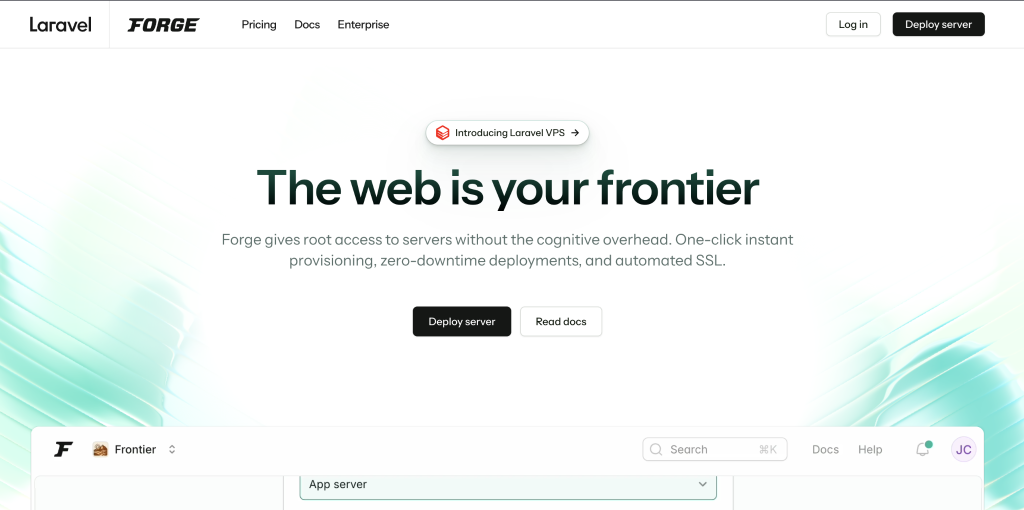
    Cloudways website homepage

    For agencies managing many servers, the difference between Cloudways’ pricing and the costs of the underlying infrastructure can be substantial. Teams should compare the added management and support services with the cost and responsibility of managing servers directly. 

    Cloudways does not provide root access to the underlying server. This reduces the amount of system administration required from the user, but it also prevents low-level operating system changes, custom system packages, and unsupported server stacks. It is therefore better suited to teams that value managed infrastructure than to administrators who need unrestricted server control.

    CyberPanel

    CyberPanel is an open-source, local-first web hosting control panel that integrates with the LiteSpeed web server engine. The biggest feature of CyberPanel is its native integration with LSCache (LiteSpeed Cache) at the server level. This integration provides WordPress and other supported applications with access to server-level caching, which can improve page load times and Time to First Byte when configured correctly. 

    CyberPanel also includes a WordPress staging environment, which allows developers to test changes separately before pushing them to a live site. The panel also provides tools for managing DNS, email services, databases, and FTP accounts. 

    CyberPanel offers a free core version that includes many of the features needed to host and manage websites. It may suit individual developers, small hosting providers, and users who specifically want an OpenLiteSpeed-based stack. This gives users a way to try an OpenLiteSpeed-based hosting stack without paying a panel license fee. 

    Enterprise users can also upgrade to LiteSpeed Enterprise directly through the panel. Users can begin with OpenLiteSpeed and upgrade to LiteSpeed Enterprise when they require its commercial features or support model.

    CyberPanel website homepage

    CyberPanel users should assess the quality of its documentation, update process, and available support before using it for production workloads. As with any self-hosted panel, administrators remain responsible for testing updates, maintaining backups, and resolving compatibility issues. 

    OpenLiteSpeed and LiteSpeed Enterprise use different licensing and worker-process models, so teams expecting high concurrency should compare the available editions carefully. CyberPanel is most closely associated with PHP and WordPress hosting, and users running other application stacks should confirm that its deployment model meets their requirements. 

    DirectAdmin

    DirectAdmin is an efficient web hosting control panel designed to streamline server and website management. It offers a clean interface for Administrators, Resellers, and Users, making it easy to manage accounts, DNS records, and email services.

    It includes an integrated ticketing system to support customers directly, fully customizable dashboard themes, anti-spam tools, and usage statistics. Its automatic crash recovery feature can detect certain failed services and attempt to restart them, helping reduce downtime when supported services stop unexpectedly. DirectAdmin supports FreeBSD and several Linux distributions, giving administrators a choice of supported operating systems. 

    These features make DirectAdmin suitable for hosting providers that want the account, reseller, email, DNS, and support functions of a traditional control panel while keeping panel overhead relatively low.

    DirectAdmin offers several license tiers based on account and domain limits, including plans for small servers and larger hosting environments. Its pricing and relatively modest server requirements can make it a practical option for providers that do not need the broader ecosystem associated with cPanel or Plesk. 

    DirectAdmin website homepage

    DirectAdmin is a strong option for hosting providers that want a traditional multi-user control panel with lower licensing and server requirements than some larger commercial platforms. DirectAdmin does not provide the same first-party WordPress management experience as panels with an integrated WordPress toolkit. Administrators may need third-party software for installation, staging, cloning, and update management, depending on their chosen configuration. 

    DirectAdmin is primarily installed and managed on individual servers. Providers operating a large server fleet may therefore need separate management processes or third-party tooling, rather than a single native dashboard that covers every server. 

    Laravel Forge

    Laravel Forge is a server provisioning and deployment platform designed primarily for Laravel and PHP developers. It simplifies tasks such as server provisioning, Git-based deployments, SSL setup, queue worker management, scheduled jobs, and application deployment.

    Forge’s lower-cost plans are aimed mainly at individual developers, while team access and wider collaboration features require a higher-tier plan. Agencies should compare the available user permissions and server limits with the number of developers who need access. 

    Laravel Forge website homepage

    Forge assumes that users are comfortable working with SSH, Git, and external database tools. It does not attempt to reproduce the file, email, and database management interfaces found in traditional hosting panels, so it is less suitable for non-technical users.
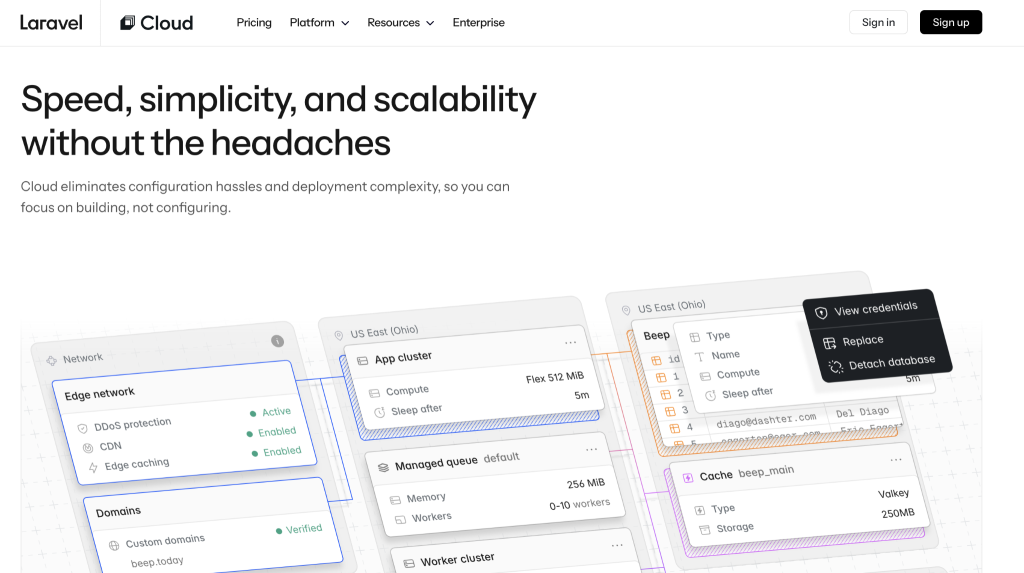

    Forge does not include traditional email hosting and is most useful within PHP-focused development workflows. Agencies managing a broad mix of CMS platforms, application runtimes, and customer hosting accounts may prefer a more general server management platform.
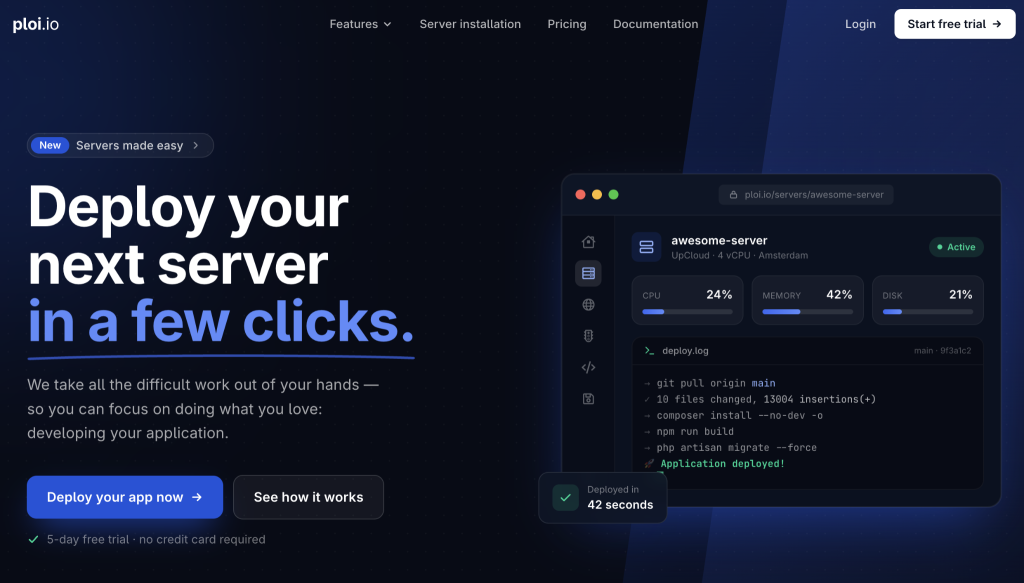
    Forge is best suited to Laravel developers who want fast server provisioning and deployment tools without the broader hosting features of Plesk. It is less suitable for teams that need email hosting, reseller accounts, visual file management, or support for non-technical customers. 

    CloudPanel

    CloudPanel is a free server control panel designed for cloud-hosted Debian and Ubuntu servers. It uses an NGINX-based stack and supports PHP, Node.js, Python, and static websites. 

    Its graphical interface provides access to server metrics such as CPU and memory usage, helping administrators monitor resource consumption and investigate performance issues. CloudPanel includes Cloudflare-related controls, IP and bot blocking, two-factor authentication, Let’s Encrypt certificate management, and a graphical virtual host editor for modifying NGINX configuration. 

    CloudPanel does not charge a panel license fee, although users must still pay for the server, backups, monitoring, email services, support, and any third-party security tools they require. It may be a cost-effective choice for technical users managing a small number of servers.

    CloudPanel website homepage

    CloudPanel is optimized for high-performance NGINX setups on Debian or Ubuntu systems, but its simplified structure introduces several operational limitations. CloudPanel operates as an isolated, single-server panel with no native support for multi-server management or centralized cluster coordination. Teams that require malware scanning, managed security monitoring, or preconfigured Web Application Firewall rules may need additional software or services. 

    Additionally, the panel does not support running Apache alongside NGINX in a hybrid configuration, which limits compatibility with legacy client sites that rely on custom .htaccess directives and requires manual translation of rewrite rules.

    CloudStick

    CloudStick is a SaaS server control panel aimed at web agencies, hosting resellers, and developers managing multiple client websites and servers. While many modern panels strip away traditional hosting features in favor of pure app deployment, CloudStick provides a comprehensive suite. It combines developer-focused deployment tools with features commonly found in traditional hosting panels, using an NGINX and PHP-FPM stack.

    It offers built-in email hosting, a visual database manager, and firewall rule controls within the panel. Its WordPress management features include plugin controls, automated updates, debug settings, Magic Link login, and reusable templates for deploying sites. CloudStick supports automated off-server backups to compatible object storage with configurable retention settings. Users should still test restoration procedures and maintain a backup policy suited to their risk requirements. 

    CloudStick website homepage

    CloudStick uses a pricing model that may appeal to agencies managing multiple servers. While the Basic plan starts at $9 per month for a single server, the Pro plan costs $19 per month and supports unlimited servers and websites, as well as team collaboration seats. 

    CloudStick is a hosted management service rather than a self-contained local panel, so users depend on the continued availability and support of the SaaS platform. Teams should also confirm that CloudStick’s supported operating systems, application stacks, backup options, and plan limits match their requirements before migrating a large server fleet. 

    ispmanager

    ispmanager is a commercial hosting control panel that combines website, database, DNS, email, file, and server management tools within a graphical interface. It sits between large hosting suites and narrower developer provisioning tools.

    Its graphical interface is intended to make common server and hosting tasks accessible without requiring every action to be completed through the command line. It supports Docker, Node.js, Python, and several database engines, including MySQL, MariaDB, Percona, and PostgreSQL. 

    The panel simplifies security and maintenance through built-in integrations with Cloudflare, DDoS Guard, and Fail2ban, as well as automated Let’s Encrypt certificate renewals. It also provides a file editor with syntax highlighting and supports backups to compatible external storage, giving users access to common maintenance tools from within the panel.

    ispmanager website homepage

    ispmanager offers tiered plans based on site limits and included features. Its entry-level pricing may make it a lower-cost commercial alternative to Plesk for users who still want vendor updates and support. Current prices, site limits, addons, and support terms should be checked before choosing a plan.

    Prospective users should confirm operating system support, language and regional support, multi-server management requirements, and any separately priced extensions. Teams already familiar with cPanel or Plesk may also need time to adapt their workflows and customer documentation. 

    HestiaCP

    Hestia Control Panel, commonly known as HestiaCP, is a free and open-source hosting control panel that began as a fork of VestaCP. It provides a graphical interface for users who want to manage websites, DNS, databases, email, users, and backups on a self-hosted server. 

    HestiaCP offers a comprehensive stack that supports multiple web servers, giving users the choice between NGINX and Apache architectures. HestiaCP includes email hosting alongside its web, DNS, database, and backup tools. This may suit users who want these services on the same server, although running email introduces added security, deliverability, and maintenance responsibilities. It also features a mobile-friendly interface, built-in backup tools, and controls intended to support server security and maintenance. It supports basic administrator and reseller roles and provides essential multi-tenant capabilities.

    Hestia Control Panel server management dashboard

    HestiaCP has no panel license fee. Users remain responsible for infrastructure costs, backups, monitoring, updates, security maintenance, and technical support. Because it is self-hosted, users must maintain both the panel and the underlying server. Community development provides transparency, but production users should assess release history, documentation, support, and update procedures for themselves. 

    HestiaCP may suit technical users who want a self-hosted panel with traditional web and email hosting features, but without a recurring license fee. It is less suitable for teams that require vendor-backed support, native fleet management, or a fully managed service. 

    Webuzo

    Webuzo is a hosting control panel focused on website and application deployment. Its available editions and plans support different account and hosting requirements, so readers should confirm whether they need its single-user or multi-user offering. Its different editions can support users who host their own applications as well as providers who manage multiple hosting accounts. It can be installed on supported virtual private servers and dedicated servers across a range of hosting providers. 

    One of Webuzo’s main features is its application installer, which supports a large catalog of scripts and content management systems, including WordPress, Joomla, and Magento. This can reduce the manual effort required to deploy supported applications. Webuzo is designed to run with relatively modest server requirements, which may make it suitable for smaller VPS instances. It supports both Apache and NGINX web servers. 

    Webuzo website homepage

    Webuzo offers lower-cost plans for users who want application installation and server management tools on a VPS. Pricing and included account limits vary by license, so readers should compare the current plans with their hosting requirements.

    Webuzo may suit personal site owners, small businesses, and developers who value rapid application installation. Users should choose the appropriate edition based on whether they need a single-user environment, multiple hosting accounts, reseller functions, or broader team access. 

    Enhance

    Enhance is a hosting control panel designed for multi-server and clustered environments. It uses container-based isolation and allows services to be distributed across multiple servers. Its central interface allows hosting providers to manage websites and services across a cluster, which may suit growing hosting businesses and agencies operating several servers. 

    It allows roles such as web, database, and email services to be distributed across different physical or virtual servers. This architecture can support redundancy and horizontal scaling when configured appropriately. This architecture allows businesses to add servers and distribute service roles as their requirements grow. 

    Enhance website homepage

    Enhance uses a usage-based pricing model calculated from the number of billable websites hosted on the cluster. It charges users at the end of each month based on the number of billable websites hosted on the cluster. Pricing is tiered, meaning websites are billed based on the tier they fall into. For example, under the pricing tiers described at the time of writing, a provider hosting 25,000 billable websites would pay the applicable rate for each pricing band.

    At the time of writing, Enhance does not count servers, staging sites, or soft-deleted websites as billable websites. Additionally, there are no charges for addon domains (additional domains mapped to a website), subdomains, aliases, or service websites, which include the control panel, webmail, and phpMyAdmin.

    Enhance is primarily aimed at hosting providers and teams building multi-server environments. Its cluster model and usage-based pricing may be more complex than necessary for users managing one or two servers, and monthly costs can vary as the number of billable websites changes. 

    RunCloud 

    RunCloud is a server management platform that uses a decoupled SaaS architecture rather than hosting its full management interface on each managed server. An agent installed on the virtual machine connects it to RunCloud’s browser-based console.

    Most of the management interface remains outside the server, while the agent handles communication and server operations. This can reduce the local resources required by the panel itself. RunCloud uses plan-based SaaS pricing rather than an account-based hosting panel license. This may provide more predictable costs for developers and agencies, depending on the number of servers, team members, and paid features they require. 

    RunCloud server deployment dashboard

    One of the primary barriers to using unmanaged cloud servers is the technical expertise required to configure and secure them. RunCloud reduces the amount of command-line work required for many routine tasks by providing a browser-based interface. Users still benefit from an understanding of Linux servers, DNS, networking, security, and application deployment. 

    This visual approach makes many administrative tasks available through browser-based controls. The interface lets users start, stop, and restart system services, manage multiple PHP versions on one server, map domains, and configure databases.

    RunCloud services dashboard as plesk alternative

    Security management is also simplified. RunCloud provides controls that assist with several common server-hardening tasks. Depending on the server configuration and plan, users can manage SSH settings, root login access, SSH key authentication, UFW firewall rules, and ModSecurity controls from the dashboard. These tools simplify configuration, but users remain responsible for maintaining the security of their servers and applications. 

    RunCloud integrates with Git hosting providers, including GitHub, GitLab, and Bitbucket. Users can connect to supported Git repositories, configure branch-based deployments, and run custom deployment scripts to perform tasks such as installing dependencies or clearing caches. 

    Deploying application via RunCloud Dashboard

    RunCloud is designed primarily for Linux cloud servers and developer-led hosting workflows. It does not replace every feature of a traditional panel, such as Plesk, particularly for users who need Windows hosting, built-in mail hosting, reseller account structures, or a fully managed hosting service. Users also remain responsible for choosing, paying for, and maintaining the underlying server infrastructure. 

    Plesk Alternatives at a Glance 

    PlatformProduct typeStarting price at time of writingBest suited toMain limitation
    cPanelTraditional hosting control panel$29.99/monthShared hosting and reseller environmentsAccount-based pricing and no Windows support
    CloudwaysManaged cloud hosting$11/monthTeams wanting managed infrastructure and supportHigher cost than buying infrastructure directly, and no root access
    CyberPanelSelf-hosted hosting panelFree core versionOpenLiteSpeed and WordPress hostingUsers must manage the server, updates, and much of the troubleshooting
    DirectAdminTraditional hosting control panel$5/monthHosting providers seeking a lower-cost traditional panelNo native unified multi-server dashboard
    Laravel ForgeDeveloper provisioning platform$12/monthLaravel and PHP development teamsNot a complete hosting panel and less accessible to non-technical users
    CloudPanelSelf-hosted cloud control panelFreeTechnical users managing individual cloud serversNo native fleet management or built-in email hosting
    CloudStickSaaS server control panel$9/monthAgencies managing PHP and WordPress serversSome multi-server benefits require the higher-tier plan
    ispmanagerCommercial hosting control panel€6.49/monthUsers wanting a lower-cost traditional hosting panelPlan limits and available features vary by tier
    HestiaCPSelf-hosted open-source panelFreeTechnical users wanting web and email hosting without license feesNo vendor-managed service or native server fleet dashboard
    WebuzoHosting and application control panel$2.50/monthSmall hosting environments and rapid application deploymentFeatures and account limits vary between editions
    EnhanceCluster hosting control panelFrom $0.15 per billable websiteHosting providers building multi-server clustersUsage-based costs vary with the number of hosted websites
    RunCloudSaaS cloud server management platform$9/monthDevelopers and agencies managing Linux cloud serversDoes not replace every traditional hosting panel or managed hosting feature

    Conclusion

    The right Plesk alternative depends on the type of hosting environment you manage. Traditional panels such as cPanel and DirectAdmin provide familiar account, reseller, email, and DNS tools, while platforms such as Cloudways, Forge, Enhance, and RunCloud address different managed hosting, deployment, and multi-server requirements. 

    When comparing these platforms, consider the operating systems you need to support, the number of servers and websites you manage, your team’s technical experience, and whether you require email hosting, reseller accounts, managed support, or root access. RunCloud is a strong choice for developers and agencies that want to manage Linux cloud servers through a central browser-based platform while retaining control over their chosen infrastructure. 

    Start managing your first server with RunCloud.

  • How to Block AI Crawlers (GPTBot, ClaudeBot, PerplexityBot, Bytespider) on Your Server in 2026

    How to Block AI Crawlers (GPTBot, ClaudeBot, PerplexityBot, Bytespider) on Your Server in 2026

    AI crawlers can consume bandwidth, increase server load, and collect your content without sending visitors back to your website. Blocking them isn’t as simple as adding a few lines to robots.txt, since not every crawler respects those instructions.

    You also need to distinguish between different types of AI bots.

    • Training crawlers such as GPTBot, ClaudeBot, and Bytespider collect content for AI development.
    • User-triggered agents, such as ChatGPT-User and Perplexity-User, may help your pages appear as cited sources in AI-generated answers.

    Blocking every AI-related user agent could reduce your visibility as well as your server traffic.

    This guide explains how to control AI crawler access without accidentally blocking legitimate search engines or useful AI referral traffic. You will learn how to:

    • Identify the AI crawlers you may want to block
    • Set rules in robots.txt
    • block requests at the NGINX server level
    • Configure Cloudflare’s AI crawler controls
    • Test your rules and confirm they work

    By the end, you will have a layered approach that gives you greater control over who can access your content and how much server capacity automated crawlers consume.

    Why robots.txt Alone Won’t Stop AI Crawlers

    AI-related crawlers serve several different purposes. Some collect content for model training, while others build search indexes or retrieve pages in response to a user request. High-volume crawling can consume bandwidth and server resources, but the impact depends on the crawler, its request rate, your caching configuration, and your application stack.

    This is exactly why you should identify the crawler and its purpose before deciding whether to block it.

    While adding a disallow directive to your robots.txt file is the traditional method for managing bots, it is ineffective against these bots because it runs on an honor system. Aggressive scrapers, poorly configured rogue bots, and many proprietary data brokers routinely ignore robots.txt entirely.

    If you want to protect your infrastructure and intellectual property, you need to implement server-level blocking using NGINX or implement other firewall measures. This allows you to intercept these unauthorized requests at the server level, where you can drop the connection by returning a 403 Forbidden response before the request ever reaches your web application or consumes your server’s computing resources.

    Suggested read: How To Use ModSecurity and OWASP CRS For Web App Firewall (WAF) To Secure Your Website

    Which AI Bots Should You Block in 2026?

    If you want to protect your server resources and intellectual property, you should prioritize blocking the following primary training crawlers.

    Targeting High-Volume AI Training Crawlers

    The following control tokens and user agents are associated primarily with AI training, model development, or large-scale dataset collection:

    • GPTBot
    • ClaudeBot
    • Bytespider
    • Amazonbot
    • Applebot-Extended
    • Google-Extended
    • Meta-ExternalAgent
    • CCBot

    Claude-SearchBot should be considered separately, as Anthropic uses it to support search results rather than for general model training. 

    PerplexityBot is also separate from bulk training crawlers. Perplexity states that it uses PerplexityBot to build its search index and surface links in Perplexity results, not to train foundation models. Blocking it may prevent your pages from appearing in Perplexity search results. 

    block AI crawlers

    Evaluating Real-Time AI Search Agents

    Real-time fetchers operate under a different set of rules than bulk scrapers. Instead of indiscriminately harvesting data, these digital assistants visit your server only when a human query explicitly triggers them to fetch your content. This makes them an important component for maintaining visibility in modern, AI-driven search results.

    Integrating with these tools can be a good marketing move, but it requires balancing visibility against your specific privacy concerns.

    • ChatGPT-User
    • Perplexity-User
    • OAI-SearchBot
    • Claude-User

    Allowing these agents enables AI services to retrieve and cite your current content in response to user requests. It doesn’t guarantee that your page will be selected, cited, ranked prominently, or visited by the user. However, if your domain contains sensitive data or strictly paywalled content, you should weigh your goals carefully. If you prefer total privacy over AI search exposure, block these alongside the bulk training bots.

    Anthropic uses separate user agents for different purposes. ClaudeBot crawls content for model development, Claude-SearchBot supports Claude’s search results, and Claude-User may retrieve a page in response to an individual user’s request. 

    Suggested read: How to Use Cloudflare Firewall Rules to Protect Your Web Application

    Will Blocking AI Crawlers Hurt Your Google Rankings?

    Blocking AI crawlers won’t harm your traditional Google Search rankings if you implement your security blocks correctly and target the right bots. Google designed its ecosystem to allow web admins to opt out of generative AI training without sacrificing their organic SEO visibility.

    Google uses the Googlebot user agents to crawl, index, and rank your pages in standard search engine results. For AI training and generative model grounding (such as feeding live search context to Gemini), Google uses a separate control token known as Google-Extended. Disallowing Google-Extended tells Google not to use your content for training and grounding in certain Gemini systems. Google states that Google-Extended doesn’t affect inclusion or ranking in Google Search.

    Google-Extended doesn’t control AI features that form part of Google Search itself. Access to those features is governed through Googlebot and standard Search controls such as nosnippet, data-nosnippet, max-snippet, and noindex.

    However, there is a massive technical caveat for web admins: unlike most web scrapers, Google-Extended doesn’t have its own separate HTTP request user-agent string. The physical crawling is still executed using standard Google crawler user agents, meaning the Google-Extended token functions purely in a control capacity within your robots.txt file.

    Because the phrase “Google-Extended” will never appear in your server’s incoming HTTP requests, you can’t block it at the NGINX or Cloudflare WAF level using a simple User-Agent string match. You must use the traditional robots.txt opt-out method for Google’s AI training and rely on server-level blocks for other companies’ bots.

    Because of this shared infrastructure, you must be extremely cautious when writing your NGINX rules or WAF policies. Using broad wildcards like *Google* or *bot* to stop scrapers will result in a catastrophic SEO failure, as you will accidentally block the legitimate Googlebot, Googlebot-Image, and Googlebot-Video indexers that your business relies on.

    Suggested read: Linux Server Hardening: 11 Steps to Secure a Production VPS 

    Implementing a Multi-Layered Strategy for AI Bot Management

    Relying on a single method for blocking unwanted AI traffic can leave your infrastructure exposed. If you want to build a truly resilient defense, it is best to implement a layered strategy that covers public directives, server-level interception, and network-edge filtering. This ensures that if one mechanism fails or is ignored, your subsequent layers act as a fail-safe to protect your server resources.

    Layer 1 – Block AI Bots with robots.txt

    To set up your first layer of defense, create or edit a simple text file named robots.txt and place it in the root directory of your website (usually the public_html or htdocs folder). 

    To edit your robots.txt, you can simply open your web host’s file manager, create this file, and copy-paste the code below to ask all major 2026 AI training bots to stay away from your entire site:

    User-agent: GPTBot
    User-agent: ClaudeBot
    User-agent: Bytespider
    User-agent: Amazonbot
    User-agent: Applebot-Extended
    User-agent: Google-Extended
    User-agent: Meta-ExternalAgent
    User-agent: CCBot
    Disallow: /

    Why robots.txt alone is not enough (RFC 9309 is advisory)

    While adding a robots.txt file is the industry standard first step, it is important to understand that it operates entirely on an honor system. RFC 9309 standardizes how crawlers should interpret robots.txt, but it doesn’t provide authentication or access control. Compliant crawlers follow its directives voluntarily, while another client can still request the same URL directly. 

    Reputable companies like Google and OpenAI currently program their bots to respect these rules, but aggressive scrapers, rogue data brokers, and malicious AI crawlers will completely ignore your robots.txt file and scrape your content anyway. Therefore, relying on this file alone leaves your server vulnerable to heavy automated traffic, so you must implement server-level blocking as well.

    Layer 2 – Block AI Bots at the NGINX Layer

    If you search for tutorials on how to block bots using NGINX, almost every old guide will tell you to place an if statement directly inside your server block (for example, if ($http_user_agent ~* "GPTBot") { return 403; }).

    Complex rewrite logic inside an NGINX if block can produce unexpected results, particularly when it is placed inside a location block. A simple condition that performs only a return is much less problematic.

    If you want to block traffic, you should use the map directive, which is a better and highly optimized alternative to if statements. When a visitor sends a request, NGINX checks their User-Agent exactly once against this map and assigns a variable (like a simple true/false flag). Because it is evaluated outside the complex location rules, it is incredibly fast and can automatically apply to every single website hosted on your entire server without repeating code.

    To implement this on your server, you will need to access your global NGINX configuration (often located in /etc/nginx/conf.d/) and create a new file named ai_bot_map.conf. Paste the following map directive into that file, which flags the 2026 AI bots with a 1 (true) if they match, and a 0 (false) for normal human visitors:

    map $http_user_agent $is_ai_bot {
        default 0;
        "~*GPTBot" 1;
        "~*ClaudeBot" 1;
        "~*Bytespider" 1;
        "~*Amazonbot" 1;
        "~*Meta-ExternalAgent" 1;
        "~*CCBot" 1;
    }

    Don’t add Google-Extended or Applebot-Extended to this map. They are robots.txt control tokens rather than independent crawler User-Agent strings. Instead, use robots.txt to control them. 

    Choosing the response code

    After identifying the crawlers, you need to decide how your server should handle them when they arrive. Here is a list of appropriate HTTP status codes you can return when rejecting a web request.

    403 Forbidden 

    Returning a 403 Forbidden status is the most common and standard choice because it clearly communicates to the bot that the server understood the request but is actively refusing to fulfill it. 

    444 (Nginx-specific, drops the connection with no response)

    If you are dealing with an incredibly aggressive bot that is hitting your server thousands of times a minute and draining your bandwidth, you should use NGINX’s special 444 response code. Unlike standard HTTP codes, 444 doesn’t send any headers or error pages to the bot; it simply closes the connection immediately. This can reduce the response work and outbound data associated with rejected requests, although NGINX must still accept and process the connection far enough to match the rule. 

    410 Gone (signals permanent removal, deters re-crawls)

    Another good option is to return a 410 Gone status code, which signals to the AI crawler that the resource it is looking for has been permanently deleted and won’t be returned. Use 410 Gone only when the requested resource has been permanently removed. Don’t return 410 solely as a bot-blocking technique for pages that remain available to other visitors. Use 403 or 444 when you are refusing access based on the requester rather than the state of the resource. 

    Logging Blocked Requests for Audit

    You shouldn’t blindly block traffic without keeping a record of what your server is doing. You can instruct NGINX to log blocked bot attempts to a separate file so they don’t clutter your main website analytics.

    By adding a simple directive like access_log /var/log/nginx/blocked_ai_bots.log; inside the block that returns your 403 or 444 code, you create an isolated, easily readable audit trail where you can safely monitor which AI companies are trying to harvest your data.

    Suggested read: How to Block IP Address Using WordPress .htaccess File to Stop Bad Visitors

    Layer 3 – Block AI Bots at the Edge with Cloudflare WAF

    If you manage your DNS through Cloudflare, you can easily intercept AI bots at the network edge before they ever reach your web server by configuring their built-in bot policies. Cloudflare has updated its approach to AI traffic by introducing new features that categorize bots into three distinct behaviors:

    • “Search” (crawlers indexing content to answer queries later and drive referrals)
    • “Agent” (real-time automated bots acting on a human’s behalf, like chat fetch bots) 
    • “Training” (scrapers permanently absorbing your data to train large language models).

    Configure AI Bot Policies

    Cloudflare provides two related ways to manage AI traffic:

    In AI Crawl Control, open the Crawlers tab to review individual crawlers and set each one to Allow or Block.

    For broader behavior-based controls, open the Security settings and configure how Cloudflare handles Search, Agent, and Training traffic. Each category can be allowed, blocked across the domain, or blocked only on pages where Cloudflare detects advertising.

    For each type of bot, you can choose to “Block (on all pages),” “Allow (do not block),” or select “Block on pages with ads,” which uses Cloudflare’s automated detection to block bots strictly on monetized pages while leaving the rest of your site accessible.

    Additionally, from September 15, 2026, Cloudflare will automatically block ‘Training’ and ‘Agent’ bots on pages with ads for all new domains, while keeping Search bots allowed. Cloudflare’s updated system will apply the most restrictive rule to multi-purpose crawlers, such as Googlebot or Applebot, that crawl for both search indexing and AI training.

    From 15 September 2026, Cloudflare plans to evaluate multi-purpose crawlers against all their declared behaviors. A crawler that combines Search and Training may therefore be affected by your Training rule even when Search traffic is allowed.

    Review Cloudflare’s displayed outcome before applying category-wide rules, particularly where a crawler also supports conventional search discovery.

    cloudflare AI crawlers block

    Before enforcing broad blocks across your entire domain, you can also establish governance rules using Cloudflare’s AI Audit tools. The AI Audit dashboard provides visibility into which AI services are scanning your website, allowing you to clearly see the volume of requests from specific bots and understand how they interact with your content.

    By analyzing this traffic, novice users can make data-driven security decisions, such as explicitly allowing search-focused tools that drive referral traffic, while firmly rejecting exploitative scrapers.

    AI traffic in cloudflare

    Future of AI Content Monetization

    Cloudflare is also testing Pay Per Crawl, which is currently in closed beta. Participating site owners can set a price and choose whether to allow, block, or charge supported crawlers.

    A crawler that doesn’t provide the required payment information receives an HTTP 402 Payment Required response. Availability and crawler participation remain limited, so this shouldn’t yet be treated as a general replacement for blocking.

    Suggested read: What is Fail2Ban with Setup & Configuration? (Detailed Guide)

    Verify that NGINX Blocking is Working

    After deploying your NGINX mapping rules, you shouldn’t simply assume they are functioning perfectly. Server-level configurations are powerful but unforgiving; a minor syntax error could potentially block legitimate traffic or fail to stop the unwanted bots you are targeting.

    You need to validate your setup to ensure your defenses are correct and not causing collateral damage to your site’s availability. Follow the steps below to verify that your block list is successfully intercepting requests.

    Curl with a faked GPTBot User-Agent and expect 403

    The easiest way for a novice to test if their server block is working is to pretend to be an AI bot using the command line. Open your computer’s terminal (or Command Prompt) and type the following command exactly:

    curl -I -A "GPTBot/1.0" https://example.com

    This command sends a fake request to your site claiming to be GPTBot; if your NGINX rules are working correctly, your terminal will print out an HTTP/2 403 Forbidden error (or return an empty reply if you used the 444 code), proving the block is active.

    Tail NGINX access logs and grep for the bot user-agents

    To watch your server actively defend itself in real-time, you can filter your live server logs for specific bot names. Log in to your server via SSH and run the command:

    tail -f /var/log/nginx/access.log | grep -i "gptbot"

    The tail -f command streams the log file live, while grep filters out everything except requests containing the word “gptbot”, allowing you to sit back and watch the exact moment the AI crawler hits your server and gets rejected.

    Cross-check with Cloudflare bot analytics

    Finally, you can verify your edge-level blocks by reviewing your visual data within the Cloudflare dashboard. Navigate to Security and then click on Events to see a complete log of all web traffic that triggered your WAF rules.

    By filtering this list by “User Agent” or specifically looking at the “Block AI bots” rule metrics, you can visually confirm how many thousands of requests from scrapers like ClaudeBot and Bytespider were successfully dropped by Cloudflare’s network before they ever touched your origin server.

    Final Thoughts: Take Control of Your Server Traffic

    In this article, we have discussed how to manage custom NGINX configurations and protect your websites. It might sound overwhelming, but RunCloud makes the entire process effortless.

    With RunCloud, you can easily manage and deploy sites on your own cloud infrastructure without needing to be a command-line expert. Its highly intuitive dashboard allows you to make quick NGINX updates and instantly reload your server to deploy those security rules across all your hosted applications in just a few clicks.

    Whether you’re hosting a single high-traffic web application or managing dozens of client sites, having complete, frictionless control over your hosting environment is important. 

    Start using RunCloud today.

    Should You Block AI Crawlers? Common Questions Answered

    Will blocking GPTBot or ClaudeBot affect my Google search rankings?

    No, blocking AI crawlers like GPTBot or ClaudeBot won’t negatively impact your Google search rankings. These bots are completely separate from Googlebot, which is the scraper responsible for indexing your site for search engine results. Blocking AI scrapers only prevents your content from being scraped to train their large language models.

    What is the difference between ClaudeBot, Claude-SearchBot, and Claude-User? 

    ClaudeBot crawls web content for Anthropic’s model development. Claude-SearchBot supports Claude’s search results, while Claude-User may retrieve a page in response to an individual user’s request.
    You may choose to block ClaudeBot while allowing Claude-SearchBot and Claude-User if you want to limit training access without removing your content from Claude’s search and user-directed retrieval features.

    Can AI crawlers bypass robots.txt and NGINX blocks?

    Reputable AI crawlers will respect robots.txt directives, but rogue scrapers or malicious bots can easily ignore them. NGINX blocks are significantly more powerful because they intercept and drop the connection at the server level based on the User-Agent or IP address before the site even loads. Custom NGINX rules provide stronger enforcement than robots.txt because they can reject matching requests before they reach the application. User-Agent matching is not foolproof, since another client can spoof a crawler’s name.
    For stronger protection, combine NGINX rules with rate limiting, request logs, verified crawler IP ranges where available, and edge-level bot controls such as Cloudflare.

    Should I block ChatGPT-User and Perplexity-User the same way as I do for GPTBot?

    It depends on your goals, as GPTBot crawls your site globally for AI training, whereas ChatGPT-User and Perplexity-User act as real-time search agents triggered by active user prompts. Blocking these “User” bots will prevent those AI tools from summarizing or linking to your live pages in their chat interfaces. If you want your site to be cited as a live source in AI-generated answers, you should leave user bots alone and block only training bots.

    Does blocking Google-Extended affect Googlebot or Google Ads?

    No, blocking Google-Extended only prevents your site’s content from being used to train Google’s generative AI models, such as Gemini. It operates entirely independently from traditional search indexing and advertising systems. Disallowing Google-Extended doesn’t affect your inclusion or ranking in Google Search. It is separate from the Googlebot controls used for conventional Search crawling.
    Avoid blocking broader Google user agents or IP ranges at the server or firewall level, since an overly broad rule could interfere with Google services that rely on those crawlers.

  • Perfmatters Review and Setup Guide: Features, Pricing, Pros and Cons

    Perfmatters Review and Setup Guide: Features, Pricing, Pros and Cons

    If your WordPress site is struggling to pass Core Web Vitals, despite using a premium caching plugin, you aren’t alone. WordPress themes and page builders are getting more complex, and standard caching isn’t always enough to eliminate main-thread blocking JavaScript or prevent Cumulative Layout Shift (CLS).

    That is where Perfmatters steps in.

    Perfmatters isn’t a replacement for your caching plugin – it’s the final tuning layer, focusing on bloat removal and script management. 

    In this article, we’ll review the Perfmatters plugin, explain its features, pricing, and exactly how to use it effectively.

    By the end of this article, you’ll be able to make your WordPress site faster, more responsive, and more user-friendly with the Perfmatters plugin.

    The TL;DR Verdict: Is Perfmatters Worth It?

    Yes. If your site has sluggish Interaction to Next Paint (INP) scores or frustratingly slow Largest Contentful Paint (LCP) times, then using Perfmatters is one of the most effective ways to speed up your website.

    Who it’s for:

    • Site owners who are trying to meet Core Web Vitals requirements.
    • Users with “heavy” page builders (Elementor, Divi) who need to trim unused scripts.
    • WooCommerce store owners who need granular control over where checkout scripts load.
    • Power users looking to pair a script manager with their existing caching stack (such as WP Rocket or RunCloud’s server-level caching).

    Who should skip it:

    • Complete beginners looking for a hands-off, “set-it-and-forget-it” optimization plugin.
    • Users who only want image compression (Perfmatters does not compress images or convert to WebP).

    What is Perfmatters?

    Perfmatters is a lightweight, premium WordPress performance plugin. Unlike traditional all-in-one performance plugins that focus heavily on page caching and CDN integration, Perfmatters specializes in asset management and bloat removal.

    Its philosophy is simple: WordPress and its plugins load a massive amount of code on every single page, even when that code isn’t being used. Perfmatters allows you to selectively disable CSS and JavaScript where they aren’t needed, reducing the overall page size, lowering HTTP requests, and giving the browser less work to do.

    Because it doesn’t handle page caching, it’s designed to work alongside plugins such as WP Rocket or server-side solutions like RunCache.

    How Perfmatters Improves Core Web Vitals

    Let’s take a quick look at some of the core features of Perfmatters and how it improves Core Web Vitals. 

    1. The Script Manager

    The Script Manager is the primary reason most developers buy Perfmatters. It allows you to view every CSS and JavaScript file loading on a specific page and toggle them off with a single click.

    By disabling an unused slider script on your homepage or stopping WooCommerce cart scripts from loading on your blog posts, you significantly reduce JavaScript execution time. This is the single most effective way to improve your Interaction to Next Paint (INP) score.

    2. General Bloat Removal 

    Out of the box, WordPress includes code for emojis, dashicons, the REST API, and XML-RPC. If you aren’t using these, they’re just dead weight.

    Perfmatters offers a dashboard with simple toggle switches to disable these unnecessary WordPress core features. This reduces overall HTTP requests and slims down the page weight.

    3. Advanced Lazy Loading

    Most modern browsers have native lazy loading, but Perfmatters takes it further by letting you lazy-load images, iframes, and videos. Most impressively, it can replace YouTube iframes with a static preview image, only loading the heavy video player when the user clicks play.

    Deferring off-screen images ensures the browser focuses its resources on the content the user sees first, drastically improving Largest Contentful Paint (LCP). This feature can be quite powerful, providing a massive performance boost for media-heavy sites.

    4. Adding Missing Image Dimensions

    If you upload an image without specifying its width and height, the browser doesn’t know how much space to reserve for it. When the image finally loads, the content below it jumps down the page.

    Perfmatters automatically adds missing width and height attributes to images. This directly prevents Cumulative Layout Shift (CLS), making your pages feel stable as they load.

    5. Local Analytics and Fonts

    Loading third-party resources (like Google Analytics or Google Fonts) requires the browser to perform DNS lookups and establish new connections, which takes time.

    Perfmatters can download Google Fonts and your Google Analytics script and host them locally on your server. This reduces DNS lookups and gives you control over browser caching for these files.

    How Much Does Perfmatters Cost?

    Perfmatters has three pricing plans based on the number of sites you want to use it on. The plans are:

    • Personal: $29.95 per year for 1 site.
    • Business: $59.95 per year for 3 sites.
    • Unlimited: $124.95 per year for unlimited sites and multisite networks.

    All plans come with 1 year of updates and support, a 30-day money-back guarantee, and a 10% renewal discount.

    Pros and Cons of Perfmatters

    ProsCons
    Lightweight Footprint: Minimal code with surgical, granular script control.No Free Version: No free tier or trial available to test before buying.
    Best-in-Class Script Manager: Unmatched control over per-page/post asset management.Not All-in-One: Requires pairing with a separate page caching solution.
    Core Web Vitals Booster: Drastic improvements to INP, LCP, and CLS when properly configured.No Image Optimization: Lacks built-in image compression or WebP conversion features.
    Highly Compatible: Works flawlessly alongside caching plugins (WP Rocket, FlyingPress, RunCloud Hub).Learning Curve: Requires technical knowledge to identify which scripts to disable safely.
    Privacy & Speed: Local hosting for Google Analytics and Google Fonts built right in.Manual Configuration: Not a “set-and-forget” plugin; requires active tweaking for top results.
    Automated Maintenance: Scheduled database cleanup keeps your site lean.

    How To Install Perfmatters Plugin

    After visiting https://perfmatters.io to purchase and download the plugin, installing it is very easy and straightforward. Here are the steps to follow:

    1. To install the Perfmatters plugin, open your WordPress dashboard and navigate to the “Plugins” tab. Click on the “Upload Plugin” button and select the ZIP archive you received after completing your purchase.
    How to install perfmatters
    1. After the Installation is complete, click on “Activate Plugin” to start using it on your site.
    1. Once you have enabled the plugin, go to plugin settings and switch to the “License” tab. Enter your License key to activate all the features of the plugin.
    Perfmatters admin dashboard
    1. Once you have entered the key, you will see a message that says “License is activated” – along with the validity of your license.

    That’s it! You have successfully installed the Perfmatters plugin on your site.

    Perfmatters Basic Configuration

    Perfmatters offers many features to help you optimize your site’s performance. However, it doesn’t enable any optimization features by default. You will have to manually toggle the switch for each feature and test your site for any issues. If you notice any problem, you can simply turn off the feature and try another one.

    If you encounter a problem immediately after enabling a feature, it means your site is using that feature, so leave it alone. Here is a list of some of the important settings that you should definitely check out:

    • Script Manager: This feature lets you control which scripts load on each page or post on your site. You can turn scripts off or on that are either not needed or cause conflicts. You can also change how the scripts load, such as in the header or footer, asynchronously or deferentially, to improve your site’s speed and compatibility.
    • Lazy Loading: This feature delays the loading of images, videos, iframes, and other elements until they are visible on the screen. This reduces the initial page load time and saves bandwidth. You can also enable DOM monitoring, which detects new elements added to the page and automatically applies lazy loading to them.
    • DNS Prefetch: This feature resolves the domain names of external resources, such as images, fonts, scripts, etc., before they are requested by the browser. This reduces latency and improves your site’s loading speed. You can also manually add custom domains to prefetch.
    • Preconnect: This is an extension of the DNS Prefetch feature. In addition to resolving domain names, it establishes early connections to external domains before the browser requests them. This reduces the round-trip time and improves your site’s loading speed. You can also manually add custom domains to preconnect.
    • Heartbeat Control: This feature controls the frequency of the WordPress heartbeat API, which sends requests to the server every few seconds. These requests can consume server resources and slow down your site. You can reduce or disable the heartbeat to save resources and improve your site’s speed. You can also choose which areas of your site to apply heartbeat control to, such as the dashboard, front end, and post editor.
    • jQuery Migrate: This feature disables jQuery Migrate, which is a script that helps older plugins and themes work with newer versions of jQuery. However, this script can slow down your site and cause errors. You can disable it if you’re sure that your site doesn’t need it.
    • Disable Emojis: This feature disables emojis, which are small icons that express emotions. However, these icons can add extra requests and slow down your site. You can disable them if you don’t use them on your site.
    • Remove the wlwmanifest Link: This feature removes the wlwmanifest link, which Windows Live Writer uses to work with WordPress. However, this link can expose your site’s information and slow it down. You can remove it if you don’t use Windows Live Writer on your site.
    • Disable Comments: This feature disables comments on your site, which can reduce spam and improve your site’s performance. You can disable comments globally or on specific post types. You can also remove comment-related scripts and styles from your site.
    • Local Google Fonts: This feature hosts Google Fonts locally on your server instead of loading them from Google’s servers. This reduces external requests and improves your site’s speed and compatibility. You can also choose how to display the fonts (swap or block) and disable Google Fonts completely if you don’t use them on your site.
    • Local Analytics: This feature hosts Google Analytics locally on your server instead of loading it from Google’s servers. This reduces external requests and improves your site’s speed and privacy. You can also choose how often to update the analytics script and exclude certain roles from tracking.

    Perfmatters vs. Alternatives: Choosing the Right Performance Stack

    Deciding between Perfmatters, WP Rocket, or FlyingPress? While all three provide WordPress performance optimization, they function differently. The following comparison shows their strengths to help you pick the right tool for your specific setup.

    Feature / CategoryPerfmattersFlyingPressWP Rocket
    Primary FocusAsset optimization and granular script management.All-in-one caching with aggressive asset optimization.Page caching with reliable, automated optimization.
    Page CachingNo (Relies on your server or another caching plugin).Yes (Generates static HTML pages).Yes (Industry standard for static HTML caching).
    Manual Script ManagerBest-in-class (Unmatched control to disable scripts per page/post).No (Automates optimization but lacks manual asset toggles).No (Relies on broad automation across the whole site).
    Unused CSS HandlingYes (Loads optimized CSS efficiently in a separate external file).Yes (Highly aggressive and effective at removing unused CSS).Yes (Automated, but loads the CSS inline, which can increase HTML size).
    JavaScript OptimizationYes (Highly customizable manual control over delaying/deferring).Yes (Aggressive automated delay based on user interaction).Yes (Basic, reliable automated delay and deferral).
    Image OptimizationBasic (Handles lazy loading and preloading, but no compression).Comprehensive (Lazy loading, plus AVIF/WebP generation via add-on).Basic (Handles lazy loading, but requires a separate plugin for compression).
    Ease of UseSteep Learning Curve (Requires technical tweaking and testing to avoid breaking the site).Moderate (Requires some careful configuration for its most aggressive settings).Very Easy (“Set-and-forget” with safe, automated defaults).
    The Best Use CaseThe ultimate “scalpel” to pair with a dedicated caching plugin or server cache.A powerful standalone solution for users who want maximum automated speed.A rock-solid standalone solution for users who prioritize stability and ease of use.
    Ideal SynergyPairs perfectly with WP Rocket or RunCloud server caching.Use alone, or pair with Perfmatters to manually kill stubborn scripts.Use for caching, and pair with Perfmatters for advanced script control.

    Final Thoughts

    Perfmatters is a powerful and versatile plugin that helps you optimize your WordPress site’s performance and speed. It has many features that let you disable unnecessary features and scripts, tweak settings and options, clean up your database, use a CDN, host analytics locally, and more.

    If you’re looking for a plugin that can make your site faster, more responsive, and more user-friendly, then Perfmatters is a great choice for you.

    If you’re tired of managing your own servers, you might want to check out RunCloud (yep, that’s us!).

    RunCloud is built for developers who want to focus on shipping great work, not on managing their infrastructure. Experience painless server configuration, with no need to spend hours figuring it out.

    Get started with RunCloud today & get up and running in minutes. 

    Frequently Asked Questions

    Is Perfmatters a caching plugin?

    No, Perfmatters is not a caching plugin. It’s a performance optimization and script management plugin. It is designed to work alongside your existing caching solution (like WP Rocket or server-level caching) to remove bloat and reduce page weight.

    Perfmatters vs WP Rocket: which is better?

    They serve different purposes. WP Rocket is an all-in-one caching plugin, while Perfmatters specializes in asset management and removing unused code. For the best results, they should be used together.

    Does Perfmatters work with WooCommerce?

    Yes, Perfmatters is highly recommended for WooCommerce. WooCommerce loads cart and checkout scripts on every page by default. Perfmatters allows you to disable these scripts on your blog posts and homepage, significantly speeding up your site.

    Is Perfmatters worth it?

    Yes. If you’re struggling with Core Web Vitals, specifically INP or LCP, Perfmatters offers the granular control needed to fix those issues. For $29.95/year, it provides incredible value.

    What is the Perfmatters Script Manager?

    The Script Manager is a tool within Perfmatters that shows you every CSS and JavaScript file loading on a specific page. It allows you to toggle those files off individually, preventing unused code from slowing down your site.

    Does Perfmatters have a free version?

    No, Perfmatters does not have a free version or a trial. It is a premium-only plugin, but it does offer a 30-day money-back guarantee.

  • How to Disable WP-Cron (wp-cron.php) on WordPress

    How to Disable WP-Cron (wp-cron.php) on WordPress

    Are your scheduled posts failing to publish, or is your website feeling slow? If you answered yes, then you might be falling victim to the hidden inefficiency of WordPress’s default background task system. 

    WP-Cron is a “virtual” crontab that triggers only when someone visits your site, but this traffic-dependent virtual cron job often leads to slow page loads, database bloat, and missed automated tasks.

    In this guide, we will walk you through WP-cron’s drawbacks and show you how to replace WP-cron with a high-performance manual cron job. 

    What is WP-Cron in WordPress?

    WP-Cron is a virtual cron job system built into WordPress that triggers time-based background tasks. This is different from a real cron (or system cron), which automatically triggers on a scheduled interval. The WordPress cron functionality only executes when a user visits your website. 

    Limitations and Common Issues with WP-Cron

    Although the built-in WordPress cron functionality is convenient for small sites, it has several major flaws:

    • Traffic Dependency: If no one visits your site, your scheduled tasks (such as publishing a post) will not run.
    • Performance Degradation: Every page load triggers a task check, adding latency and consuming server CPU.
    • Resource Spikes: During high traffic, hundreds of users may trigger the wp-cron.php file simultaneously, leading to server timeouts.
    • Reliability: Background tasks like email notifications or theme updates may hang if the PHP process times out during a heavy page request.

    For these reasons, most WordPress users disable the built-in WordPress cron jobs and replace them with a system cron job.

    Suggested Read: What Is WP Cron & Setting Up Server-Side Cron Jobs

    When Should You Consider Disabling WP-Cron?

    ScenarioWhy you should disable WP-Cron
    High TrafficPrevents multiple users from triggering overlapping cron processes.
    Scheduled TasksEnsures mission-critical tasks (backups, newsletters) run exactly on time.
    Slow Site SpeedReduces server load by removing the check-on-load requirement.
    E-commerce StoresEnsures WooCommerce inventory and order emails process reliably.

    Suggested Read: How to Create and Manage Cron Jobs on Linux

    How to Disable WP-Cron (wp-cron.php) in WordPress

    Note: If you’re using RunCloud, you can skip this step. Jump to the section below (“Method 1: Use RunCloud Server Cron Functionality”) to see how to do it with a single click.

    To stop the default behavior, you must set the DISABLE_WP_CRON constant in your WordPress configuration.

    1. Log in to your hosting provider’s dashboard and open the File Manager.
    2. Locate the wp-config.php file, right-click it, and select the Code Editor.
    3. Find the line that says /* That’s all, stop editing! Happy publishing. */.
    4. Paste the following code directly above that line: 
    define( 'DISABLE_WP_CRON', true );
    1. Save your changes and close the editor.
    disable wp-cron in wordpress

    Suggested Read: 10 Best WordPress Management Tools To Easily Manage Multiple Websites

    How to Set Up a Real Cron Job for WordPress

    Once the internal cron functionality is disabled, you must replace it with a real cron job to make sure your site functions correctly.

    Method 1: Use RunCloud Server Cron Functionality (Recommended)

    The RunCloud dashboard provides a professional, “one-click” way to handle this without ever touching a command line or configuration file.

    1. Log in to your RunCloud dashboard and select your Web Application.
    2. Navigate to the General Settings tab in the sidebar menu.
    3. Locate the WordPress Config section on the page.
    4. Toggle the “Server Cron” switch to On.

    That’s it! RunCloud automatically disables the virtual cron job and configures a system-level cron task for you.

    enable WordPress cron in WordPress

    Suggested Read: How To Install WordPress With RunCloud | Step-By-Step Guide

    Method 2: Using the RunCloud Cron Manager

    While the standard RunCloud WordPress Cron functionality is sufficient for many websites, you’re not strictly bound to it. If you have unique requirements, such as a plugin that requires specific timing or a multisite environment where standard cron runs might conflict, you can create custom jobs.

    Setting up these custom jobs gives you granular control over when and how background tasks are processed. By bypassing the default system, you can define precise schedules that align with your site’s architecture, ensuring that even complex workflows run seamlessly. 

    1. In your RunCloud dashboard, go to the Cron Job tab for your server.
    2. Click the “Add New Job” button.
    3. On the next screen, you can specify the basic details for your cron job, such as:
      • Job Label: Give your task a descriptive name (e.g., “WordPress Newsletter Cron”) to help you easily identify it later in your dashboard.
      • User: Select the custom user who owns the web application. Using a specific system user (rather than root) is a security best practice that helps prevent permission issues.
      • Vendor Binary: Choose your execution environment. While /bin/bash is standard for general shell commands, you can also select php if you are running a direct script.
      • Command: Enter wp cron event run --path="/home/your-site/public_html" --due-now to trigger only scheduled tasks. Make sure to replace the example path in the previous command with the actual root path of your WordPress application.
      • Run In: You can choose a preset (e.g., “Every 15 minutes”) or select “Custom” to define your own timing (e.g., using a CRON expression like 0 2 * * * to run a task daily at 2:00 AM).
    4. Check the “Content of your cron job” field at the bottom; RunCloud will live-preview the final command syntax so you can verify it is correct before clicking “Save.”
    Create cron jon in WordPress

    Note: Make sure that the User selected for the cron job matches the owner of the files in your public_html directory; this prevents “Permission Denied” errors when the job attempts to write to logs or update databases.

    Suggested Read: How to Use FTP to Upload Files to WordPress Without a Password [Step By Step]

    Method 3: Using SSH

    If you’re not using RunCloud yet, then another alternative is to connect to your server via SSH to configure or manage these cron jobs manually. Follow these steps below:

    1. Connect to your server using SSH with your username or root credentials.
    2. Enter the command crontab -e to open your system’s crontab editor.
    3. Add a new line at the bottom of the file using the following format: 
    */15 * * * * wp cron event run --path="/home/your-site/public_html" --due-now
    1. Save and exit the editor (press Ctrl+X, then Y, then Enter).
    Edit Crontab in Linux

    After saving the file, you can verify that the task was created successfully by running crontab -l to confirm your manual cron job is active and ready.

    Suggested Read: The Best 5 WordPress Vulnerability Scanners in 2025 (Compared)

    Wrapping Up: Who Should Disable WP-Cron in WordPress?

    In this guide, we have covered several methods to optimize your WordPress background tasks, ranging from manual configuration in your File Manager to advanced SSH command-line editing. While these approaches work, they come with risks, such as syntax errors in your wp-config.php or improper file permissions that can break your site’s automation.

    If you’re looking for the most reliable, efficient, and user-friendly experience, the RunCloud Cron Manager is the superior choice. It eliminates manual configuration errors and lets you manage your scheduled tasks, custom PHP scripts, and system-level commands from a single intuitive interface.

    In addition to Cron management, RunCloud offers many useful features, including one-click SSL deployment, automated server security, easy staging environment creation, and real-time server monitoring. RunCloud is designed to save you hours of development time. 

    Explore RunCloud and see how it can help you manage WordPress sites and servers with fewer manual steps.

    Start your free 7-day trial today. 

    FAQs on Disabling WP-Cron in WordPress

    Is it safe to disable WP-Cron?

    Yes, it’s perfectly safe and actually recommended to disable the default wp-cron.php trigger for most WordPress sites. By default, WordPress checks for scheduled tasks every time a visitor loads a page, which can be inefficient. Replacing this with a system-level cron job ensures your tasks run reliably without relying on incoming web traffic.

    What are the risks of disabling WP-Cron?

    The only primary risk is forgetting to set up a replacement server-side cron job after disabling the default one. If you disable the built-in system without creating a backup task, your scheduled events will never trigger. Fortunately, RunCloud makes this transition easier by providing a one-click WP-Cron fix that handles the configuration for you.

    Do I need to set up a real cron job after disabling WP-Cron?

    Yes, if you disable the default wp-cron.php trigger, you must configure a real server cron job to maintain site functionality. Without this replacement, automated tasks such as publishing posts or sending emails will stop. 

    Will disabling WP-Cron affect scheduled posts or emails?

    Disabling the default system will only affect scheduled posts or emails if you fail to replace it with a server-level cron job. Once you move to a system cron, your scheduled posts and emails will actually become more punctual and reliable. They will no longer depend on a random visitor loading your site to trigger the execution process.

    How often should I run the real cron job?

    For most standard websites, running the system cron job once every 5 to 15 minutes is the industry standard. This frequency is enough to keep your site updated without putting unnecessary strain on your server’s resources. If you have a high-traffic site or time-sensitive tasks, you can adjust this interval within your RunCloud dashboard to meet your specific needs.

    What happens if I don’t replace WP-Cron with a server cron job?

    If you disable the default trigger without setting up a replacement, your WordPress site will essentially “go to sleep” regarding automated background tasks. You will notice that scheduled posts remain stuck in “draft” status, and automated emails, such as password reset emails or form notifications, will stop being sent. Your site will remain functional for visitors, but all background administrative automation will stop working.

    Can I re-enable WP-Cron later?

    Yes, you can easily re-enable the default behavior at any time if you change your hosting environment or troubleshooting requirements. Simply revert the DISABLE_WP_CRON constant in your wp-config.php file to false or remove the line entirely. If you used the RunCloud one-click fix, you can manage these settings through the RunCloud interface just as easily as you enabled them.

    Does disabling WP-Cron improve site performance?

    Yes, disabling the default wp-cron.php can significantly improve performance, especially for sites with lower traffic. By preventing WordPress from checking for tasks on every page load, you reduce the CPU load and server response time for your visitors. This small tweak is an effective way to streamline your resource usage and improve the overall “snappiness” of your site.

    Is disabling WP-Cron recommended for high-traffic sites?

    Absolutely, disabling the default WP-Cron is a best practice for high-traffic environments to prevent resource exhaustion. On busy sites, hundreds of concurrent users could trigger the cron process simultaneously, leading to database locking and server instability. Offloading these tasks to a server cron ensures that scheduled jobs execute once, predictably, and independently of user traffic.

    What’s the difference between WP-Cron and a real cron job?

    WP-Cron is a “virtual” cron system that triggers only when a user visits your website, making it highly dependent on incoming traffic. A real system cron job is a true server-side task that runs at precise, pre-defined intervals regardless of whether anyone is browsing your site. By using RunCloud’s one-click WP-Cron fix, you shift your site from an unreliable, traffic-dependent model to a professional, server-side automated schedule.

  • n8n vs Zapier vs Make: Which Automation Tool Is Right for You?

    n8n vs Zapier vs Make: Which Automation Tool Is Right for You?

    Automation platforms often look inexpensive until your workflows start running at scale.

    A process that captures a lead, checks a CRM, cleans the data, sends a notification, and updates another system may consume several billable tasks or credits every time it runs. Multiply that by thousands of executions, and a modest monthly subscription can quickly become a major operating cost.

    That makes the choice between n8n vs. Zapier and n8n vs. Make more than a question of which workflow builder has the easiest interface. You also need to compare how each platform charges for usage, how much control it gives your developers, and where your business data is processed.

    This guide breaks down n8n pricing alongside the task-based pricing used by Zapier and the credit-based model used by Make. It also examines n8n self-hosted pricing, including the server, storage, maintenance, and management costs that are often missed when calculating the full n8n self-hosting cost.

    You will learn:

    • How n8n, Zapier, and Make calculate workflow usage
    • What each platform may cost as your automation volume grows
    • When self-hosted automation offers better control and more predictable costs
    • What running n8n on your own server requires
    • How RunCloud can reduce the server administration involved in hosting n8n

    By the end, you should have a clearer view of whether Zapier, Make, n8n Cloud, or a self-hosted n8n deployment is the right fit for your workload, technical resources, and budget.

    Comparing n8n vs. Zapier vs. Make

    Choosing between n8n, Zapier, and Make requires analyzing three things: long-term pricing structures, processing flexibility, and data security. In this section, we will compare how these three platforms handle real-world operational demands.

    Comparing Costs at Scale

    Each platform uses a completely different mechanism to calculate your monthly usage invoice.

    • Zapier bills by Tasks (every successful action step in a workflow consumes a task).
    • Make bills by Credits (every module action, such as fetching data, routing, or updating a record, consumes one credit). For Make’s “Make Code App”, there is a resource cost of 2 credits per second of code execution.
    • n8n bills by Executions (one complete workflow run from trigger to final step equals one execution, regardless of complexity).

    To illustrate how these billing philosophies affect your budget, consider a common business scenario: processing 10,000 leads per month using a standard 7-step automation process.

    The Scenario: 7-Step Lead Enrichment Workflow

    1. Trigger: Webhook captures a new lead.
    2. Action 1: Searches a CRM database to check for an existing record.
    3. Action 2: Filters and routes the lead based on geographic location.
    4. Action 3: Formats and cleans the name and email address.
    5. Action 4: Updates the CRM contact record.
    6. Action 5: Sends an internal Slack notification to the sales team.
    7. Action 6: Sends an automated introductory email to the prospect.

    The Monthly Cost Breakdown

    • Zapier: Because Webhook triggers don’t consume tasks, the remaining 6 actions count as tasks. Running this 10,000 times a month consumes 60,000 tasks. To accommodate this volume on Zapier’s Professional plan, you must scale your task tier, which will result in an estimated subscription cost of $300-$400 per month.
    • Make: Most actions consume 1 credit, while some advanced features use more credits. Running this 10,000 times will consume at least 70,000 credits, but it can vary widely and could easily reach 200,000. This could cost you $110 to $315 per month.
    • n8n Cloud: Because n8n bills purely per workflow execution, running this 7-step pipeline 10,000 times consumes exactly 10,000 executions. This is included in the n8n Pro plan, which costs 50€ per month (billed annually).
    • n8n Self-Hosted: Running this workflow incurs no software licensing fees and only the cost of your underlying server infrastructure (typically $10-$20 per month for a standard cloud VPS).

    Note: Pricing checked in June 2026. Actual costs depend on the selected plan, billing cycle, workflow configuration, feature usage, overage charges, and applicable taxes. Check each provider’s current pricing before making a purchasing decision.

    n8n vs zapier comparison

    Comparing Flexibility & Custom Code

    When workflows require custom business logic, the platforms differ in how they handle developer integrations.

    • n8n: Was built with a developer-first mindset. n8n natively integrates JavaScript and Python code blocks across all deployment tiers. These code blocks run directly within the execution path, allowing complex array transformations, data parsing, and custom cryptography without incurring additional billing penalties.
    • Zapier: Scripting is limited to basic “Code by Zapier” blocks. These steps are subject to strict run-time limits and memory allocations, and they consume standard task quotas, making heavy data manipulation costly.
    • Make: Make’s greatest strength is its highly visual drag-and-drop routing and filtering interface, which allows non-technical users to easily build logical branches. For advanced logic, Make provides a “Make Code App” functionality; however, this incurs a 2-credit cost per 1 second of code execution, so complex scripts can rapidly drain your monthly credit pool.

    Comparing Data Sovereignty & Security

    If your organization operates in highly regulated fields such as healthcare (HIPAA), finance (PCI-DSS), or legal services, where customer data is highly sensitive, how data is handled is just as important as the cost.

    • Zapier and Make: Both are primarily managed cloud platforms. Workflow data is processed through infrastructure controlled by the provider, although the available security, data residency, and enterprise controls vary by platform and plan. Organizations handling regulated or sensitive data should assess those controls against their own legal, contractual, and compliance requirements.
    • n8n Self-Hosted: With n8n Community Edition, you can run the platform on infrastructure you control. This gives you greater control over workflow data, credentials, execution logs, storage locations, and retention policies. You remain responsible for securing the server and configuring the deployment to meet your compliance requirements.

    The True Cost of Self-Hosting n8n

    The appeal of self-hosted automation is undeniable, particularly given n8n’s self-hosted pricing. By choosing to host n8n on your own infrastructure, you can bypass the execution limits associated with SaaS cloud plans and maintain complete control over your data.

    However, understanding the total n8n pricing self-hosting cost is essential, as running your own automation stack is rarely a “zero-cost” endeavor. While the n8n Community Edition has no software license fee, your overall n8n pricing will still need to account for hardware, database management, and maintenance.

    Infrastructure and Server Costs

    To run n8n reliably in production, you need to provision a VPS from a cloud infrastructure provider. While n8n can technically run on very minimal resources, a production environment, especially one running a separate PostgreSQL database for execution logs, requires adequate RAM and CPU to prevent bottlenecks during concurrent executions.

    Here is a breakdown of typical VPS options suitable for hosting n8n in 2026:

    ProviderEntry-Level Tier (Light Testing)Production-Ready Tier (Recommended)Estimated Monthly Cost
    Hetzner Cloud1 vCPU, 2 GB RAM, 20 GB SSD2 vCPUs, 4 GB RAM, 40 GB SSD€4.00 – €8.00 / month
    DigitalOcean1 vCPU, 1 GB RAM, 25 GB SSD2 vCPUs, 2 GB RAM, 50 GB SSD$6.00 – $12.00 / month
    Vultr1 vCPU, 1 GB RAM, 25 GB SSD2 vCPUs, 2 GB RAM, 55 GB SSD$5.00 – $12.00 / month
    AWS Lightsail1 vCPU, 1 GB RAM, 40 GB SSD2 vCPUs, 2 GB RAM, 60 GB SSD$7.00 – $15.00 / month

    When calculating your hardware budget, keep in mind that n8n stores execution data by default. Every step of every workflow run writes data to your database. If you process thousands of executions daily, a standard 25 GB SSD can fill up within weeks, potentially freezing the server.

    To maintain system stability, self-hosted administrators must budget for either:

    • Sufficient SSD block storage (an extra $5 to $10/month).
    • Correctly configured execution pruning rules (e.g., setting n8n environment variables to delete execution data older than 7 days).

    In addition to the above costs, you should also budget for hardware and storage to back up your data to a separate location or a storage device.

    RunCloud server creation

    Additional Operational Overhead for Hosting n8n

    When evaluating your overall n8n pricing self-hosting cost, the time spent on server administration is often the most significant expense to include in your n8n pricing calculations. 

    1. Server Provisioning and Security Setup

    Setting up a VPS is only the first step. To make n8n usable, you must secure the server. This might require configuring a firewall (such as UFW), setting up a reverse proxy (such as NGINX, Traefik, or Caddy) to direct traffic, and closing unnecessary open ports to prevent unauthorized access to your workflow canvas.

    2. Configuring SSL Certificates

    To trigger webhooks and connect securely to external APIs, your n8n instance must run over HTTPS. This requires installing SSL certificates. While Let’s Encrypt certificates are free, configuring them to renew automatically without disrupting your reverse proxy configuration requires ongoing maintenance.

    3. Managing Updates and Preventing Downtime

    n8n is being actively developed, which is both a blessing and a curse. You will get access to new features, but you will also need to upgrade frequently to receive the latest security patches, bug fixes, and new integration nodes.

    If an update fails due to a database conflict or an incompatible custom code block, your entire automation pipeline goes offline. Without deep Linux command-line expertise, troubleshooting these failures and restoring backups can result in hours of costly business downtime.

    Managing Self-Hosted n8n Without the System Admin Headache

    For many organizations, the long-term financial math of self-hosted automation is highly compelling. However, the primary barrier to entry is what is often called the “sysadmin tax.” If your team lacks dedicated DevOps resources or deep Linux command-line expertise, the prospect of managing SSH keys, writing reverse proxy rules, and manually maintaining database performance can feel like a steep price to pay.

    Fortunately, there is a balanced approach that separates raw cloud infrastructure from complex server administration. By pairing a standard, cost-effective cloud server (such as Vultr, DigitalOcean, AWS, or Linode) with a centralized server management panel like RunCloud, you can establish a self-hosting environment without the technical friction of manual server setup.

    How RunCloud Simplifies Self-Hosted Server Management

    Rather than forcing you to interact with a terminal or build complex server stacks from scratch, RunCloud provides a visual control panel for your cloud servers. This helps manage the operational realities of running self-hosted applications:

    • Less Routine Command-Line Management: RunCloud provides a visual dashboard for many recurring server management tasks, including monitoring, database administration, SSL management, backups, and application configuration. Deploying and troubleshooting a self-hosted n8n instance may still require familiarity with Docker, NGINX, configuration files, or the command line. 
    • Automated SSL and Core Security: Secure communication is mandatory for any automation workflow that relies on external webhooks. RunCloud automates the deployment and renewal of Let’s Encrypt SSL certificates with a single click. It also handles server-level firewall configuration and automatically applies security patches, keeping your environment protected against vulnerabilities.
    • Centralized Multi-Server Control: If your team uses other self-hosted utilities alongside n8n, such as an independent PostgreSQL database server, a staging instance, or auxiliary microservices, you can manage and monitor them all from a single dashboard. This consolidated view gives you full visibility into your server’s resource usage (CPU, RAM, and disk storage) so you can scale your hardware as your workload grows.
    RunCloud monitoring panel

    This hybrid approach gives you the ultimate benefit of self-hosting: you can avoid cloud plan execution allowances and scale the deployment by adding appropriate server, database, and worker capacity. Your practical limits depend on the infrastructure, workflow design, external services, and n8n edition you use. 

    Final Thoughts

    Selecting the right platform for your workload is more than just picking the cheapest option. You also need to factor in your team’s technical, application, and data security capabilities, as well as your data security requirements. 

    Use the following framework to determine which option fits your business needs.

    When to Choose Zapier

    Best for: Teams with limited developer resources that require specialized, niche integrations and have the budget to support usage fees for scaling.

    • No Developer Overhead: You can build and deploy workflows without understanding APIs, JSON, or code.
    • Massive Integration Library: Access to over 9,000 apps means even highly obscure third-party tools are likely supported natively.
    • The Trade-off: As your workflow volume grows, the “per-task” billing model can quickly lead to high monthly expenses.

    When to Choose Make

    Best for: visual builders who need advanced multi-branch logic and medium-scale automation without managing any software infrastructure.

    • Visual Logic Mapping: The circular “bubble” interface makes it easy to visualize complex, multi-route databases and workflows.
    • Cost-Efficient SaaS: It is generally more affordable than Zapier for moderate volumes, though it is still subject to monthly “operation” quotas.
    • The Trade-off: Like Zapier, you are entirely dependent on their cloud infrastructure, and you cannot keep sensitive operational data entirely inside your own network.

    When to Choose n8n

    Best for: Technical teams, SaaS startups, agencies processing high volumes of data, and privacy-conscious enterprises.

    • Execution-Based & Self-Hosted Pricing: Paying per complete execution (on n8n Cloud) or self-hosting for $0 in licensing fees makes it the most scalable financial choice.
    • Developer-First Flexibility: Native JavaScript/Python nodes, AI agent features, and custom HTTP request capabilities give developers granular control over data.
    • Data Sovereignty: Running n8n on your own servers ensures sensitive customer data never leaves your infrastructure.

    Run n8n on Your Own Server Without Managing Everything Manually 

    Zapier and Make may suit teams that want a fully hosted platform and do not expect workflow costs to rise sharply with usage.

    For technical teams running larger workloads, self-hosting n8n can provide more control over data, infrastructure, and long-term costs. The trade-off is that someone still needs to configure, secure, monitor, and maintain the server.

    RunCloud helps remove much of that server management work.

    You can connect a cloud server from providers such as DigitalOcean, Vultr, AWS, or Linode, then manage key server tasks through the RunCloud dashboard. This includes SSL certificates, firewall settings, backups, server monitoring, database management, and security updates.

    You retain the cost and control benefits of self-hosted automation without having to manage every part of the server through the command line.

    Start managing your self-hosted n8n server with RunCloud.

    Frequently Asked Questions

    Is n8n really free to self-host?

    Yes. The standard self-hosted version of n8n is source-available under a “fair-code” license (the n8n Community Edition) and can be downloaded from GitHub at no cost. The Community Edition does not charge per workflow execution. The number of workflows and executions your instance can handle depends on its infrastructure, configuration, workload, and external service limits. While the software license is free, you will still need to pay for the underlying virtual private server (VPS) on which the software runs.

    What is the true n8n pricing for self-hosting?

    For a reliable production environment, your self-hosting cost generally consists of two parts:
    The Cloud VPS: A virtual server from providers like Vultr, DigitalOcean, or Hetzner typically costs $5 to $20 per month, depending on your memory and CPU requirements.
    The Server Management Panel: Using a management platform like RunCloud to handle your server administration costs a predictable flat monthly fee.
    Even when combining these two costs, the total monthly expense is usually a fraction of the price of mid-tier SaaS plans from Zapier or Make, especially if you are processing tens of thousands of executions.

    How do I secure my self-hosted n8n instance and configure SSL?

    Since n8n relies on webhooks to trigger workflows, your instance must run over a secure HTTPS connection. With RunCloud, security configuration is automated, and you can deploy and renew free Let’s Encrypt SSL certificates with a single click inside the dashboard.

    When does it make sense to transition from n8n Cloud to a self-hosted instance?

    If your workflow volume is low (under 2,500 executions per month), n8n’s Cloud Starter plan (20€/month) is highly convenient. However, if your business operations scale to tens of thousands of monthly executions, or if you need to run resource-heavy custom Python/JavaScript scripts, transitioning to a self-hosted server managed by RunCloud allows you to scale your execution volume without hitting subscription caps or facing unexpected price jumps.