Category: Linux

  • How to Set Up Cloudflare Tunnel to Access Your Server Without Opening Ports (2026 Guide)

    How to Set Up Cloudflare Tunnel to Access Your Server Without Opening Ports (2026 Guide)

    Exposing public ports on your server is a bit like leaving your front door wide open. If you’re managing Linux instances or running a web server, your systems are likely being pinged thousands of times a day by automated bots and scanners.

    In the past, securing a server meant taking on the headache of complex firewall rules, juggling SSH keys, or setting up jump hosts. But there’s a better way. Cloudflare Tunnel simplifies this approach by letting you expose your web applications, SSH access, and databases to the internet or only to authorized users, without opening a single inbound port on your firewall.

    In this guide, we’ll walk through how Cloudflare Tunnel works, how it compares with traditional VPNs and proxies, and the step-by-step process for getting it running on Ubuntu or Debian.

    What is Cloudflare Tunnel?

    Before we talk about Cloudflare Tunnel, let’s first look at how we’ve traditionally handled server access. Usually, when you connect via SSH or access a web app, traffic flows from your device across the internet directly to your server’s public IP address. That requires your firewall to keep those “doors” (ports 80, 443, and 22) wide open.

    Cloudflare Tunnel flips this dynamic entirely. Instead of your server listening for incoming connections, a lightweight background process, the cloudflared daemon, reaches out to Cloudflare’s edge data centers. Because the connection is strictly outbound, your server’s firewall can safely block all incoming traffic. You don’t even need a public IP address.

    How the Daemon and Named Tunnels Work

    When you set up a “Named Tunnel,” Cloudflare assigns it a unique ID (UUID) and creates a set of cryptographic credentials. Your cloudflared daemon uses these to stay connected. When a user tries to access your domain, Cloudflare routes that request through this secure, pre-established tunnel directly to your daemon, which then proxies it locally to your app or service.

    The cloudflared daemon connects to Cloudflare using these credentials. When a user requests your domain, Cloudflare passes that request through the secure tunnel directly to cloudflared, which proxies it locally to localhost:80, localhost:22, or whichever internal port your app uses.

    CloudFlare tunnel website screenshot

    Suggested read: Enable Zero-Trust SSH with Cloudflare on Windows, Mac, Linux, and ChromeOS 

    Comparing Cloudflare Tunnel to a VPN

    You might be wondering, “Why not just use a VPN?” While they both provide access, they serve different needs:

    • Cloudflare Tunnel works at the application layer (Layer 7). It’s perfect for exposing specific services, like a website or SSH, without giving someone keys to your whole network.
    • Traditional VPNs work at the network layer (Layer 3). They directly connect your device to the remote network and grant access to every IP address and port on that subnet.

    If you need full network-level routing, a dedicated VPN, or a mesh network like Tailscale is usually the better tool. But for securing individual apps or SSH access, Cloudflare Tunnel is hard to beat.

    Cloudflare Tunnel vs. VPN vs. Reverse Proxy

    If you’re trying to figure out which tool fits your infrastructure, here’s a quick breakdown:

    FeatureCloudflare TunnelTraditional VPNReverse Proxy (NGINX/Caddy)
    Inbound Firewall PortsNone (0 ports open)Requires 1 open portRequires ports 80 & 443 open
    Public IP Required?No (works behind CGNAT)YesYes
    Traffic ScopeApplication-level (Layer 7)Network-level (Layer 3)Application-level (Layer 7)
    Access Control IntegrationBuilt-in Zero Trust / SSORequires external AAA/RADIUSRequires manual auth modules
    DDoS ProtectionIncluded via CloudflareRequires third-party mitigationExposed to direct IP attacks

    Step-by-Step Instructions for Configuring Cloudflare Tunnels

    Now that we’ve covered the fundamentals and how Cloudflare Tunnel compares to traditional networking methods, let’s dive into setting it up. In the following section, we’ll walk you through the step-by-step process of installing and configuring Cloudflare Tunnel directly on your Linux server.

    Step 1: Getting Started with cloudflared

    Cloudflare allows you to create Quick Tunnels for free without creating a Cloudflare account. This is useful for previewing and shipping ideas globally in seconds. However, in this section, we will build long-lasting, remotely managed tunnels, and the quickest way to do so is from the Cloudflare dashboard.

    Log in to your Cloudflare account and open the Tunnel management page. You can access this from Zero Trust > Networks > Tunnels & Mesh > Cloudflared.
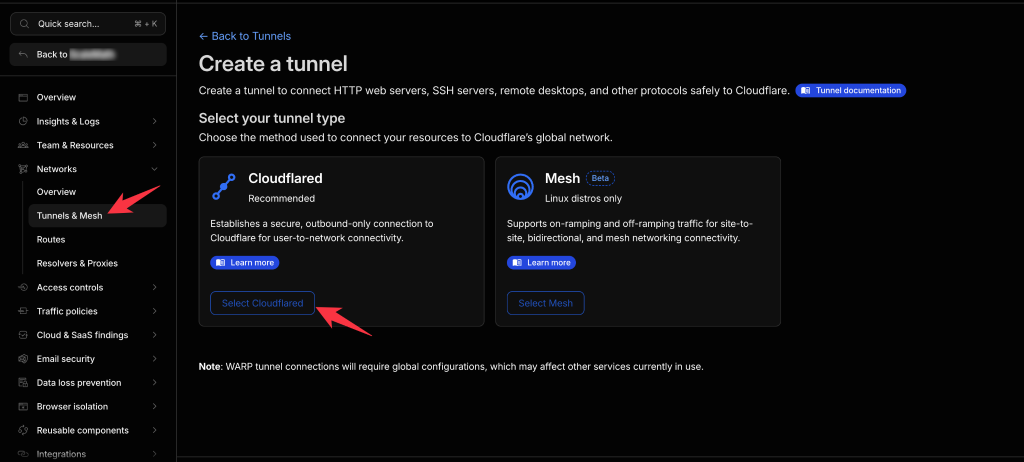
    Cloudflare zero trust tunnel and mesh

    Alternatively, you can also access the same Cloudflare Tunnel menu by navigating to Networking > Tunnels.
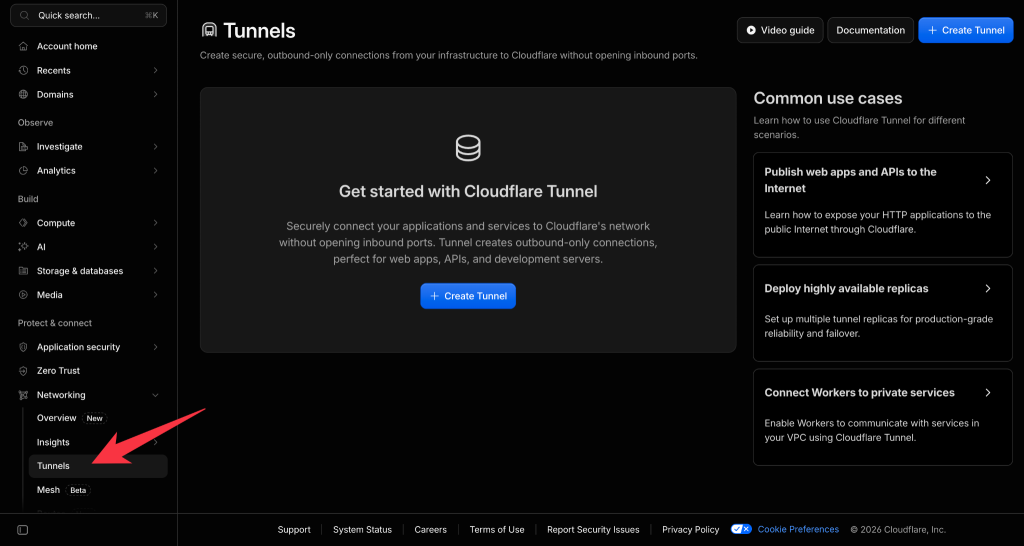
    Cloudflare tunnel dashboard

    On the next screen, you need to provide a descriptive name for your tunnel. After entering the name, click “Save tunnel” to create a new tunnel. 
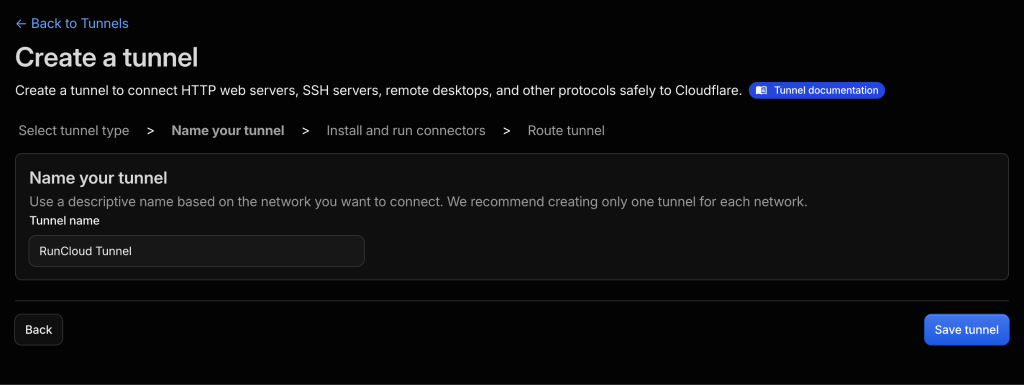
    creating a cloudflare tunnel

    With your tunnel configured, the next step is to install the cloudflared daemon on your server to establish the connection. The Cloudflare dashboard provides the installation commands for all operating systems. Simply copy and paste them into your terminal to get everything up and running.

    Suggested read: Cloudflare DNS for RunCloud (Security & Performance) 

    Authenticating the Daemon

    After the installation is complete, you’ll need to link your server to your Cloudflare account. If you followed the steps, you will see two commands on your Cloudflare dashboard. After you have installed cloudflared on your machine, you can pick what you want:

    • Install a service to automatically run your tunnel whenever your machine starts.
    • Run the tunnel manually only in your current terminal session.

    Copy and paste whichever command you wish to use. For this tutorial, we will only create a one-time tunnel. 
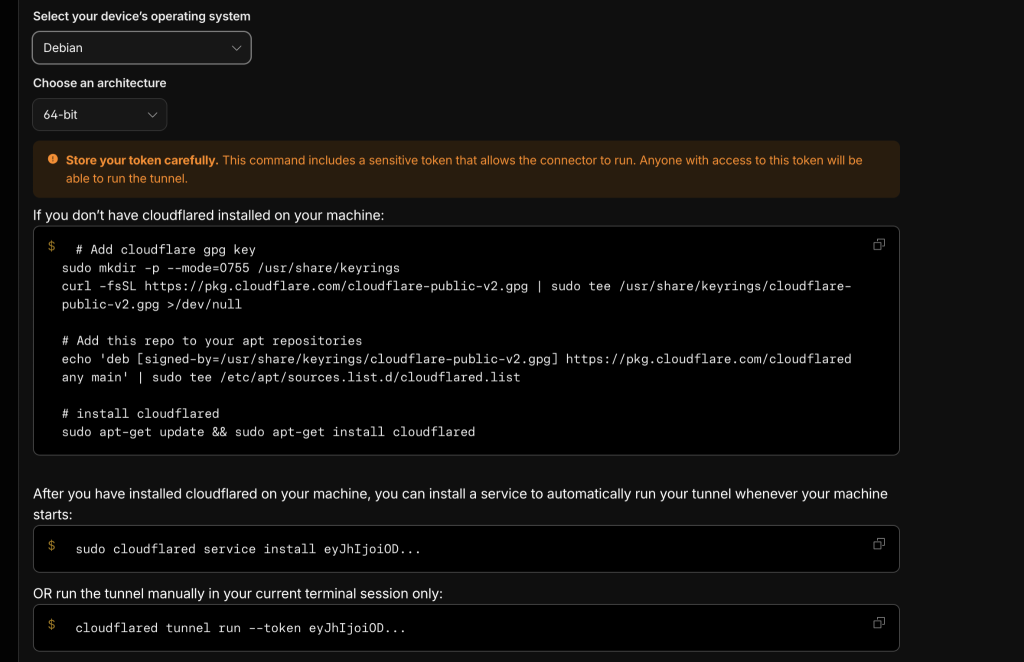
    Cloudflare tunnel installation commands

    Once the tunnel is up and running, you will see your device listed in the Cloudflare dashboard. If you want, you can install the daemon on more devices using the same command, or scroll to the bottom and click Next to add routes.
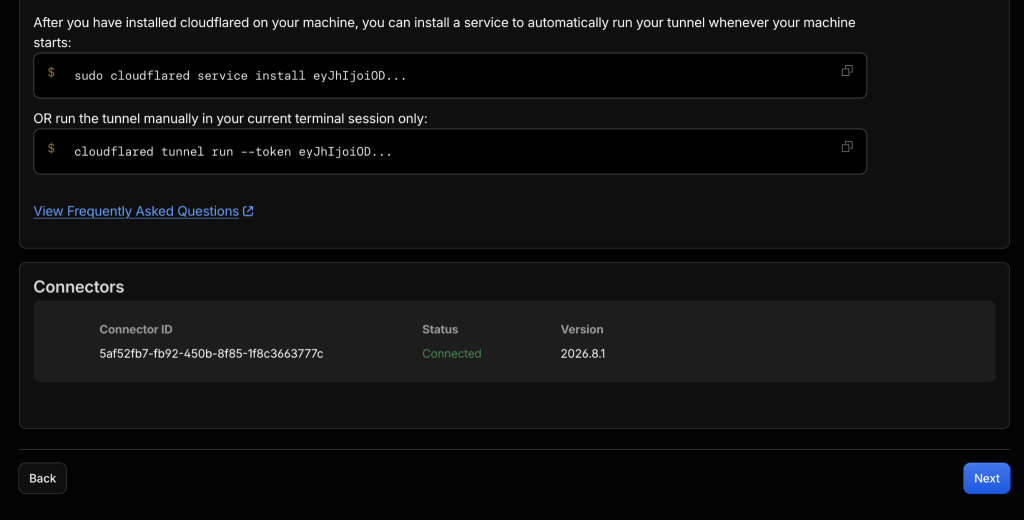
    Cloudflare tunnel commands

    Suggested read: How to Use Cloudflare Firewall Rules to Protect Your Web Application 

    Step 2: Publish Application Route

    Now that your tunnel is running, you can securely expose your local applications to the internet directly from the Cloudflare dashboard without needing further CLI commands.

    To publish your application route:

    1. Under the Hostname section, enter your desired subdomain (e.g., ‘localhost’) and select one of the domains connected to your Cloudflare account.
    2. Optionally, specify a path to route specific URL paths to this service, or just leave it blank.
    3. In the ‘Service’ section, select the protocol (e.g., HTTP) and enter the local address of your application. For example, if your app runs on ‘localhost:8765’, enter ‘localhost:8765’.
    4. After making the necessary changes, save the settings. 
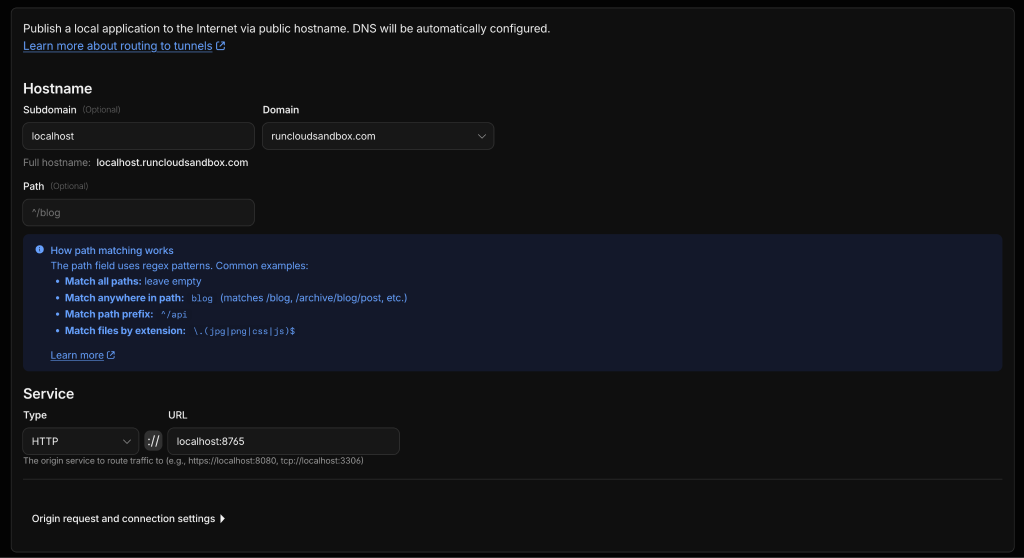
    Cloudflare tunnels setup

    Once saved, your application will be accessible via the public hostname you configured (e.g., ‘localhost.runcloudsandbox.com’). Anyone on the internet can now access your application as long as your tunnel is up and running. To stop unwanted visitors from viewing your application, we will now add Access policies to restrict traffic.

    Cloudflare Tunnels are not limited to standard HTTP traffic. You can easily route HTTPS, RDP, SSH, arbitrary TCP, and virtually any other protocol through them. The platform is extremely flexible and allows you to connect almost any self-hosted service or application. 

    Suggested read: Protect Your WordPress Login Pages with Cloudflare Zero Trust 

    Step 3: Secure Your Route with Cloudflare Zero Trust

    To prevent unauthorized users from accessing your server, you can secure it with Cloudflare Zero Trust. Whether you are protecting web applications, CLI connections, or SSH access, Cloudflare Zero Trust lets you gate access with identity controls. 

    While Cloudflare supports a wide range of authentication methods, this guide focuses on setting up a simple email-based One-Time Password (OTP) for quick setup.

    1. Navigate to Zero Trust > Access Control > Applications.
    2. Add a new Self-hosted application using the Public DNS template, then click Continue.
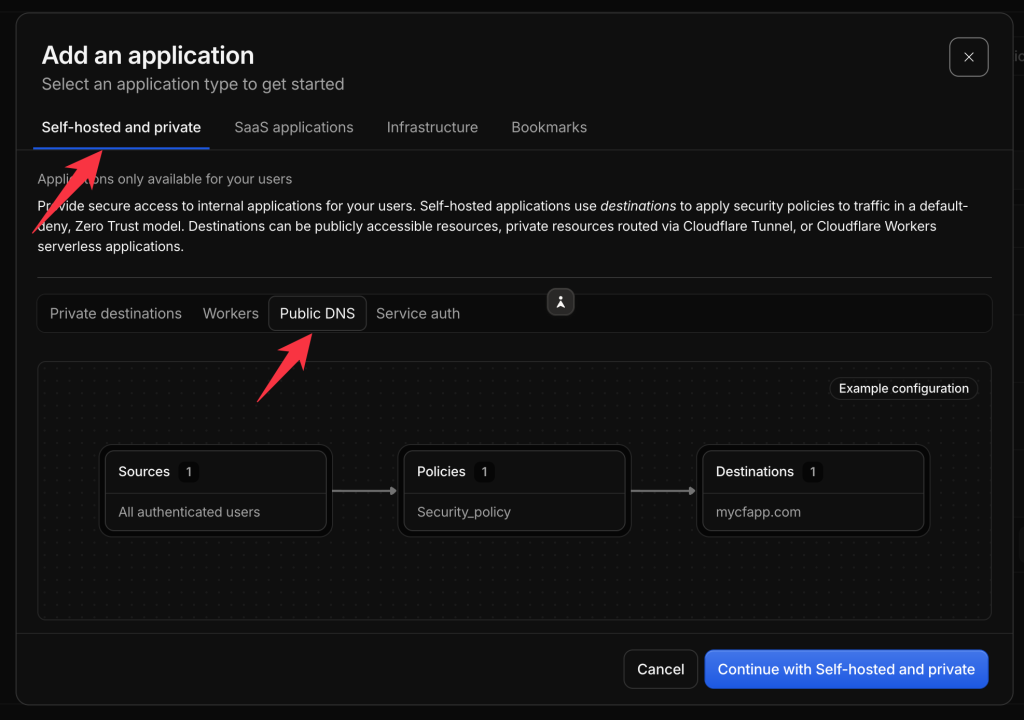
    application setup in cloudflare zero trust
    1. On the next screen, under the Destinations section, set the subdomain, domain, and path settings to the same values that you configured in Step 2.
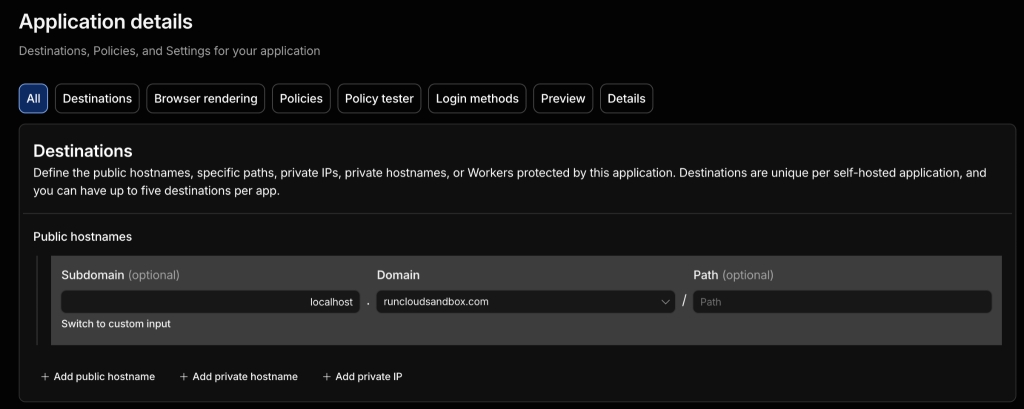
    domain setup in cloudflare zero trust
    1. Under the access policies section, create a new policy and create an access rule. You can create very complex rules as per your requirements. But to keep things simple, you can select “Email” from the dropdown and enter the list of email addresses that you want to allow access to. 
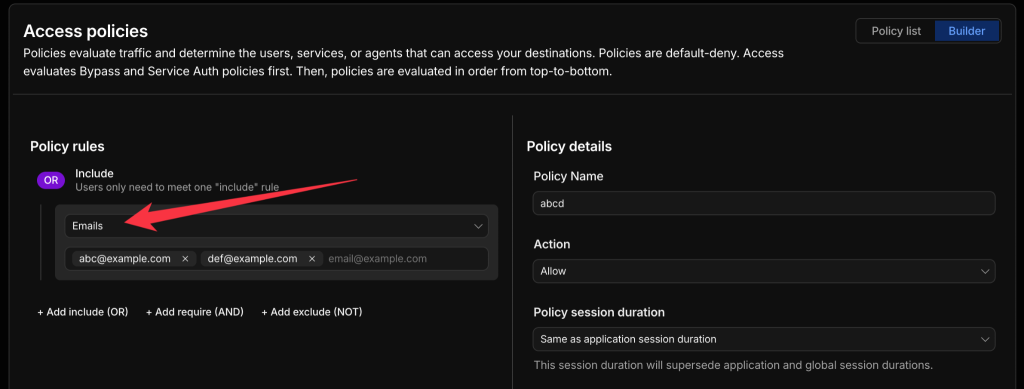
    access policies in cloudflare zero trust
    1. After setting up your policy, you need to configure an identity provider. Scroll down to the Authentication section and under the “Choose available identity providers for this application” dropdown list, select “one-time pin”.
    2. After configuring your changes, save your settings. It usually takes a couple of minutes to take effect. 
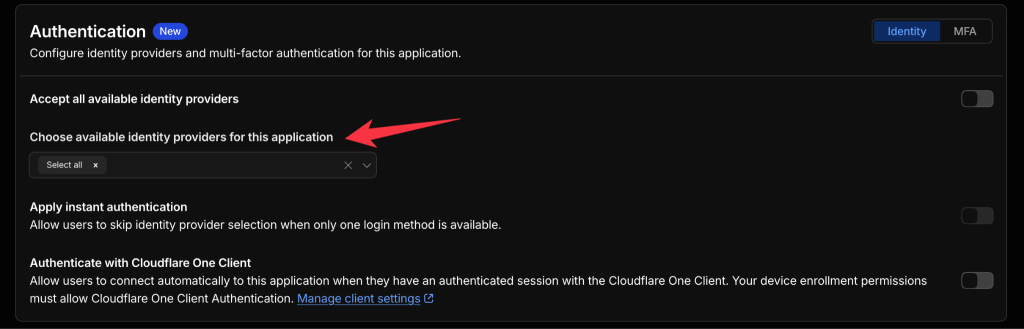
    Authentication methods in Cloudflare zero trust
    1. After saving, anyone who tries to access your protected path will see this security prompt before they can access your application.

    Suggested read: The 8 Best Cloudflare Alternatives in 2026 

    A Simpler Alternative: RunCloud Web Terminal

    While Cloudflare Tunnel is excellent for many use cases, you might be looking for a more streamlined way to access your server’s shell without the overhead of local configurations. That’s where the RunCloud Web Terminal comes in.

    This feature provides a collaborative, browser-based shell right in your RunCloud dashboard. It’s perfect for when you need to inspect logs, run a quick command, or collaborate with a teammate without opening ports or managing SSH keys locally.
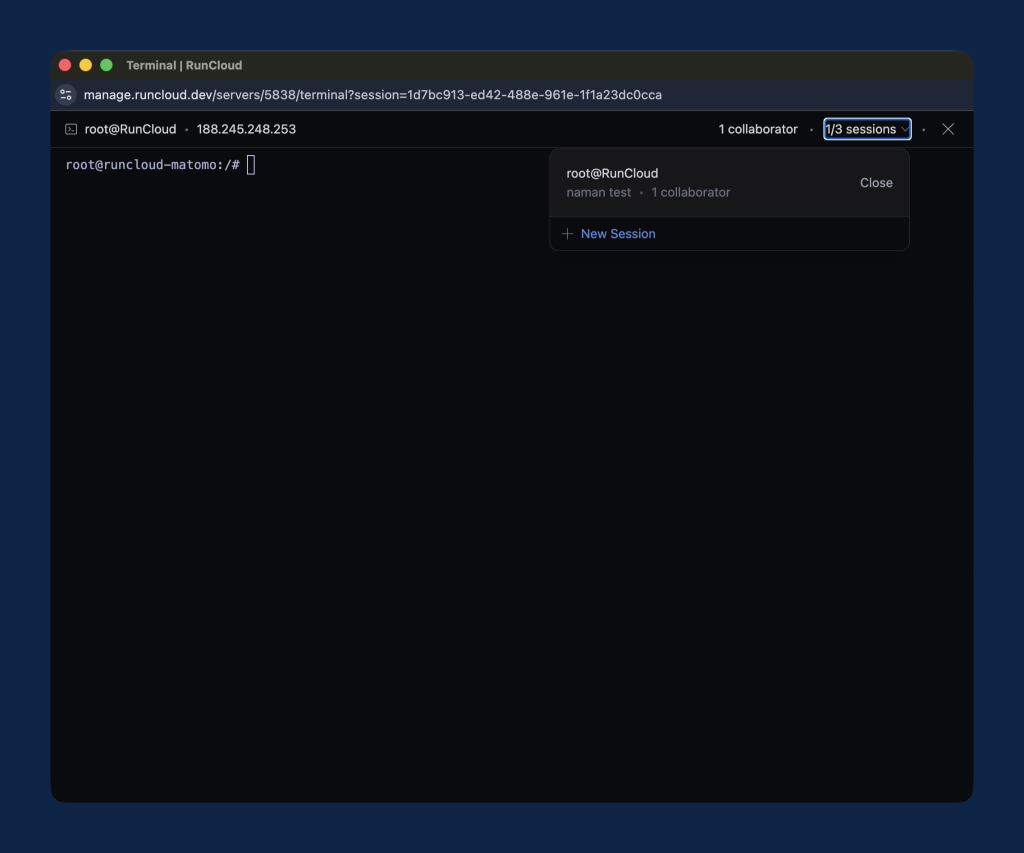
    RunCloud web terminal dashboard

    Why you’ll love the RunCloud Web Terminal:

    • Zero Local Hassle: Access your shell from any device with a browser.
    • No Key Management: Forget about distributing and rotating SSH keys; access is handled securely through RunCloud’s permissions.
    • Enhanced Security: It’s off by default and requires 2FA, ensuring only you or those you authorize can access the shell.
    • Real-Time Collaboration: You and your team can work in the same terminal window, making debugging a collaborative effort.
    • Encrypted & Safe: Everything happens over an encrypted WebSocket connection via the RunCloud agent, keeping your secrets safe.

    It’s a fantastic way to maintain control while keeping your server’s SSH ports locked down.

    Wrapping Up

    Cloudflare Tunnel improves server security by eliminating the need to leave ports open. By routing your web apps, databases, and custom protocols through secure, outbound-only connections, you can unlock true Zero Trust protection against port scans and automated attacks.

    However, when you pair this with RunCloud, managing a secure infrastructure becomes even simpler. RunCloud takes your server management to the next level with built-in features like the RunCloud Web Terminal. This feature comes configured out of the box, and there is no need to configure additional policies or install daemons, so it is quick and easy to access your command line securely without ever exposing SSH ports to the public internet.

    Start your journey with RunCloud today.

    Frequently Asked Questions

    Is Cloudflare Tunnel free?

    Yes, Cloudflare Tunnel is completely free to use as part of the Cloudflare Zero Trust platform. You can connect your server to Cloudflare without paying for extra bandwidth or connection limits. This makes it an affordable, enterprise-grade solution for securing your web applications and managing your servers.

    Is Cloudflare Tunnel secure enough for production servers?

    Yes, Cloudflare Tunnel is built for production environments and uses outbound-only connections to prevent unauthorized access. By eliminating the need to open inbound public ports on your firewall, it protects your server from direct IP-based attacks and port scans. You also get automatic encryption and full integration with Cloudflare security and DDoS protection features.

    What is the difference between Cloudflare Tunnel and a VPN?

    A traditional VPN grants users full network access to your entire infrastructure, which creates significant security risks if a device is compromised. In contrast, Cloudflare Tunnel safely exposes only specific applications without exposing your underlying network or server IP address. 

    Can I tunnel SSH and a web app over the same cloudflared instance?

    Yes, a single cloudflared daemon instance can route multiple services simultaneously. You can configure your setup to direct web traffic to port 80 and SSH traffic to port 22 simultaneously. This setup lets you manage server access and web applications efficiently through one secure connection.

    What happens to my tunneled services if Cloudflare has an outage?

    If Cloudflare experiences an outage, your tunneled services will become temporarily unreachable from the public internet. However, your underlying server and applications remain safe and operational behind your firewall. Once Cloudflare restores its global network, the cloudflared daemon automatically reconnects your services without requiring a server reboot.

    Should I tunnel my database with Cloudflare Tunnel?

    You can tunnel database connections for internal administration or secure remote access between private servers. However, you should not expose database ports directly to the public web for general application traffic. Combining Cloudflare Tunnel with Cloudflare Access ensures that only authenticated administrators can securely access your database.


  • The Best Ghost CMS Hosting 2026: Managed vs Self-Hosted Compared

    The Best Ghost CMS Hosting 2026: Managed vs Self-Hosted Compared

    Ghost is a sleek, lightning-fast, and modern alternative to WordPress that strips away the bulky plugins and focuses entirely on what matters most: creating incredible content, delivering high-performance SEO, and building a paid subscriber audience.

    But while the software itself is beautifully streamlined, figuring out your ghost website hosting can be surprisingly confusing.

    Because Ghost is built on a Node.js stack rather than traditional PHP, it requires a different server environment. This leaves many users torn between two frustrating extremes:

    1. Pay a massive monthly premium for a fully managed service.
    2. Work on the complex Linux command line to host it yourself.

    You shouldn’t have to choose between emptying your wallet and becoming a system administrator.

    In this guide, we will compare the true costs and technical requirements of managed plans versus unmanaged servers, and show you how to build the best ghost hosting setup.

    Understanding Your Ghost CMS Hosting Options

    If you’re coming from the WordPress ecosystem, your first instinct might be to look for a standard, cheap, shared hosting plan. However, Ghost hosting runs on a completely different server stack.

    Unlike traditional platforms that rely on PHP and run easily on standard cPanel setups, Ghost is built on a modern, lightning-fast Node.js stack. Because of this, you simply cannot drop a Ghost installation into a standard $3/month shared hosting bucket. It requires a server environment capable of running Node.js applications, managing background processes, and handling modern database systems such as MySQL or SQLite3.

    Because of these technical requirements, finding the right ghost blog hosting generally forces users down one of three distinct paths:

    1. Fully Managed Ghost Hosting: You pay a premium price for a company to handle all the servers, updates, and security on your behalf.
    2. DIY Self-Hosted (Unmanaged VPS): You rent a bare-metal server or VPS and use the command line (SSH) to build and maintain the environment yourself.
    3. Managed Cloud Servers: You rent an affordable VPS from any cloud provider, but use a graphical dashboard to easily manage the server and deploy your apps without needing to be a Linux expert.

    Let’s break down the pros, cons, and actual costs of these options.

    1. Managed Ghost Hosting 

    If you don’t want any technical responsibility, you should choose managed ghost hosting, as it is the simplest option. With a managed host, you are essentially renting software-as-a-service. The hosting company provides the infrastructure, handles all core Ghost software updates, manages database backups, and configures your SSL certificates.

    Ghost(Pro)

    Ghost(Pro) is the most popular managed option, as it is the official hosting service from Ghost’s creators. Choosing Ghost (Pro) is a great way to support the open-source project, as revenue goes directly toward funding Ghost’s development.

    Ghost(Pro) is incredibly easy to use, and its pricing is structured around audience size and features:

    • Starter: Suitable for solo blogs & newsletters ($15 USD/mo, billed annually). With this, you get your own website, a free custom domain, an email newsletter, Simple design settings, and 1,000 members.
    • Publisher: Recommended for custom publications ($29 USD/mo, billed annually). It provides 3 staff users, Custom themes, 8,000+ integrations, paid subscriptions, Advanced analytics, and 1,000 members.
    • Business: This plan is for teams scaling up ($199 USD/mo, billed yearly). It provides access to 15 staff users, Priority support, Higher usage limits, Early access to features, and 10,000 members.
    • Custom: This is a customizable plan for more complex needs. It provides unlimited staff users, Advanced configurations, a dedicated IP address, 99.9% uptime SLA, and unlimited members.

    Third-Party Managed Options

    Since Ghost is open-source, several third-party companies have stepped in to offer niche managed Ghost hosting alternatives at slightly lower price points. Providers like Midnight (starting around $12/month) and Magic Pages (starting around $15/month) offer fully managed setups that bypass some of Ghost(Pro)’s strict feature limits, catering to users who want managed convenience on a budget.

    Magic pages ghost hosting.

    The Drawbacks of Managed Hosting

    While managed hosting is highly convenient, it comes with two major compromises for developers, agencies, and growing creators:

    • The “Success Tax” (Cost Scaling): With managed hosting, your monthly bill scales aggressively as your email list grows, regardless of how much actual server traffic you receive. You are paying for audience size, not server compute power.
    • Strict Limitations: When you buy a managed Ghost plan, you only get Ghost. You’re paying for a single instance of the software. If you want to host a custom Laravel application, spin up a secondary WordPress site for a different project, or even launch a second Ghost blog, you can’t put them on the same plan. You have to purchase a completely separate hosting subscription, leaving you with multiple bills and fractured infrastructure.

    2. Ghost VPS Hosting & DIY Self-Hosting 

    This is the recommended approach for tech-savvy users who want total control over their data and infrastructure. VPS hosting means renting a blank Linux server from cloud providers such as DigitalOcean, Hetzner, AWS, Vultr, or Linode and building the environment from scratch.

    Unmanaged cloud servers start at $5 to $7 per month for a machine with 1GB to 2GB of RAM, offering incredible cost savings. However, the true cost is paid in your time and technical expertise.

    Many users are lured into DIY hosting by offerings like the DigitalOcean Marketplace “1-Click Ghost Install.” While it sounds incredibly convenient, it is largely a myth for non-developers.

    Yes, the initial installation is a one-click process. But from day two onward, you are acting as your own system administrator.

    When you use an unmanaged VPS, the cloud provider gives you the hardware and steps away. 100% of the server management is your responsibility. This means you must manually handle:

    • Ubuntu OS security patches via the command line (apt-get update).
    • Renewing Let’s Encrypt SSL certificates manually before they expire.
    • Configuring and monitoring server firewalls (UFW).

    • Updating Ghost itself via the command line interface (ghost-cli) often requires careful database backups beforehand.

    The Drawbacks of DIY Self-Hosting

    The glaring drawback to self-hosting Ghost with Docker or using the CLI is the steep learning curve. If you don’t have advanced Linux expertise, DIY hosting is highly risky. A single botched command during a routine update, or an overlooked security patch, can take your website offline for hours, or result in permanent data loss if you haven’t manually configured remote backups.

    3. The Best Ghost Hosting Solution: RunCloud

    If Managed Hosting is too restrictive and expensive, and DIY VPS Hosting is too complicated and risky, where does that leave you?

    The answer is RunCloud.

    RunCloud sits directly in the “sweet spot” between these two extremes, providing the absolute best ghost hosting experience by combining the cost savings of a VPS with the automated ease of a managed platform.

    Here is why developers, agencies, and publishers use RunCloud for their ghost website hosting:

    Choose Your Own Cloud Infrastructure

    With RunCloud, you aren’t locked into proprietary servers. You simply rent a bare-metal server from your favorite cloud provider, whether that’s a highly affordable $5/month Hetzner server, a DigitalOcean Droplet, or a robust AWS EC2 instance. You pay wholesale prices directly to the cloud provider, and RunCloud connects to it via our platform to handle the management.

    Host More Than Just Ghost (Maximize Your Server)

    This is RunCloud’s biggest advantage over official managed platforms. When you use RunCloud, the server is entirely yours. You’re not artificially limited to a single application.

    Let’s say you rent a $12/month server with 4GB of RAM. With RunCloud, you can seamlessly host Ghost and WordPress on the same server. An agency could host a client’s primary WordPress e-commerce site, a custom Laravel backend API, and a sleek new Ghost blog all on the same VPS. By stacking multiple web applications on a single server, your actual hosting cost per website drops to pennies.

    RunCloud monitoring Dashboard

    Zero Linux Expertise Required

    RunCloud replaces the black SSH terminal screen with a beautiful, intuitive graphical dashboard. You get full server control without memorizing Linux commands. With a few clicks in the RunCloud dashboard, you can:

    For a complete technical walkthrough, follow our comprehensive guide on How to Deploy Ghost via Docker on RunCloud.

    Frequently Asked Questions (FAQs)

    What is the cheapest Ghost hosting?

    You can get the cheapest ghost hosting by renting a budget-friendly VPS from providers like Hetzner or DigitalOcean for around $4-$6 per month. By connecting that unmanaged server to RunCloud, you can get premium, managed-like dashboard features without paying the high monthly subscription fees of dedicated hosting companies.

    Can I use shared hosting for Ghost CMS?

    You cannot use shared hosting for Ghost because it runs on a modern Node.js stack rather than traditional PHP. Most cheap shared hosting environments (like standard cPanel setups) do not support the persistent background processes required to run Node.js applications, which is why a dedicated VPS or cloud server is necessary.

    What are the best Ghost hosting alternatives to Ghost Pro?

    The most cost-effective alternative to Ghost Pro is self-hosting on your own cloud infrastructure using a server management panel like RunCloud. This gives you lightning-fast performance and security for a fraction of the cost, preventing your hosting bill from skyrocketing as your email subscriber list grows.

    How much RAM do I need for a Ghost server?

    To install and run a Ghost blog smoothly, you need a server with at least 1GB of RAM. However, upgrading to a server with 2GB or more is highly recommended to ensure stability during traffic spikes or if you plan to host additional web applications alongside your blog on the same server.

    Wrapping Up

    When you’re launching your website, choosing the right infrastructure shouldn’t be a trade-off. Fully managed plans are often too expensive and restrictive for growing creators, while DIY self-hosting on a blank VPS requires advanced Linux skills that are too risky and time-consuming for non-developers.

    RunCloud is the perfect middle ground for Ghost hosting.

    By bringing your own cloud server to RunCloud, you can get the best of both worlds: wholesale server pricing, the freedom to host multiple web applications on a single machine, and an intuitive dashboard that handles all the complex server management for you.

    Sign up for a RunCloud account today and connect your first server.

  • How to Enable HTTP/3 on NGINX

    How to Enable HTTP/3 on NGINX

    If you’re running NGINX on a modern server, you’re likely leaving performance on the table by sticking with HTTP/2.

    HTTP/3 changes how browsers connect to your server. It reduces latency, improves performance on unstable networks, and can noticeably speed up real-world page loads – especially for mobile users.

    The problem is that enabling HTTP/3 on NGINX isn’t straightforward. It requires the right version, specific modules, firewall changes, and careful configuration. One small mistake can stop NGINX from restarting.

    In this guide, you’ll learn exactly how to enable HTTP/3 on NGINX step by step – from checking compatibility to verifying that it’s working correctly.

    Step-by-Step Instructions for Enabling HTTP/3 on NGINX

    Use the steps below to enable and verify HTTP/3 on your Ubuntu server.

    Step 1: Ensure You Meet Prerequisites for HTTP/3

    Before enabling HTTP/3 (QUIC) on your Ubuntu server, ensure your environment meets the prerequisites. Since HTTP/3 works over UDP rather than TCP, your underlying web server, network firewall, and encryption standards must support it.

    NGINX Version Supports HTTP/3

    The most important requirement for enabling HTTP/3 is having a compatible NGINX version. According to the official NGINX QUIC documentation, support for QUIC and HTTP/3 was officially introduced in NGINX version 1.25.0. In these newer releases, the required ngx_http_v3_module is included in the official Linux binary packages by default.

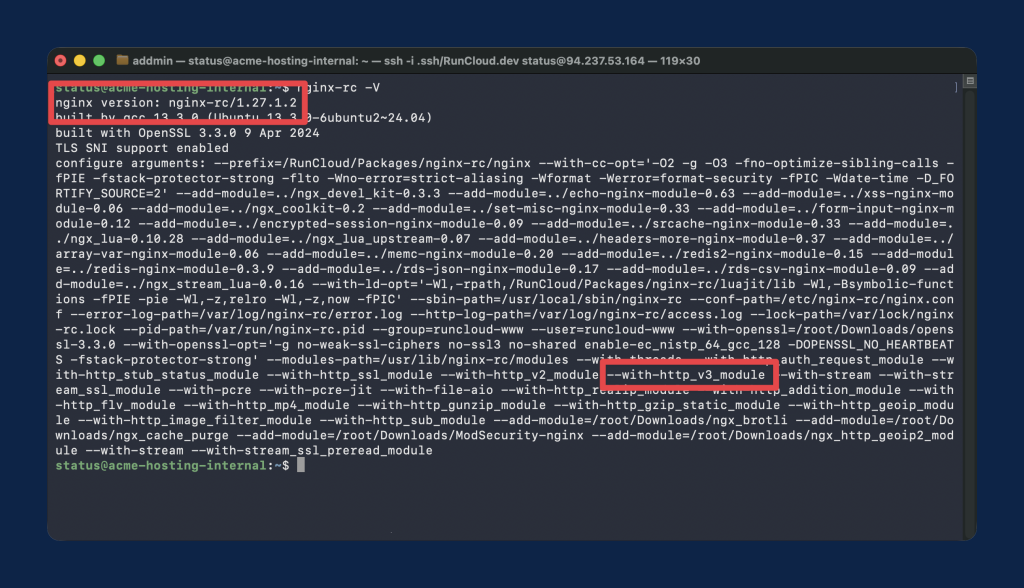
    How to Check Your Current Version: Run the following command to check your NGINX version and its compiled modules:

    nginx -V 2>&1 | grep --color -- --with-http_v3_module
    nginx server compile flags

    Look for nginx version: nginx/1.25.0 (or higher) and ensure that --with-http_v3_module is present in the configure arguments.

    If your Ubuntu repository ships older “stable” releases (like 1.18.x or 1.24.x) that do not include HTTP/3 support out of the box. Then you can install the Mainline version from the official NGINX repositories.

    Run the following commands to install the necessary dependencies:

    1. Install prerequisite packages:
    sudo apt update
    sudo apt install curl gnupg2 ca-certificates lsb-release ubuntu-keyring
    1. Import the official NGINX GPG signing key:
    curl https://nginx.org/keys/nginx_signing.key | gpg --dearmor | sudo tee /usr/share/keyrings/nginx-archive-keyring.gpg >/dev/null
    1. Add the NGINX Mainline repository for Ubuntu:
    echo "deb[signed-by=/usr/share/keyrings/nginx-archive-keyring.gpg] \
    http://nginx.org/packages/mainline/ubuntu `lsb_release -cs` nginx" \
    | sudo tee /etc/apt/sources.list.d/nginx.list
    1. Prioritize NGINX packages (APT Pinning): This ensures Ubuntu prioritizes the official NGINX repository over its own default repositories.
    echo -e "Package: *\nPin: origin nginx.org\nPin-Priority: 900\n" | sudo tee /etc/apt/preferences.d/99nginx
    1. Install the latest NGINX version:
    sudo apt update
    sudo apt install nginx

    Suggested read: How to Set Up a Hetzner Server with RunCloud 

    SSL Certificates are Configured (HTTP/3 Requires TLS 1.3)

    Unlike older HTTP versions, where HTTPS was a secondary layer, HTTP/3 inherently requires encryption via QUIC. You cannot run HTTP/3 over unencrypted http:// connections. Additionally, the QUIC protocol mandates the use of TLS 1.3 to enable faster 0-RTT (Zero Round Trip Time) handshakes and better security.

    Before proceeding, you must ensure:

    1. You have a valid domain name pointing to your Ubuntu server’s IP address.
    2. An SSL/TLS Certificate is configured. A free certificate from Let’s Encrypt (using Certbot) is perfect for this.
    3. TLS 1.3 is enabled in your config. Verify that your existing NGINX server block contains TLSv1.3 in the ssl_protocols directive.

    Your current HTTPS block should look something like this before adding HTTP/3:

    server {
        listen 443 ssl;
        server_name example.com;
    
    
        ssl_certificate /etc/letsencrypt/live/example.com/fullchain.pem;
        ssl_certificate_key /etc/letsencrypt/live/example.com/privkey.pem;
    
    
        # TLS 1.3 MUST be included for QUIC/HTTP/3 to function
        ssl_protocols TLSv1.2 TLSv1.3;
    }

    Root or Sudo Access to Edit NGINX Config

    Finally, you will need root or sudo access to your Ubuntu server. Upgrading to HTTP/3 requires modifying core NGINX configuration files, tweaking firewall rules, and restarting system services.

    Step 2: Open UDP Port 443 on Your Firewall

    Unlike HTTP/1.1 and HTTP/2 which rely on TCP, HTTP/3 uses the QUIC protocol, which operates entirely over UDP. If you don’t explicitly open UDP port 443 on your firewall, client requests will never reach your NGINX HTTP/3 listener, and browsers will silently downgrade back to HTTP/2 over TCP.

    UFW (Ubuntu)

    If you are using Uncomplicated Firewall (UFW), which comes standard on Ubuntu, simply run:

    sudo ufw allow 443/udp
    sudo ufw reload

    iptables

    If you manage your firewall directly using iptables, run the following to append the UDP rule:

    sudo iptables -A INPUT -p udp --dport 443 -m conntrack --ctstate NEW,ESTABLISHED -j ACCEPT

    After making the changes, you need to save your iptables rules using netfilter-persistent save or iptables-save, depending on your server setup

    Cloud Firewall (Hetzner, GCP, DigitalOcean)

    If your server is hosted on a cloud provider, local firewall rules (UFW/iptables) are often overridden or supplemented by cloud-level security groups. The exact steps will vary depending on your cloud provider:

    • Hetzner Cloud: Go to your server’s “Firewalls” tab and add an Inbound rule for Protocol: UDP, Port: 443.
    • Google Cloud Platform (GCP): Go to VPC Network > Firewall. Create a new ingress rule targeting your instance, select UDP, and specify port 443.
    • DigitalOcean: Navigate to Networking > Firewalls. Add an Inbound Rule for Custom UDP on port 443.

    Pro Tip: If you are using RunCloud to manage your infrastructure, our official server setup guides for providers like Hetzner and GCP cover this firewall step in great detail.

    Step 3: Add the QUIC Listener and HTTP/3 Directives to Your Server Block

    Now it’s time to tell NGINX to actually listen for QUIC traffic and advertise HTTP/3 capabilities to the browser.

    Open your website’s NGINX configuration file (e.g., sudo nano /etc/nginx/conf.d/example.com.conf or /etc/nginx/sites-available/default).

    Here is a complete, copy-paste-ready server block configured for HTTP/3:

    server {
        # 1. Standard TCP listener for HTTP/1.1 and HTTP/2 (Fallback)
        listen 443 ssl;
        
        # 2. UDP listener for QUIC and HTTP/3
        listen 443 quic reuseport;
    
    
        server_name example.com www.example.com;
    
    
        # 3. SSL/TLS Certificates
        ssl_certificate /etc/letsencrypt/live/example.com/fullchain.pem;
        ssl_certificate_key /etc/letsencrypt/live/example.com/privkey.pem;
    
    
        # 4. Enable TLS 1.3 (Required for HTTP/3)
        ssl_protocols TLSv1.2 TLSv1.3;
    
    
        # 5. Core HTTP/3 Directives
        http3 on;
        quic_retry on;
        ssl_early_data on;
    
    
        # 6. Advertise HTTP/3 to clients via the Alt-Svc header
        add_header Alt-Svc 'h3=":443"; ma=86400' always;
    
    
        # The rest of your location blocks go here...
        location / {
            try_files $uri $uri/ =404;
        }
    }

    Each directive below controls a specific part of how HTTP/3 works in NGINX. Here’s what each one does and why it matters.

    listen 443 quic reuseport;
    Tells NGINX to listen for UDP traffic on port 443 and distributes the processing load across multiple worker processes.

    http3 on;
    enables the HTTP/3 protocol decoding for the current server block.

    ssl_protocols TLSv1.3;
    Configures the use of TLS 1.3, the strict encryption standard required by the QUIC protocol.

    quic_retry on;
    Defends against UDP spoofing attacks by requiring clients to validate their IP address during the handshake.

    ssl_early_data on;
    Enables 0-RTT (Zero Round Trip Time), allowing returning clients to resume encrypted connections instantly without handshake delays.

    add_header Alt-Svc 'h3=":443"; ma=86400' always;
    Tells connecting web browsers, “Hey! I support HTTP/3 on port 443, remember this for the next 86,400 seconds (1 day).”

    If you host multiple websites (virtual hosts) on the same NGINX server, you need to be careful with the reuseport parameter. You can only define reuseport once per IP and port combination.

    For your primary website, use: listen 443 quic reuseport;

    For all other websites on the same server, omit reuseport: listen 443 quic; If you put reuseport in multiple server blocks, NGINX will throw an error and refuse to start.

    Suggested read: How to Set Up a Google Cloud Server to Host Your Websites 

    Step 4: Test and Reload NGINX

    Whenever you alter NGINX configurations, you must test the syntax before applying the changes to prevent your live server from crashing.

    Run a configuration test to confirm your changes are valid before reloading NGINX:

    sudo nginx -t

    If the output says nginx: configuration file /etc/nginx/nginx.conf test is successful, apply the changes instantly without dropping active connections by reloading NGINX:

    sudo nginx -s reload

    Step 5: Verify HTTP/3 Is Active

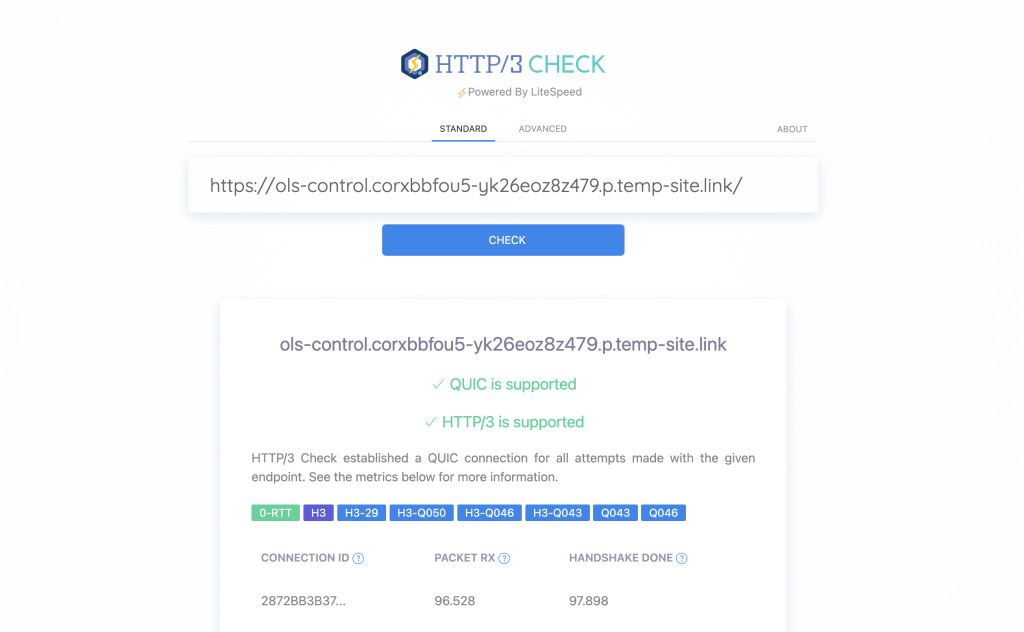
    You can use a web-based testing tool like http3check.net to check your setup is working as expected. Simply type your website’s domain name into the search bar and click “Check”. The tool will attempt a QUIC connection from its own servers and confirm whether UDP port 443 is open, TLS 1.3 is functioning, and your NGINX instance is successfully serving HTTP/3.

    Suggested read: How to Fix ERR_SSL_VERSION_or_CIPHER_MISMATCH 

    Enable HTTP/3 Without Touching Config via RunCloud

    Managing NGINX configurations manually can quickly become a headache, especially as your server scales. One typo in your nginx.conf, forgetting to open a UDP port, or accidentally duplicating the reuseport directive across multiple server blocks can crash your entire web server.

    If you have just completed all the manual steps above, you might be wondering: Is there an easier way to do this for my next server?

    The answer is ‘yes’, and the solution is RunCloud.

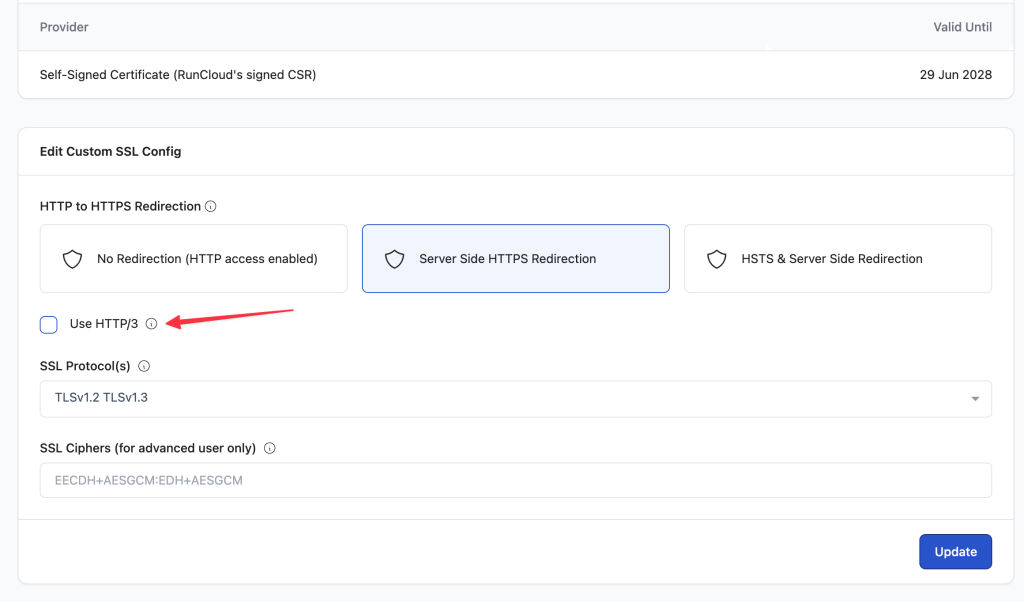
    enable http3 in runcloud nginx

    With RunCloud, you can skip the command line entirely, instead enabling HTTP/3 for each web application directly from your dashboard with a single toggle.

    Here’s how RunCloud simplifies the process:

    • No SSH Required: You never have to log in to your server’s terminal to edit configuration files.
    • No reuseport Management: RunCloud’s automated NGINX stack intelligently handles the listen 443 quic reuseport rule across multiple domains. You never have to worry about conflicting server blocks.
    • One-Click Toggles: Simply navigate to your Web Application settings, toggle HTTP/3 on, and RunCloud safely reloads your NGINX server in the background.

    For more details on how effortlessly this works, check out the official RunCloud documentation on enabling HTTP/3.

    Wrapping Up

    In this post, we have discussed the steps required to enable HTTP/3 on an NGINX server. As you can see, the manual process requires several intricate steps: checking NGINX versions, configuring firewalls for UDP port 443, and carefully modifying server block directives.

    While the benefits of HTTP/3 are worth the effort, manual configuration is tedious and prone to human error. You don’t have to do it this way.

    You can completely skip the command line and complex configuration files by using RunCloud.

    RunCloud is a server management dashboard for PHP and web applications. It provides a visual interface for configuring firewalls, managing databases, deploying code via Git, and enabling features like HTTP/3 without editing configuration files.

    If you want to avoid manual setup and reduce the risk of configuration errors, sign up for RunCloud and enable HTTP/3 in a few clicks.

    FAQs

    Does enabling HTTP/3 break HTTP/2 or HTTP/1.1?

    No, enabling HTTP/3 does not break older protocols because it runs on UDP port 443, while HTTP/2 and HTTP/1.1 operate over TCP. Modern web servers and browsers use a “fallback” mechanism that ensures that if a client doesn’t support QUIC (the foundation of HTTP/3), the connection seamlessly reverts to HTTP/2 without the user noticing.

    Why does curl –http3 work but Chrome still shows HTTP/2?

    Command-line tools like curl can be forced to use a specific protocol, but Chrome requires the server first to send an Alt-Svc (Alternative Services) header to “discover” that HTTP/3 is available. Because HTTP/3 runs over UDP, Chrome often completes the initial handshake over TCP (HTTP/2) and switches to HTTP/3 only for subsequent requests or after the protocol is cached in the browser’s memory.

    Is HTTP/3 on NGINX production-safe?

    Yes, HTTP/3 is considered production-safe and is officially supported in the NGINX mainline releases, though you should monitor your server’s CPU usage closely. Because QUIC handles encryption and packet loss at the application level rather than the kernel level, it can be more CPU-intensive than HTTP/2, especially during high-traffic spikes.

    How do I disable HTTP/3 on NGINX if needed?

    To disable HTTP/3, simply remove the quic and reuseport parameters from your listen 443 directives, and delete the add_header Alt-Svc line from your configuration file. Once you run nginx -s reload, the server will stop advertising QUIC capabilities and will no longer accept connections over UDP port 443, forcing all traffic back to standard TCP.

    Do I need a special SSL certificate for HTTP/3?

    No, your standard SSL/TLS certificate (such as a free Let’s Encrypt certificate) will work perfectly. However, the QUIC protocol explicitly requires TLS 1.3, so your NGINX configuration must enable TLS 1.3.

  • How to Easily Find Your DNS Server IP Address in Linux

    How to Easily Find Your DNS Server IP Address in Linux

    DNS translates domain names into IP addresses so your system knows where to connect. In this guide, you will learn exactly how to check DNS server settings in Linux across all major distributions, including Ubuntu, Debian, CentOS, and RHEL.

    You’ll learn the difference between static configuration files and dynamic network managers so you can accurately list DNS servers for troubleshooting or security audits.

    Whether you’re a system administrator working via SSH or a desktop user navigating the GNOME interface, this comprehensive walkthrough ensures you never have to wonder “which DNS am I using” again.

    How to Find the Current DNS Server in Linux

    There are four common ways to view the DNS server settings in Linux:

    Method 1: Check Your DNS Server with the Terminal

    The Linux terminal is an incredibly powerful tool, and for tasks like this, it’s often the fastest way to get the information you need. You can get this information quickly with a single command. Follow the steps below to get started:

    Step 1: Open the Terminal

    First, open the terminal application. You can find it in your applications menu, or use the common keyboard shortcut: Ctrl + Alt + T.

    This will open up a new window, where you can enter your commands. If you are connected to the server via SSH, then you don’t need to take any additional steps. You can type your commands in this shell, as it’s the terminal itself.

    Step 2: Check the resolv.conf File

    For this step, you will use the cat command, which simply reads a file and displays its contents on the screen.

    In your terminal, type the following command and press Enter:

    cat /etc/resolv.conf

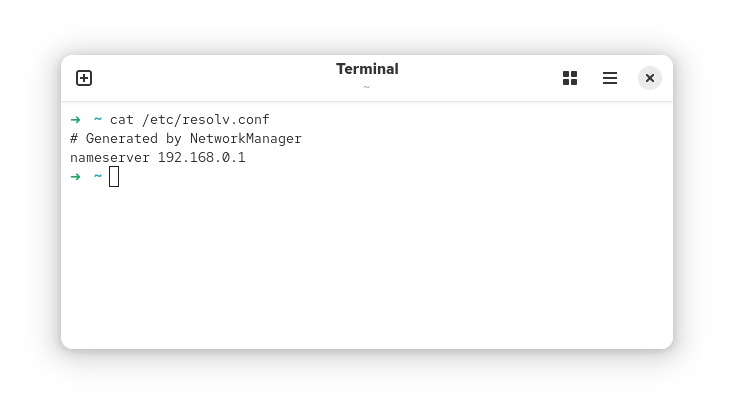
     You will see an output similar to the image below:

    Look for the line that starts with nameserver. The IP address immediately following it is the DNS server your system is configured to use. In the example above, the DNS server is 192.168.0.1.
    If you see an address like 192.168.0.1, your system is using your router for DNS, which then forwards the request to your ISP. This is a very common and default setup.

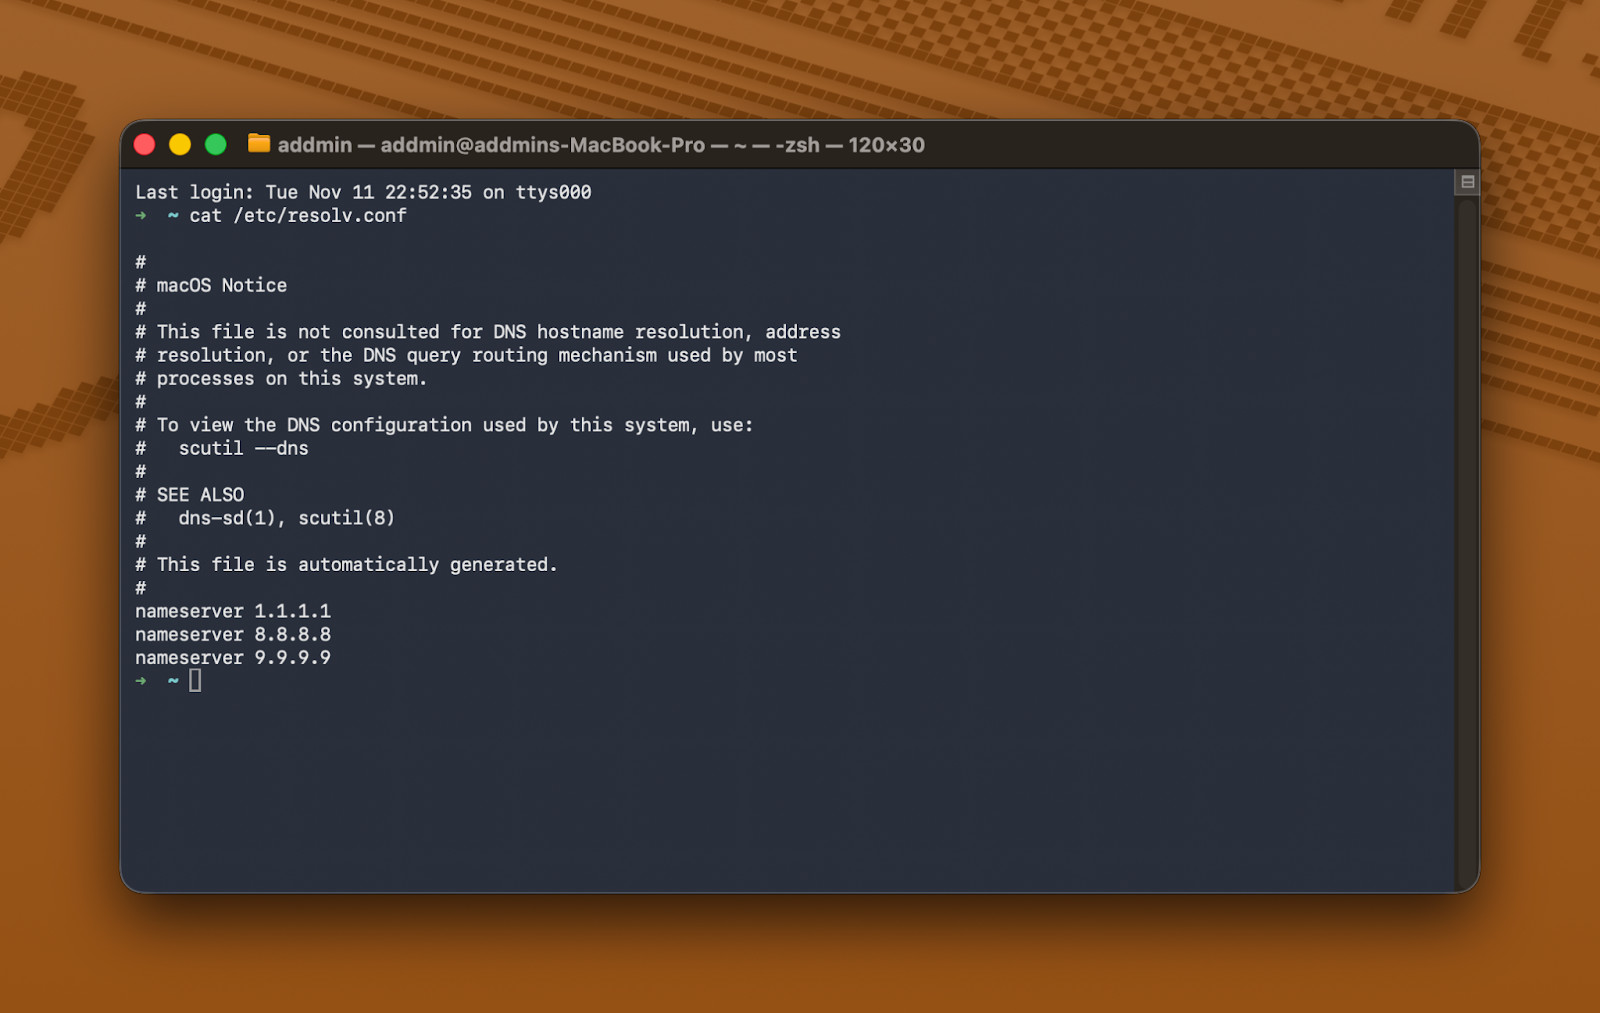
    If you have explicitly defined the DNS servers in your network configuration, then you might get an output similar to the following image:

    In the above example, the computer is using three different DNS servers with the following IP addresses: 1.1.1.1, 8.8.8.8, and 9.9.9.9, which belong to Cloudflare, Google, and Quad9, respectively. 

    systemd-resolved vs /etc/resolv.conf

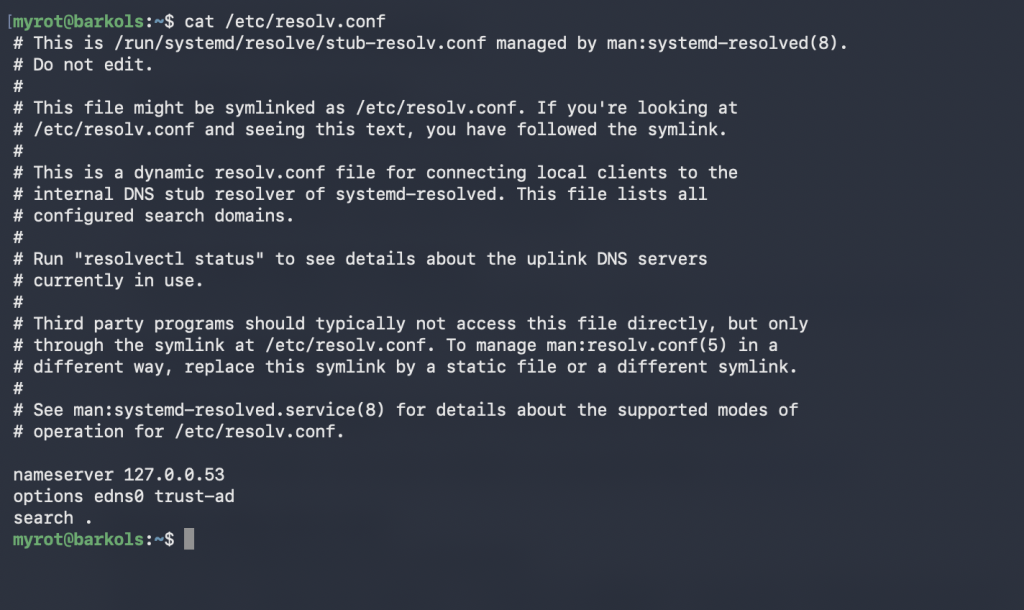
    If you run cat /etc/resolv.conf on modern Linux distributions (like Ubuntu 18.04 and later), you will see a nameserver entry for 127.0.0.53. This doesn’t mean your actual DNS server is on your own machine.

    On these systems, /etc/resolv.conf is often a symbolic link to a “stub” file managed by systemd-resolved. The 127.0.0.53 address is a local DNS stub listener that forwards your requests to the actual upstream DNS servers.

    While this file is technically “accurate” for the OS, it doesn’t list the external DNS providers (like Google or Cloudflare) you’re actually using. To see the true upstream nameservers on these systems, you must use Method 3 (resolvectl) or Method 4 (nmcli).

    Method 2: Find The DNS Server in Linux Using The GNOME Graphical Interface

    If you prefer clicking over typing, Linux desktop environments such as GNOME provide a user-friendly way to see your network settings.

    Step 1: Open Your System Settings

    Click on the system tray area in the top-right corner of your screen, where you see the icons for Wi-Fi, volume, and power. In the menu that appears, click the gear icon (⚙️) to open the Settings window.

    Step 2: Go to Network Settings

    In the Settings window, look at the menu on the left-hand side. Click on either Wi-Fi or Wired, depending on your connection method.

    Step 3: Open Your Active Connection’s Details

    You will now see a list of available networks. Find the network you are currently connected to (it will be the one that’s toggled on). To the right of its name, click the gear icon (⚙️) to open its specific settings.

    Step 4: Find Your DNS Entry

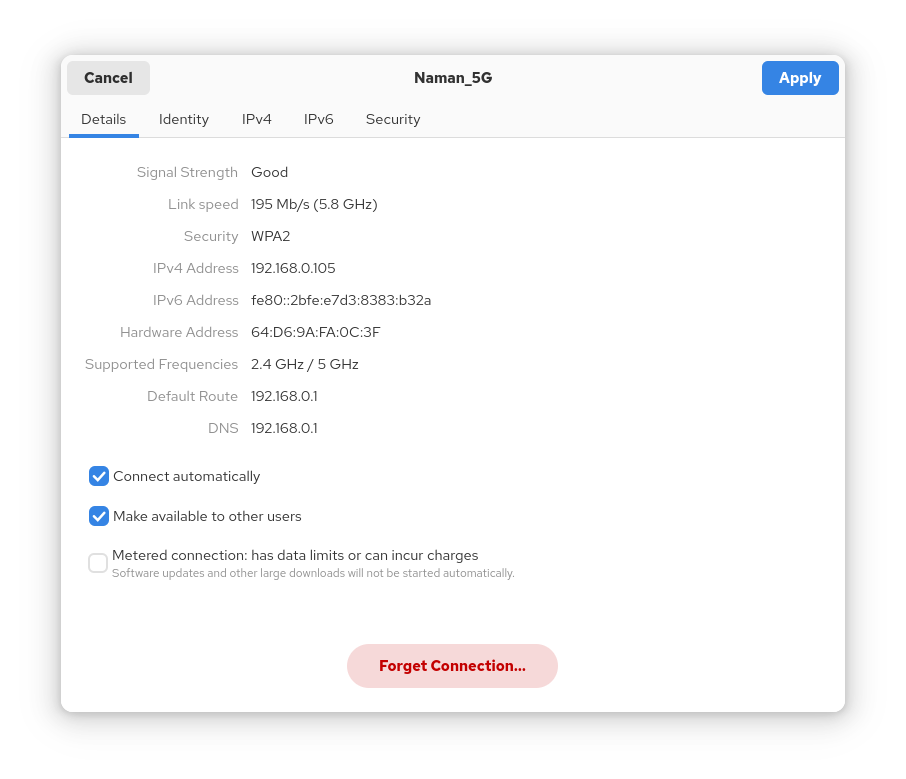
    A new window will pop up with several tabs. It will open on the Details tab by default. Here, you can immediately see a summary of your connection. Look for the DNS entry to find your server’s IP address.

    As you can see, the DNS is listed as 192.168.0.1, which matches what we found in the terminal.

    Step 5: Understanding the “Automatic” Setting

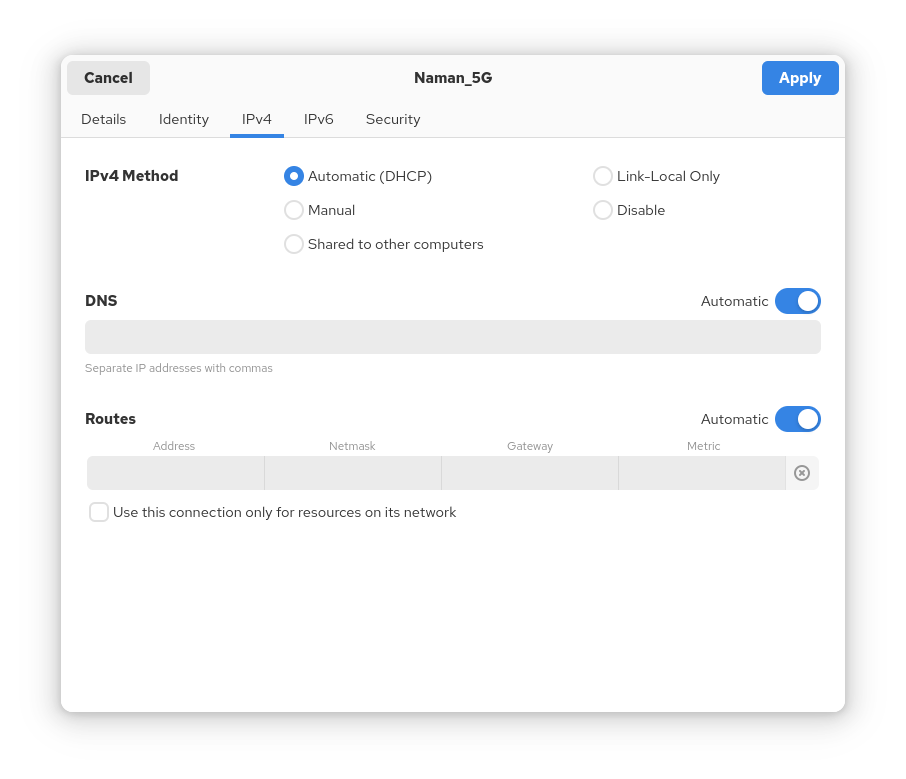
    To see why you have this DNS server, click on the IPv4 tab at the top of this same window.

    Notice that the DNS setting has a switch toggled to Automatic. This setting, along with the Automatic (DHCP) option for IPv4 Method, instructs your computer to automatically accept the network settings provided by your router.

    Most systems use DNS settings provided automatically by the router (via DHCP). Switching to Manual lets you specify your own DNS server. If you want to manually set a different DNS server (such as Google’s 8.8.8.8), toggle this switch off, then enter the new IP address in the field.

    Method 3: Use resolvectl 

    On Linux distributions that use systemd-resolved, the resolvectl command is the recommended way to check your DNS status. This tool provides a detailed breakdown of which DNS servers are assigned to specific network interfaces.

    To use this method, you first need to connect to your remote server via SSH as described in Method 1. Once you are logged in to the terminal, run the following command:

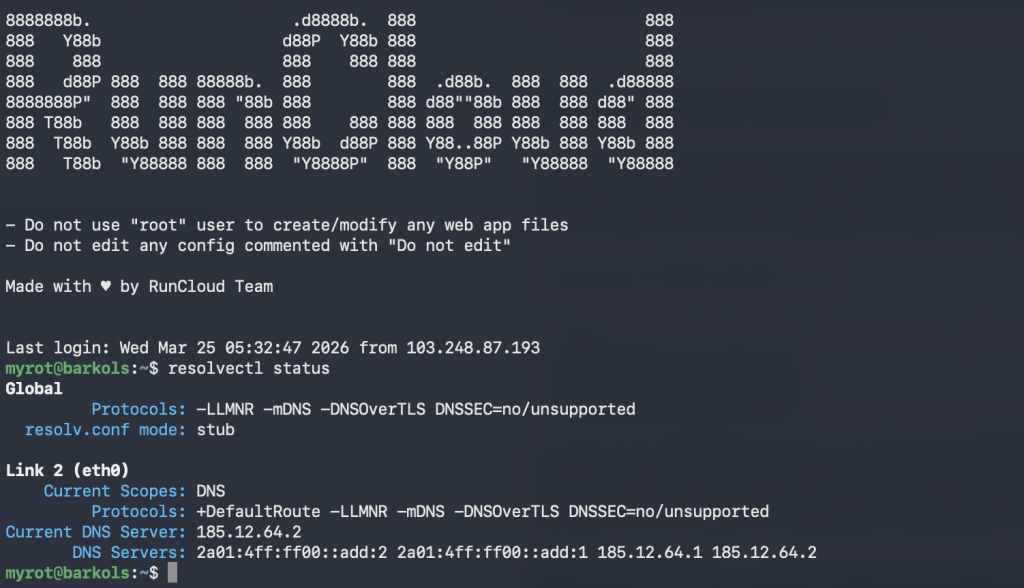
    resolvectl status
    resolvectl status

    Look for the “DNS Servers” and “Current DNS Server” lines under your active network interface. This will show the actual IP addresses of the DNS providers your system is querying, bypassing the local stub address.

    Method 4: Use nmcli (NetworkManager Systems)

    If your server uses NetworkManager to handle connections (common in RHEL, CentOS, and most Desktop environments), the nmcli tool is the most efficient way to query DNS settings directly from the networking stack.

    Use the following command to display your network details:

    nmcli device show | grep IP4.DNS

    This command filters the output to show only the IPv4 DNS servers assigned to your active devices. It displays the DNS servers exactly as they were received from DHCP or manually configured in the NetworkManager profile.

    Bonus: Query a Site Using Any DNS Server

    After identifying your DNS server, you may not be completely satisfied with it. If you are facing network issues, you can bypass your local settings entirely and request a website’s IP address from any public DNS server worldwide.

    Why would you do this?

    If a site loads for others but not for you, your DNS server might be outdated, overloaded, or applying filters. Querying a public DNS server gives you a clean comparison.

    dig @<DNS-SERVER-IP> <WEBSITE-TO-LOOKUP>

    Let’s break that down:

    • dig: The command to run the tool.
    • @<DNS-SERVER-IP>: The @ symbol tells dig, “direct your question to this specific server.” Replace <DNS-SERVER-IP> with the IP address of the server you want to query, such as @8.8.8.8 for Google.
    • <WEBSITE-TO-LOOKUP>: The domain name you want the IP address for, such as runcloud.io.

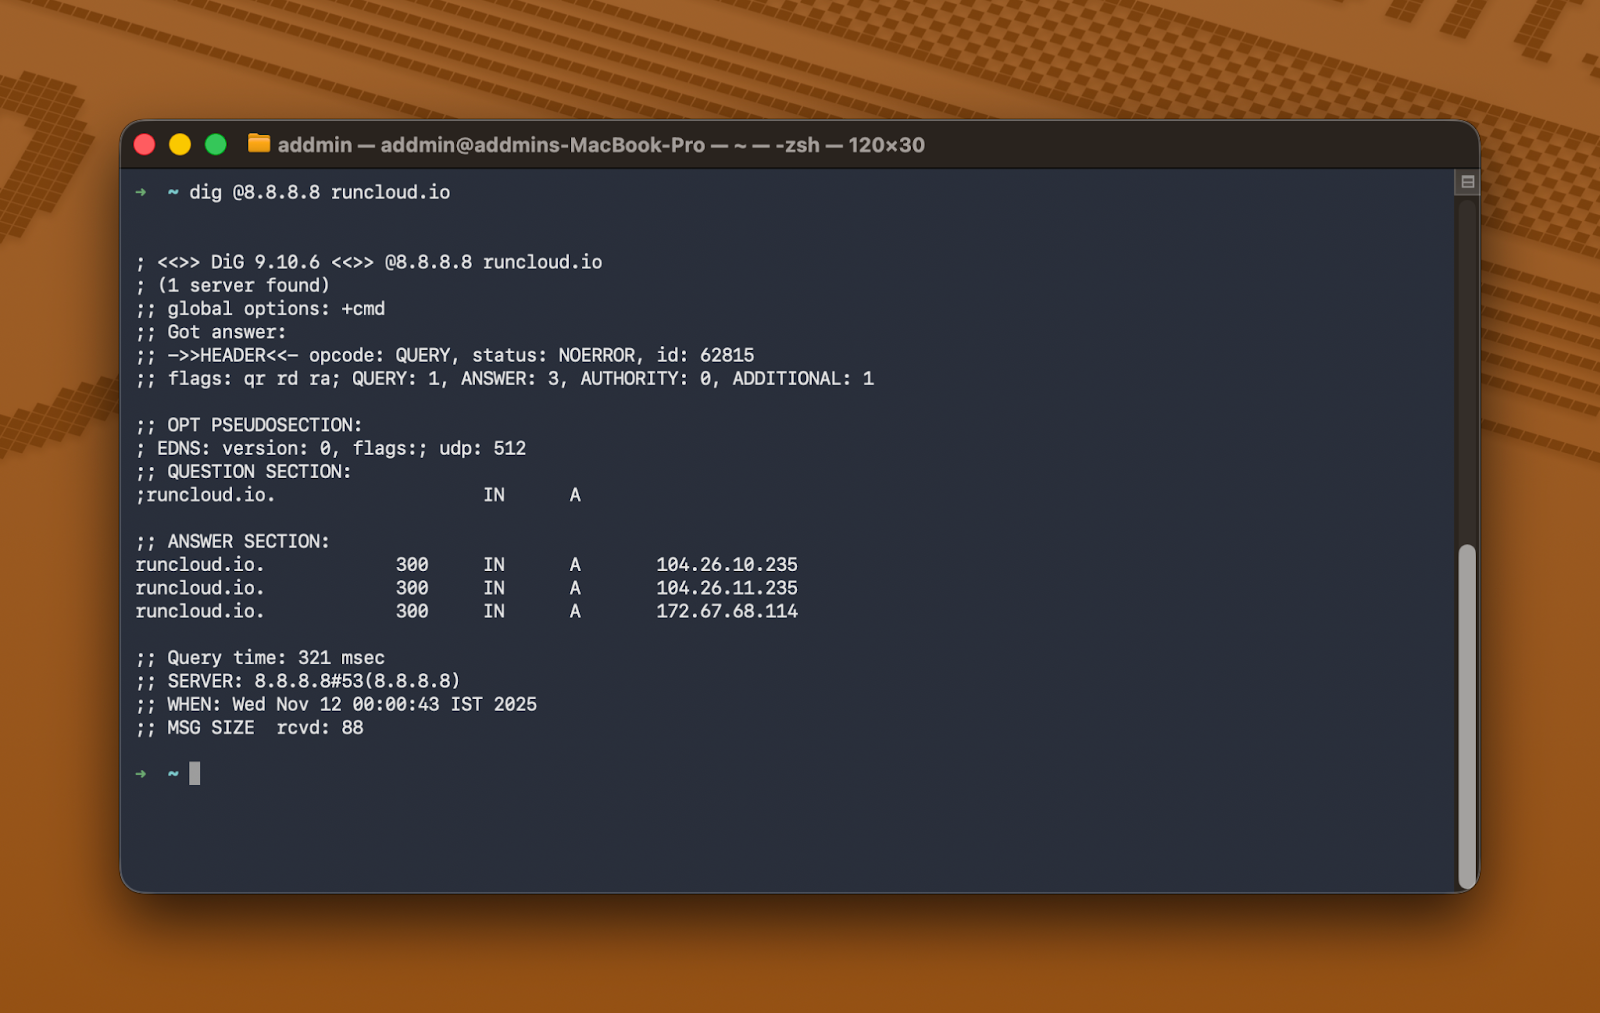
    Let’s ask Google’s public DNS server (8.8.8.8) for the IP address of runcloud.io. Open your terminal and run this command:

    dig @8.8.8.8 runcloud.io

    The terminal will print a block of text that might look a little intimidating at first, but don’t worry! You only need to concern yourself with one specific part.

    Scroll down until you find the ;; ANSWER SECTION:. This is the response from the DNS server

    runcloud.io.                300        IN        A        104.26.10.235
    runcloud.io. 300 IN A 104.26.11.235
    runcloud.io. 300 IN A 172.67.68.114

    This tells us that, according to Google’s DNS, runcloud.io has three IP addresses: 104.26.10.235, 104.26.11.235, and 172.67.68.114. It’s that simple!

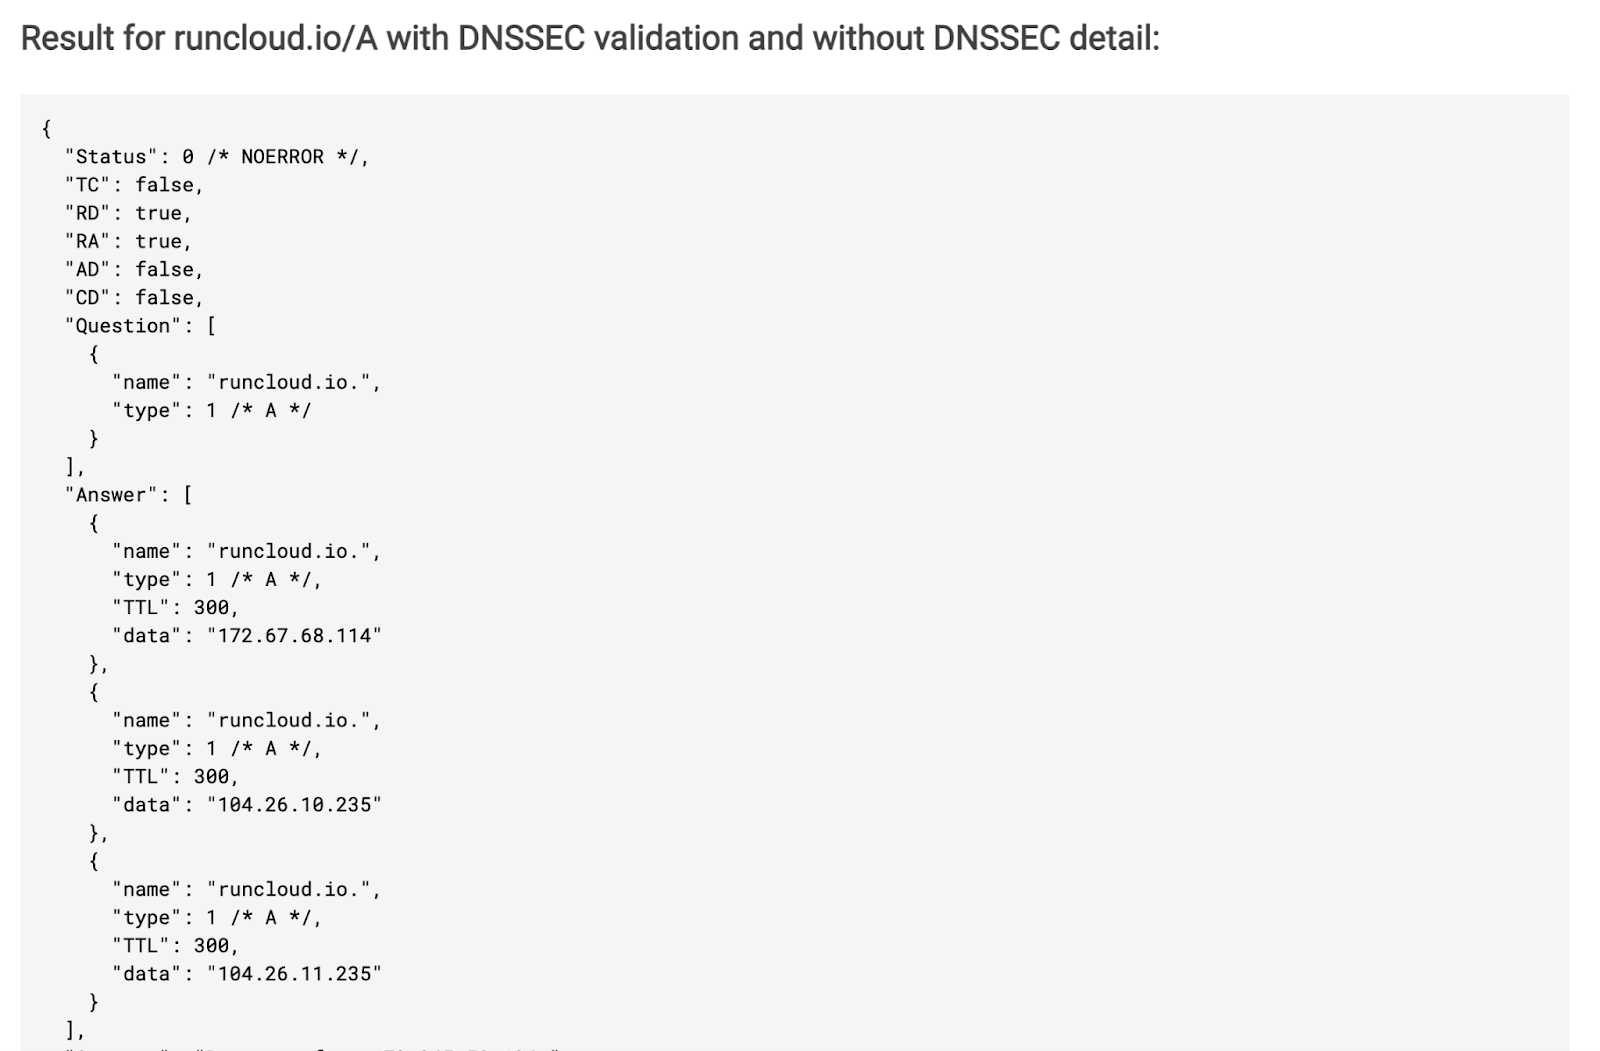
    If you prefer a graphical interface, Google offers a simple web tool that performs the same function. You can visit https://dns.google/ to see the same query we just ran, but in your browser.

    This will display the raw DNS information in a format that computers prefer (called JSON), making it easy to spot the IP address in the “data” field. It’s a great alternative if you’re not in front of a terminal.

    When Applications Bypass Your System DNS

    The IP address you found using the methods above is the default DNS server for your system. However, it’s essential to note that some applications may opt to disregard it and use their own. Before you spend hours troubleshooting, be aware of these common overrides:

    • DNS-over-HTTPS (DoH): Modern browsers can use DNS-over-HTTPS, which bypasses your system DNS for privacy. VPNs also override DNS to keep traffic secure.
    • Virtual Private Networks (VPNs): When you connect to a VPN, it almost always forces your computer to use its own private DNS servers. This is a critical security feature. If your computer uses your regular DNS while connected to a VPN, your internet service provider may still be able to see which websites you’re trying to visit, defeating a key purpose of the VPN.

    Next Steps for DNS Management

    You now know how to check your DNS server from both the terminal and GNOME, as well as how to test any DNS provider using the dig command.

    DNS checks are only one part of managing a server. RunCloud provides an easy and reliable way to deploy and manage Linux servers without manual configuration. It handles security, updates, monitoring, and performance tuning, so you can focus on your applications.

    If you want a simpler way to manage Linux servers and avoid repetitive configuration work, RunCloud gives you a clean dashboard for deployments, updates, backups, and security.

    Create your FREE RunCloud account and streamline your server workflow today.

    FAQs

    How do I check which DNS server my Linux system is using?

    You can check your active DNS servers by running the resolvectl status command. 

    Why does /etc/resolv.conf show 127.0.0.53 instead of my real DNS?

    The IP address 127.0.0.53 indicates that your system is using a local DNS stub listener managed by systemd-resolved. This local service acts as an intermediary, receiving your queries and forwarding them to the actual upstream DNS servers, which you can identify using the resolvectl status command.

    How do I set DNS to 8.8.8.8 in Linux?

    You can set your DNS to Google’s public DNS by running nmcli connection modify [connection-name] ipv4.dns “8.8.8.8”. For persistent changes on Ubuntu servers, you must add 8.8.8.8 to the nameservers section of your configuration file in /etc/netplan/ and run sudo netplan apply.

  • Linux Server Hardening: 11 Steps to Secure a Production VPS

    Linux Server Hardening: 11 Steps to Secure a Production VPS

    Almost as soon as you deploy a server on the internet, it is under attack.

    Within seconds, automated bots begin scanning your ports and hammering your SSH login. If you’re using the default settings on your server, then you are more likely to get compromised.

    While most cloud providers offer a clean slate, those default configurations are built for convenience, not combat. To truly protect your data, you need to follow industry-standard Linux server security best practices.

    Through this guide, you will have a detailed roadmap to secure your VPS with enterprise-grade security. 

    Why a Fresh Linux VPS Is a Target for Hackers

    As soon as your cloud provider assigns a public IPv4 address to your server, the clock starts. Security researchers and malicious botnets continuously scan the entire IPv4 address space using tools such as Shodan, Censys, and Zmap.

    Honeypot data consistently shows that a new, exposed Linux server will experience its first automated SSH login attempt within 3 to 5 minutes of going live.

    If you leave default settings intact, it isn’t a matter of if you get breached, but when. If you don’t protect your server, an automated script will root your server, deploy a crypto-mining payload, and potentially leave you with a thousand-dollar cloud compute bill overnight.

    What Does the “Attack Surface” Mean?

    The “attack surface” is the exact combination of open ports, default configurations, and predictable patterns your server exposes to the internet. A fresh VPS usually has:

    • Port 22 open to the world: The universal beacon for SSH brute-force scripts.
    • Root login enabled: Giving attackers the ultimate username; they only need to guess the password.
    • Password authentication is enabled, allowing unlimited dictionary attacks against your login prompt.

    If you provision your servers through a control panel like RunCloud, much of this attack surface is already minimized for you. But if you are managing a bare-metal VPS yourself, run the commands below to manually lock it down.

    However, any one single measure won’t be enough to protect your server; that’s why we recommend following the “Swiss Cheese Model of Security”.

    Suggested read: 10 Security Tips to Secure VPS Server in 2025 [Ultimate Guide] 

    The Swiss Cheese Model of Security

    This model is built on the principle that security should never rely on a single control, as even the best defense has holes, or “slices” of weakness. 

    In this model, each layer of security (like disabling root login, configuring UFW, enabling Fail2Ban, etc.) is represented by a slice of Swiss cheese. Each slice has holes representing vulnerabilities, misconfigurations, or human error.

    • A single slice (one defense) is easily penetrated if an attacker’s exploit aligns with the hole in that single layer.
    • Multiple slices stacked together provide defense-in-depth. While the holes in the first slice (e.g., a custom SSH port) might align with the threat, the second slice (e.g., SSH key authentication) or the third slice (e.g., Fail2Ban) is highly unlikely to have a hole in the exact same spot.
    The Swiss Cheese Model of Security for Linux Server Hardening

    By stacking all 11 steps in this guide, we can ensure that even if one defense fails, the next layer (or the layer after that) will stop the threat, preventing it from reaching your core application.

    Suggested read: 5 Ways to Fix the SSH Connection Refused Error [SOLVED] 

    How to Harden a Linux Server

    Follow the steps below to protect your Linux server on the internet:

    Step 1: Disable Root Login and Create a Sudo User

    Performing regular maintenance activities on your server as the root user is dangerous – a single typo can destroy your system.

    To protect your system, we recommend creating an unprivileged user and granting it administrative rights via sudo.

    Connect to your VPS as root, then run:

    # Replace 'sysadmin' with your preferred username
    adduser sysadmin

    You will be prompted to set a password. Make it strong, even though we will disable password logins shortly. Skip the contact information prompts by hitting Enter.

    Next, add your new user to the sudo group so you can execute administrative commands:

    usermod -aG sudo sysadmin

    Verify it works before logging out. Switch to your new user and test sudo:

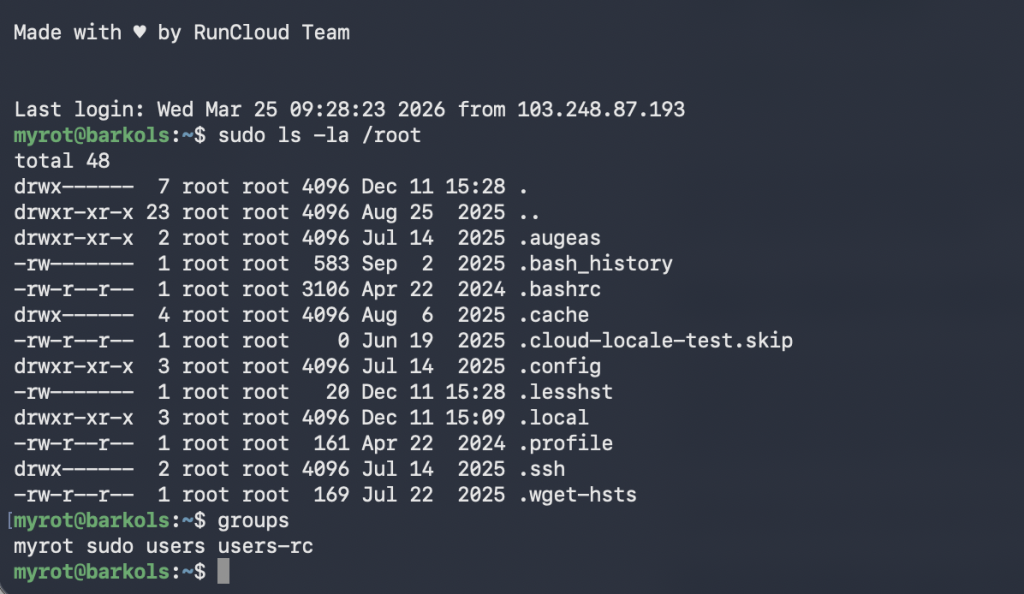
    su - sysadmin
    sudo ls -la /root

    If you are prompted for your password and can successfully see the contents of the root directory, your sudo user is ready.

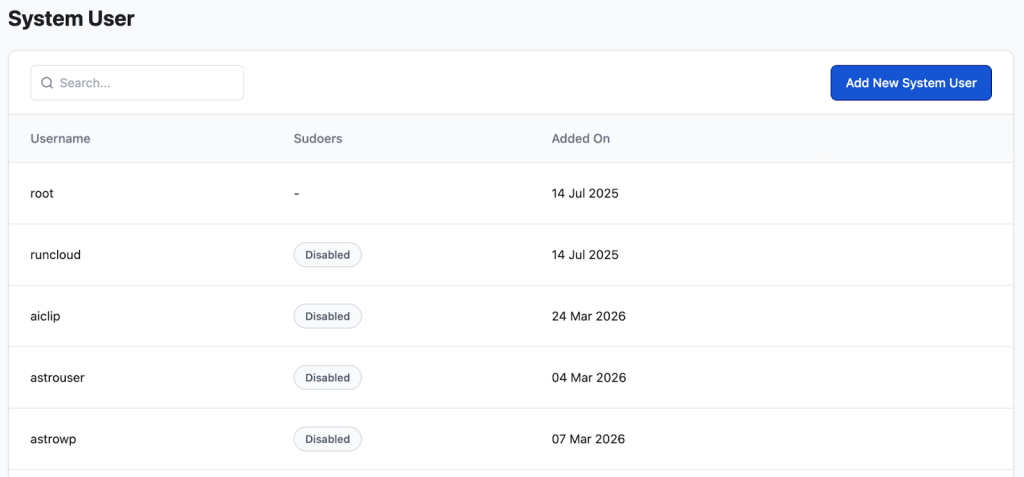
    With RunCloud, you can manage users and permissions for your Linux server directly from the web dashboard, without SSHing into the server. 

    Step 2: Switch to SSH Key Authentication and Disable Password Login

    A secure password is hard to remember, and a weak password can be cracked immediately. That’s why all cybersecurity experts agree that cryptographic keys are a better replacement for your username/password based logins.

    In this step, we are going to replace password authentication with an ed25519 SSH key pair (which is faster and more secure than older RSA keys).

    Generate your key pair locally

    Do not run this on your VPS. Open a new terminal on your local computer (your Mac, Windows, or local Linux machine):

    ssh-keygen -t ed25519 -C "your_email@example.com"

    Hit Enter to save the key to the default location (~/.ssh/id_ed25519). When prompted, you can set a strong passphrase to encrypt the key on your local disk or leave it blank if you don’t want to encrypt it.

    Copy the public key and lock down the sshd_config

    Still on your local computer, copy the public key to your VPS, targeting your new sudo user:

    ssh-copy-id sysadmin@YOUR_VPS_IP

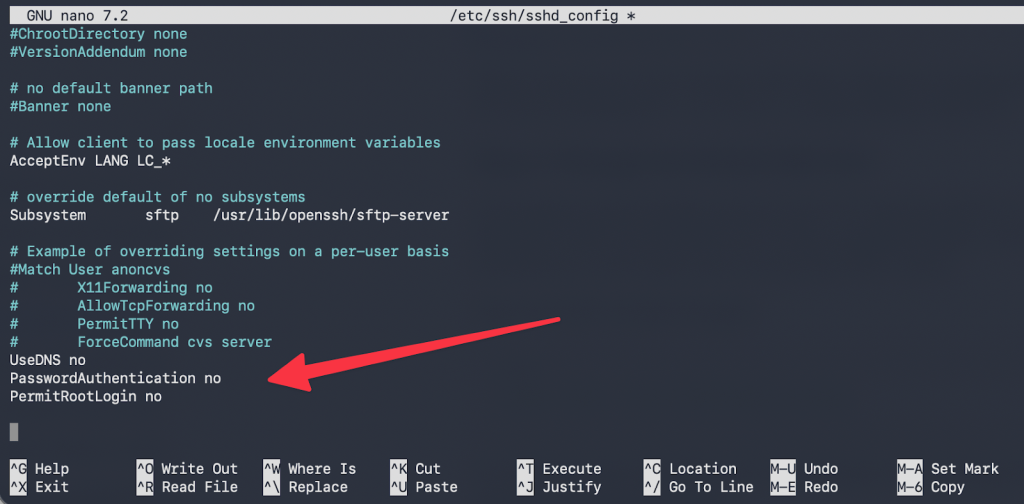
    Now, go back to the terminal window connected to your VPS. It’s time to edit the SSH daemon configuration to disable password logins and root access permanently.

    sudo nano /etc/ssh/sshd_config

    Find the following lines, uncomment them (remove the #), and change their values to match these exactly:

    PermitRootLogin no
    PasswordAuthentication no
    PubkeyAuthentication yes

    Save and exit (CTRL+O, Enter, CTRL+X). Do not restart the SSH service just yet; we are going to change the port in the next step.

    Note: RunCloud users can add SSH keys to their servers simply by pasting their public key into the RunCloud dashboard, no nano or config editing required.

    Step 3: Change the Default SSH Port

    Most automated scripts scan for and try to exploit port 22. Moving SSH to a non-standard high port (between 1024 and 65535) won’t stop a targeted attack, but it drops botnet noise by 99%, keeping your auth logs clean and saving CPU cycles.

    Open the SSH config file again:

    sudo nano /etc/ssh/sshd_config

    Find the line that says #Port 22. Uncomment it and change it to your desired port. For this example, we will use 52222:

    Port 52222

    Save and exit.

    Warning: DO NOT restart SSH until we configure the firewall in Step 4, or you will permanently lock yourself out.

    Step 4: Configure UFW to Allow Only What You Need

    Ubuntu and Debian servers use UFW (Uncomplicated Firewall) to manage network connections. To protect your server, we recommend setting a default-deny policy for incoming traffic, allowing outgoing traffic, and explicitly opening only the ports we need.

    Run the following commands on your VPS:

    # Deny all incoming traffic by default
    sudo ufw default deny incoming
    
    
    # Allow all outgoing traffic by default
    sudo ufw default allow outgoing
    
    
    # Allow your NEW custom SSH port (crucial!)
    sudo ufw allow 52222/tcp
    
    
    # Allow HTTP and HTTPS if you are hosting web apps
    sudo ufw allow 80/tcp
    sudo ufw allow 443/tcp

    Review your staged rules:

    sudo ufw show added

    If everything looks correct, you can enable the firewall by running the following command:

    sudo ufw enable

    Once the firewall is enabled, any new traffic entering or leaving your server will be inspected and filtered according to the rules we configured above. If any application has already established a connection, it won’t be terminated, but if the application attempts to establish a new connection, it will be blocked by the firewall. 

    Now that the firewall allows traffic on your custom port, we can safely apply the SSH changes by running the following command:

    sudo systemctl restart ssh

    Testing phase: DO NOT CLOSE your current terminal session. Open a new terminal on your local machine and test your new setup:

    ssh -p 52222 sysadmin@YOUR_VPS_IP

    If you successfully connect using your SSH key, you can close the original root session.

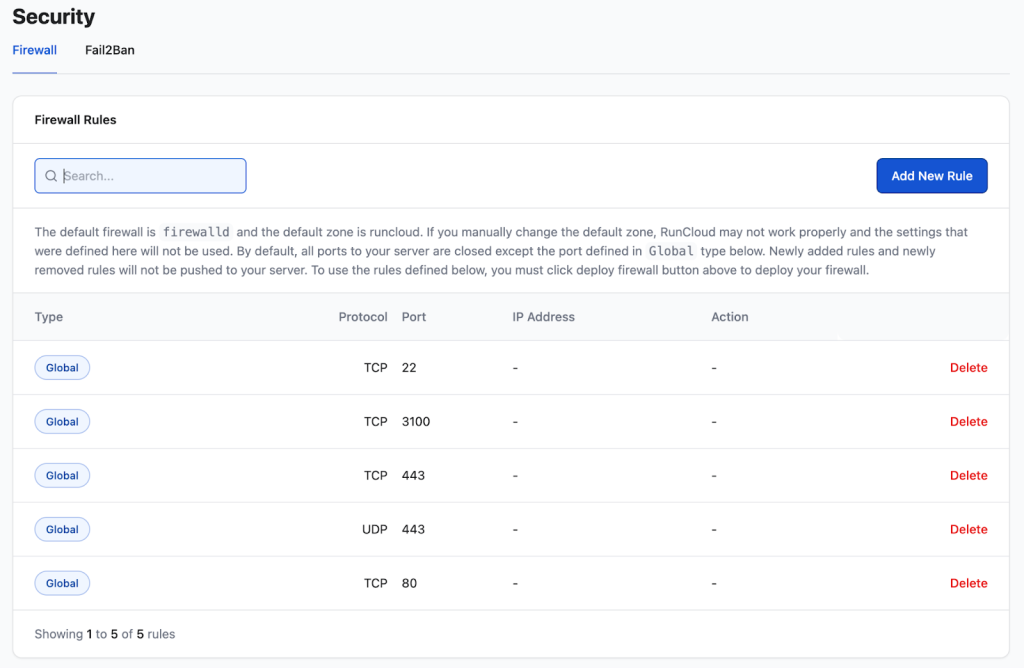
    Note: If configuring firewalls over CLI makes you nervous, RunCloud’s Firewall Manager lets you set, preview, and deploy port rules and IP whitelists directly from the dashboard without touching the terminal.

    Suggested read: Enable Zero-Trust SSH with Cloudflare on Windows, Mac, Linux, and ChromeOS 

    Step 5: Install Fail2Ban to Block Brute-Force Attacks

    Now that we have changed the SSH port and disabled password authentication, the server is relatively secure, but automated bots will still try to break in by sending random login attempts with incorrect credentials.

    Fail2Ban monitors your log files and dynamically updates your firewall to block IP addresses that show malicious behavior.

    To configure this on your Linux server, you can install the Fail2Ban package using the following command:

    sudo apt update && sudo apt install fail2ban -y

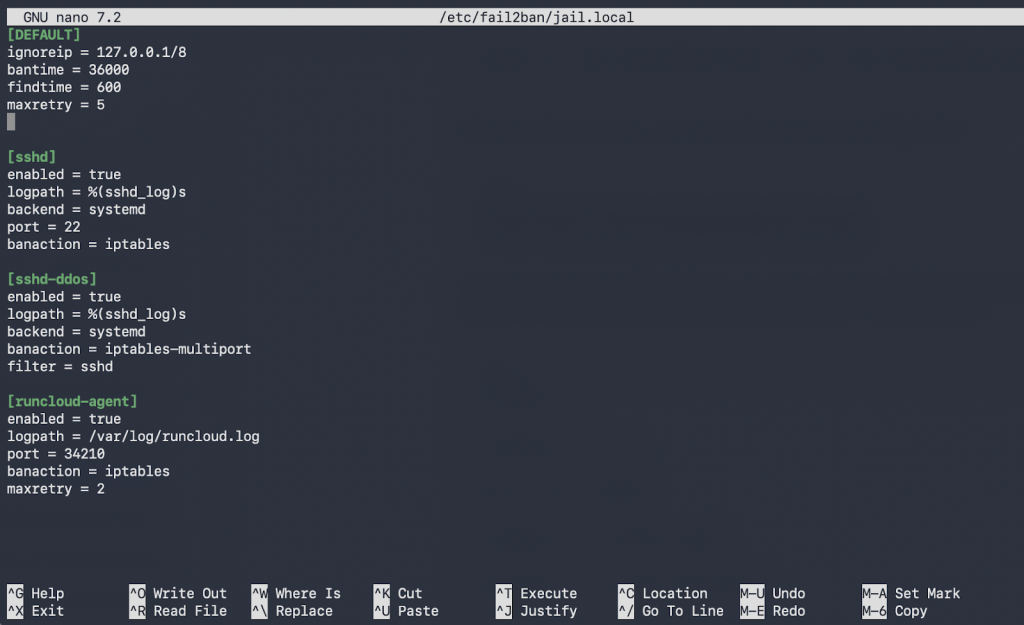
    After installing it, you need to create a set of rules (called “jails”) for your server. We strongly recommend that you don’t edit the default jail.conf file, as package updates will overwrite it. Instead, you should copy it to create a new file called jail.local. You can do this on a Linux server using the following command:

    sudo cp /etc/fail2ban/jail.conf /etc/fail2ban/jail.local

    After creating the file, you can edit your local configuration:

    sudo nano /etc/fail2ban/jail.local

    Scroll down to the [sshd] block. You need to tell Fail2Ban that you are using a custom port, and explicitly enable the jail. Modify the block to look like this:

    [sshd]
    enabled = true
    port    = 52222
    logpath = %(sshd_log)s
    backend = %(sshd_backend)s
    maxretry = 3
    bantime = 1h

    Run the following commands to save and exit, then start and enable the service:

    sudo systemctl enable fail2ban
    sudo systemctl restart fail2ban

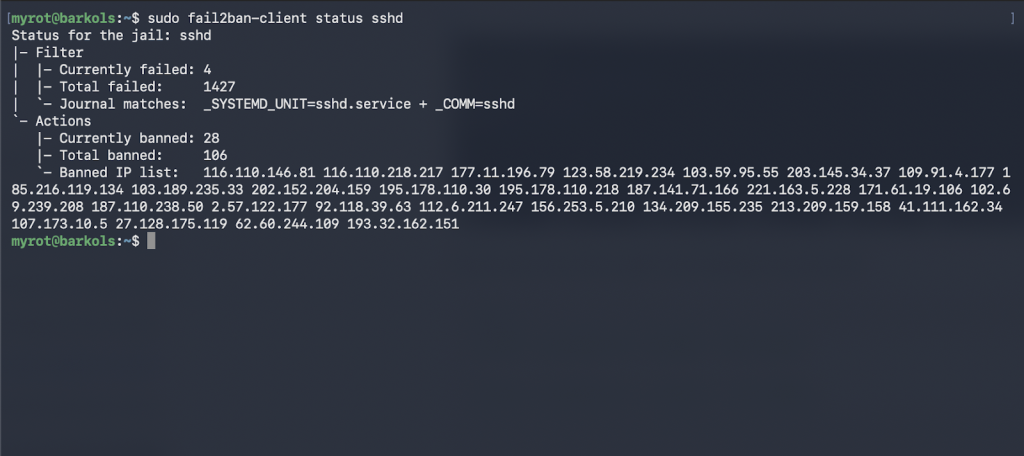
    After creating the service, you can verify that your SSH jail is active using the following command:

    sudo fail2ban-client status sshd

    In the screenshot above, we can see the list of IP addresses that Fail2Ban has banned from accessing our server.

    By completing these 5 steps, you have eliminated the low-hanging fruit that compromises 95% of fresh Linux setups. 

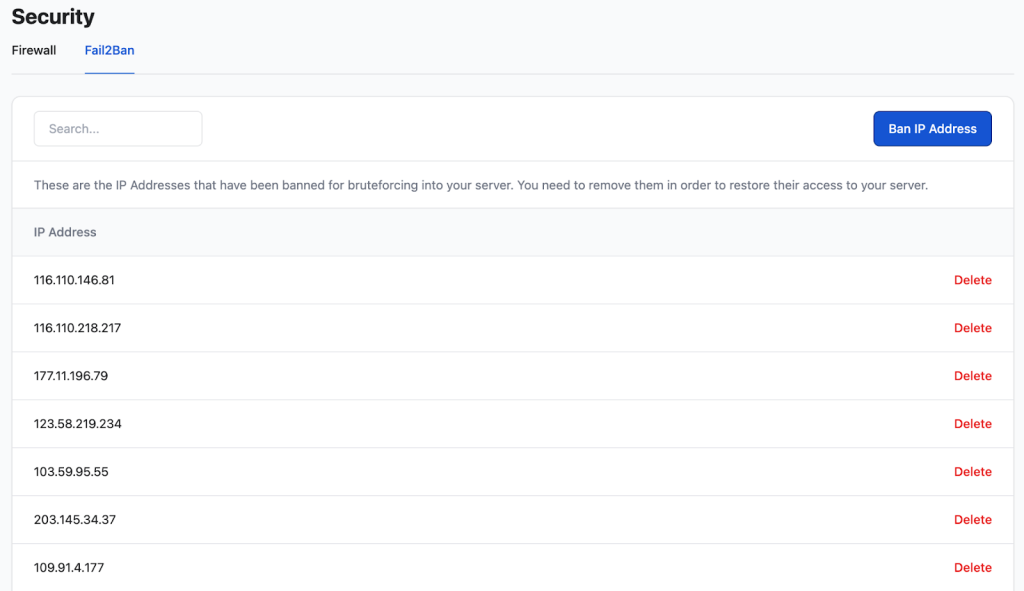
    Note: Getting Fail2Ban thresholds wrong in jail.local often results in banning yourself or failing to trigger on real attacks. That’s why RunCloud ships with Fail2Ban pre-configured for web and SSH traffic. 

    Suggested read: How to Use Cloudflare Firewall Rules to Protect Your Web Application 

    Step 6: Enable Automatic Security Updates

    A hardened server is only secure until the next CVE is published. If you are managing more than one server, you should not want to manually run apt upgrade whenever a vulnerability is discovered in OpenSSL or your kernel. Enable unattended-upgrades to automatically install critical security patches in the background.

    To do this, first you need to install the necessary packages using the following command:

    sudo apt update && sudo apt install unattended-upgrades apt-listchanges -y

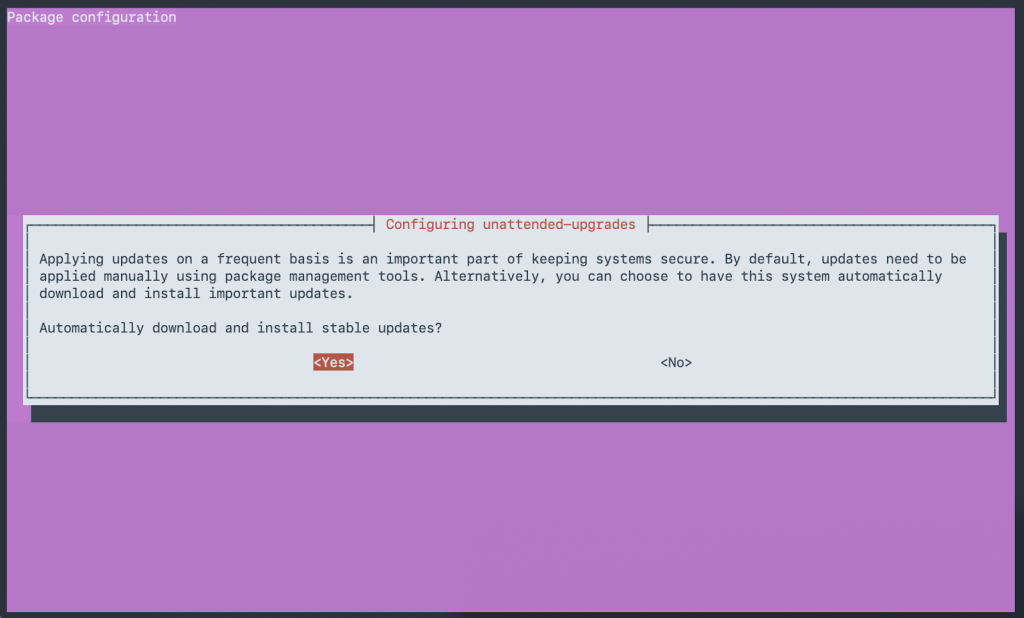
    After installing the services, you can enable the service via the interactive prompt:

    sudo dpkg-reconfigure -plow unattended-upgrades

    Select Yes when prompted to automatically download and install stable updates.

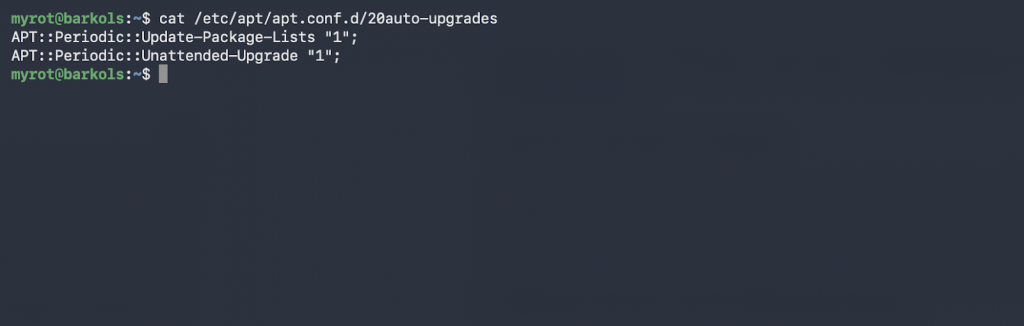
    After configuring it, check the configuration file to verify that it has been activated successfully using the following command:

    cat /etc/apt/apt.conf.d/20auto-upgrades

    When you run the above command, you should see APT::Periodic::Unattended-Upgrade "1"; in the output.

    Step 7: Remove Unused Packages and Disable Unnecessary Services

    Every service running on your server is a potential entry point for hackers. If you aren’t using a service or application, you can turn it off to protect your server and conserve resources.

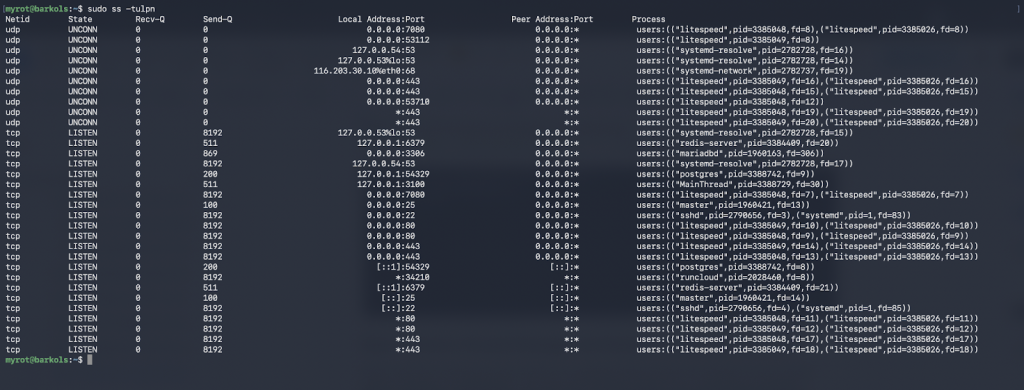
    To do this, first, we will audit what is actively listening on your server’s network interfaces by using the following command:

    sudo ss -tulpn

    If you see any services that you don’t want, then you can stop and disable them so they don’t start on reboot:

    sudo systemctl stop <name>
    sudo systemctl disable <name>

    In the above commands, replace the <name> with the actual name of the service that you want to disable. 

    Next, purge any orphaned packages and dependencies that came pre-installed on your provider’s OS image but which aren’t needed anymore:

    sudo apt autoremove --purge -y

    Step 8: Harden Kernel Parameters with sysctl

    By default, the Linux kernel uses networking parameters optimized for broad compatibility rather than strict security. When you deploy your server on the internet, it will be constantly bombarded with hundreds of attacks that try to exploit these compatibility features. 

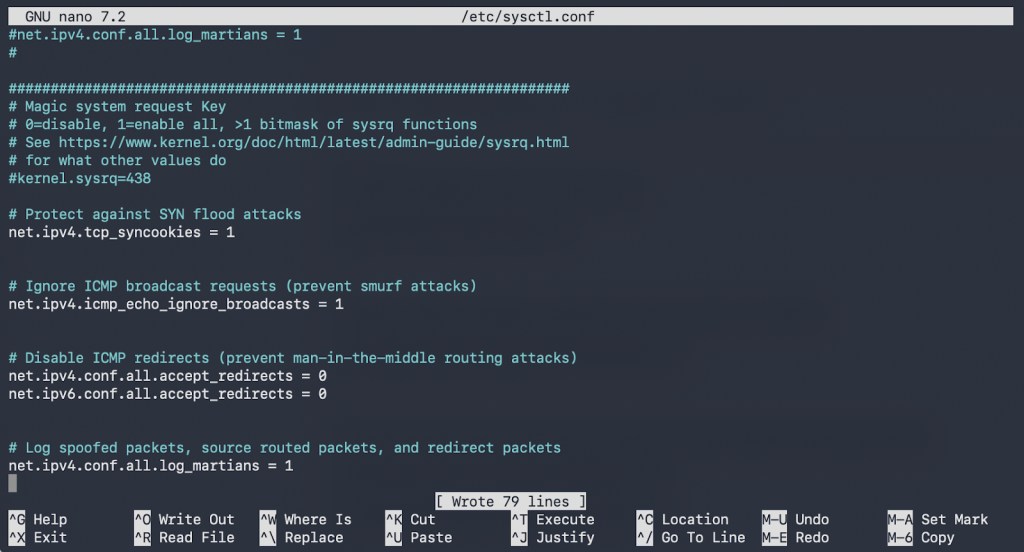
    But you can mitigate several types of network attacks (like SYN floods and IP spoofing) by tweaking sysctl.conf. To do this, you can open the configuration file using the following command:

    sudo nano /etc/sysctl.conf

    In this file, we will disable certain features by appending the following lines to the bottom of the file:

    # Protect against SYN flood attacks
    net.ipv4.tcp_syncookies = 1
    
    
    # Ignore ICMP broadcast requests (prevent smurf attacks)
    net.ipv4.icmp_echo_ignore_broadcasts = 1
    
    
    # Disable ICMP redirects (prevent man-in-the-middle routing attacks)
    net.ipv4.conf.all.accept_redirects = 0
    net.ipv6.conf.all.accept_redirects = 0
    
    
    # Log spoofed packets, source routed packets, and redirect packets
    net.ipv4.conf.all.log_martians = 1

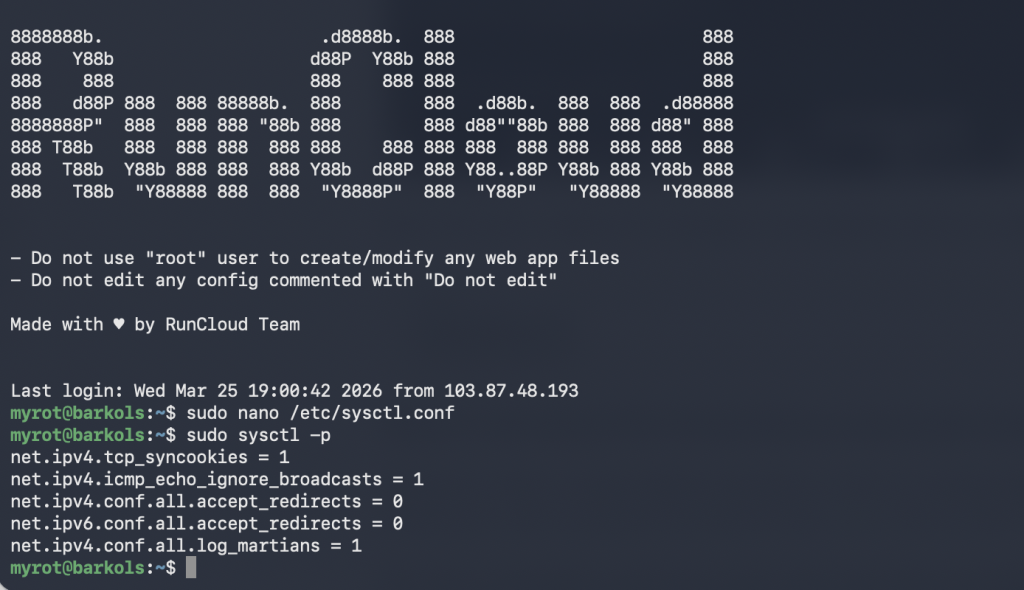
    After editing the file, you can save and exit the file editor (CTRL+O, Enter, CTRL+X). After that, you can apply the changes immediately without rebooting by running the following command:

    sudo sysctl -p

    Suggested read: 16 Best Linux Distros in 2025 

    Step 9: Set Strict File Permissions and Audit User Accounts

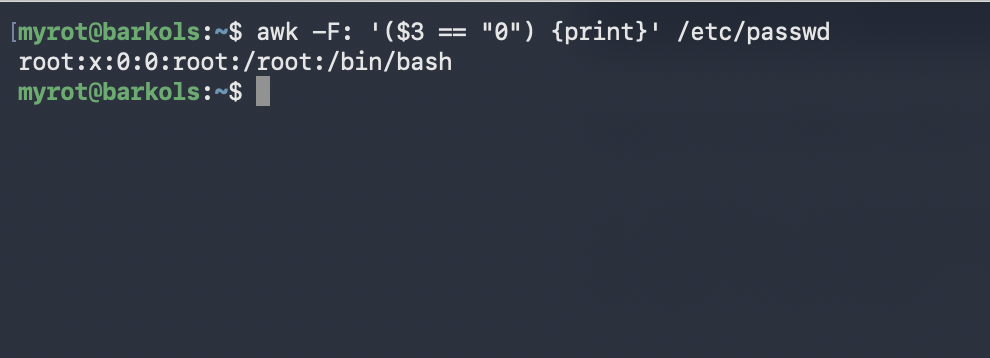
    If an attacker compromises a system, they will try to either create hidden backdoor users, or leave files with wide-open permissions. There are several steps you can take to ensure this isn’t the case on your server. First, you can audit your user accounts to ensure only root has a User ID (UID) of 0. Run this command to print any user with root-level privileges:

    awk -F: '($3 == "0") {print}' /etc/passwd

    This should output exactly one line: root:x:0:0:root:/root:/bin/bash. If you see any other user here, then it is possible that your server is compromised.

    Next, verify that no users have empty passwords:

    sudo awk -F: '($2 == "") {print}' /etc/shadow

    This should return no output.

    Finally, find and review any world-writable directories (directories anyone can write to) that don’t have the “sticky bit” set (which prevents users from deleting each other’s files):

    sudo find / -type d -perm -0002 -a ! -perm -1000 -print 2>/dev/null

    If your server is serving multiple websites, then the above command will probably return a long list of directories. You need to review this list and, if you find any rogue directories, investigate them immediately and restrict their permissions using chmod 755.

    Step 10: Review Mandatory Access Control (AppArmor and SELinux)

    AppArmor (on Ubuntu/Debian) and SELinux (on RHEL/AlmaLinux) are Mandatory Access Control (MAC) systems. They act as a high-level security guard built directly into the Linux kernel. While standard file permissions (chmod) control who can see a file, MAC systems control which specific programs are allowed to do what.

    In a standard setup, if a hacker exploits a vulnerability in a web server such as NGINX and gains “root” access, they can theoretically access every file on your server.

    With AppArmor or SELinux active, the program is confined to a “sandbox.” Even if NGINX is compromised, the MAC system detects that NGINX is attempting to access sensitive system files (such as/etc/shadow) or execute unauthorized commands. Because that behavior isn’t in the program’s predefined “security profile,” the kernel blocks the action instantly, even if the attacker has root privileges. It effectively limits the “blast radius” of any potential hack.

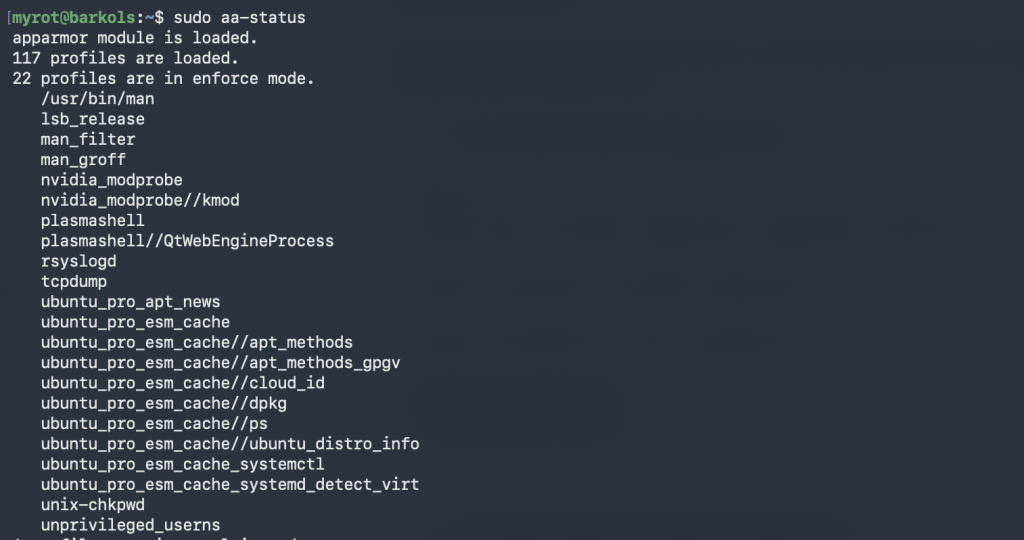
    You can run the following commands to check the configuration of these systems on your server:

    • On Ubuntu/Debian (AppArmor):
    sudo aa-status
    • On RHEL/Alma/Rocky:
    sestatus

    Manually configuring MAC systems is tricky, and beyond the scope of this article. It requires writing deep-level security profiles that define every single file, port, and network socket a program is allowed to touch. One small mistake in a profile can cause your database to crash or prevent your website from loading, leading to hours of frustrating troubleshooting.

    The good news is that if you are using RunCloud, you don’t need to lift a finger.

    RunCloud servers are engineered to be secure out of the box. The platform automatically configures and optimizes these security layers during server provisioning. Your server is hardened the moment it connects to the RunCloud panel, allowing you to focus on your applications while RunCloud handles the complex kernel security in the background.

    Step 11: Configure Off-Server Backups

    Hardening your server reduces the risk of a hack, but it cannot protect you against hardware failure, a data center fire, or an accidental rm -rf / command. Off-server backups ensure that even if your entire VPS is deleted, your business can be restored in minutes.

    There are several ways to handle backups, each with its own pros and cons:

    1. Disk-Level Snapshots: Taking a full image of your server via your provider (like DigitalOcean or AWS). These are easy but often expensive, and they’re hard to move between providers.
    2. Application Plugins: Using WordPress plugins like UpdraftPlus. These are user-friendly, but they can slow down your site because they use your server’s PHP resources to compress files.
    3. Manual Scripting: Using Linux tools to manually move data. If you choose to do this manually, you must manage three distinct parts: the database, the files, and the transport. 
      • Security: Manual rclone or script configs often store your Cloud API keys or Database passwords in plaintext on the server. If a hacker gets in, they now have your backup keys too.
      • Resource-Heavy: Compressing large folders (tar) and dumping databases every night causes high CPU and Disk I/O spikes, which can make your website sluggish during the backup window.
      • Reliability: If the script fails, you won’t know until you try to restore and find out that the files are empty.

    If you are using RunCloud, you don’t need to deal with any of this.

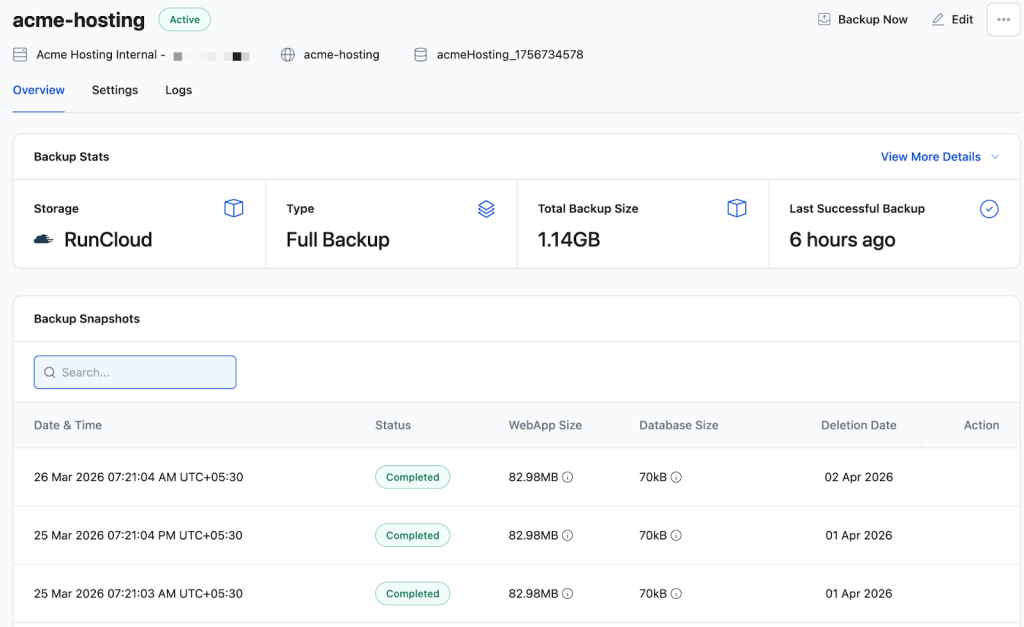
    RunCloud uses Incremental Backups, which is a far superior technology. Instead of zipping your entire site every night (which is slow and uses a lot of disk space), RunCloud only identifies the specific data that changed – and syncs just that.

    • Fast & Efficient: Because it only moves “changes,” backups finish in seconds rather than minutes.
    • Zero Resource Lag: It doesn’t put a heavy load on your server, keeping your website fast even during a backup.
    • Encrypted & Secure: Your S3 or Backblaze credentials are stored in RunCloud’s encrypted vault.
    • Backup Notifications: You can configure the Backup script to notify you via Slack/Email/Discord if the backup fails for any reason.
    • One-Click Restore: If something goes wrong, you don’t have to remember complex Linux commands. You just click “Restore” in the dashboard, and RunCloud puts everything back exactly where it belongs.
    Runcloud automated backups

    After Action Report

    If you have followed all the steps in this article, your server is now locked down and can withstand a variety of internet attacks. But a hardened server isn’t very useful if it doesn’t host anything. The next step is installing your web stack (NGINX/Apache, PHP, MySQL) and provisioning SSL certificates.

    Doing this manually means diving right back into the terminal. After hardening, managing NGINX, PHP-FPM, and SSL still requires SSH for every single configuration change, virtual host creation, and certificate renewal.

    RunCloud manages your NGINX configuration, PHP-FPM tuning, and Let’s Encrypt SSL deployments entirely from a UI, while fully respecting the hardened SSH and firewall configurations you just put in place. 

    While RunCloud simplifies complex server management tasks, it is designed for developers, agencies, and power users who need more than just a basic cPanel replacement. Once your servers are hardened, RunCloud enables you to scale your operations by offering tools for advanced management:

    • Multi-Server Management: Easily oversee, update, and manage dozens or hundreds of hardened Linux servers from a single dashboard.
    • Team & Role-Based Permissions: Delegate server access to team members or clients without sharing SSH keys or root passwords, thanks to granular control over who can manage applications, databases, or backups.
    • API-Driven Control: Integrate server and application management into your custom workflows using the RunCloud API, allowing for automated server provisioning and deployment.

    Start using RunCloud today.

    Frequently Asked Questions

    What is Linux server hardening?

    Linux server hardening is the process of reducing a system’s attack surface by patching vulnerabilities, disabling unused services, and implementing strict access controls. Common hardening steps include disabling root SSH access, configuring firewalls like UFW, and enforcing cryptographic key-based authentication.

    How long does it take to harden a Linux server?

    Manually executing a basic Linux hardening checklist on a fresh VPS typically takes an experienced sysadmin about 30 minutes. However, advanced hardening procedures like configuring SELinux, setting up intrusion detection systems, and passing compliance audits can take several hours to properly tune. 

    Should I run hardening on an existing server or only on fresh ones?

    You should ideally harden a fresh Linux server before it is ever exposed to public internet traffic or connected to your production application stack. Applying strict firewall rules, altering permissions, and modifying SSH configurations on an existing server carries a high risk of breaking active application dependencies or accidentally locking yourself out. If you must harden an existing production server, thoroughly test the new security policies in a staging environment and ensure you have recent, verified off-site backups first.

    Does changing the SSH port actually improve security?

    Changing the default SSH port from 22 to a non-standard high port is a security-through-obscurity tactic that will not stop a determined, targeted attacker running a full port scan. However, it is still highly recommended because it drops automated botnet brute-force attempts by over 99 percent. This drastically cleans up your system authentication logs, reduces wasted CPU cycles, and prevents tools like Fail2Ban from being overwhelmed by background internet noise.

  • How to Check Linux CPU Usage or Utilization (5 Ways)

    How to Check Linux CPU Usage or Utilization (5 Ways)

    Is your Linux server slowing down? CPU usage is often the reason.

    Monitoring CPU performance helps you spot issues early, prevent slowdowns, and optimize your server for smoother performance.

    This guide walks you through practical ways to check CPU usage in Linux – from essential commands like top and mpstat to visual monitoring with RunCloud.

    Let’s dive right in!

    What Causes High CPU Utilization?

    If you have been running your server for a long time, several services might be running on it. Short CPU spikes are normal during heavy tasks like database queries or backups.

    But constant high CPU usage usually means a deeper issue – such as inefficient code, unoptimized plugins, or too many concurrent PHP or Python processes.

    Poor caching and malware (like cryptominers) can also push CPU utilization to dangerous levels.

    Content management systems such as WordPress might also strain the CPU when plugins or themes are poorly coded or when caching isn’t properly implemented.

    Malicious activities can also significantly increase CPU usage. Cryptojacking malware, which hijacks system resources to mine cryptocurrency, is an increasingly common cause of high CPU utilization. Similarly, DDoS attacks or brute-force attempts can flood servers with requests, forcing the CPU to process an overwhelming amount of traffic.

    Sometimes, normal maintenance tasks can lead to temporary CPU spikes. Activities like system backups, virus scans, or package updates typically demand more processing power. However, scheduling these tasks during off-peak hours and properly configuring their resource usage can help minimize their impact on system performance.

    Detecting a Runaway Process in Linux

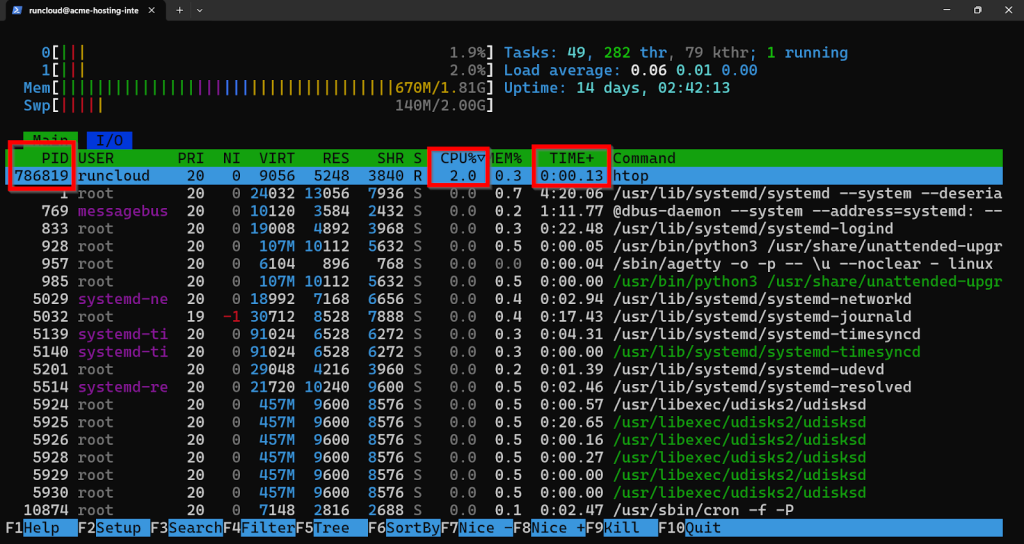
    Run top or htop and look for any process using nearly 100% CPU with a rapidly increasing TIME+ value.

    This is usually a runaway process. Stop it using its PID to free up system resources.For a runaway process, the TIME+ value will be unusually high and will increase rapidly, which indicates it is actively and continuously churning through CPU cycles without end. If you find a runaway process, then you can consider killing the process via CLI to free up system resources.

    Identifying a DoS Attack on Your Server

    If you get an abnormally high number of network connections, especially to your web ports (80 and 443), then it is a good indication that you are under attack. You can use some advanced commands like netstat -an | grep ESTABLISHED | wc -l to view a sudden and massive spike in connections.If you suspect that you are under attack, then you should go ahead and block unwanted traffic using Fail2Ban and consider implementing zero-trust logins for your applications.

    Suggested read: Best nine htop Alternatives for Linux, Mac & Windows in 2024

    How to Check High CPU Utilization on Linux?

    There are several ways to track CPU usage on your Linux system. Let’s look at a few of the most common methods.

    Method 1: Check CPU Usage with the ‘top’ Command

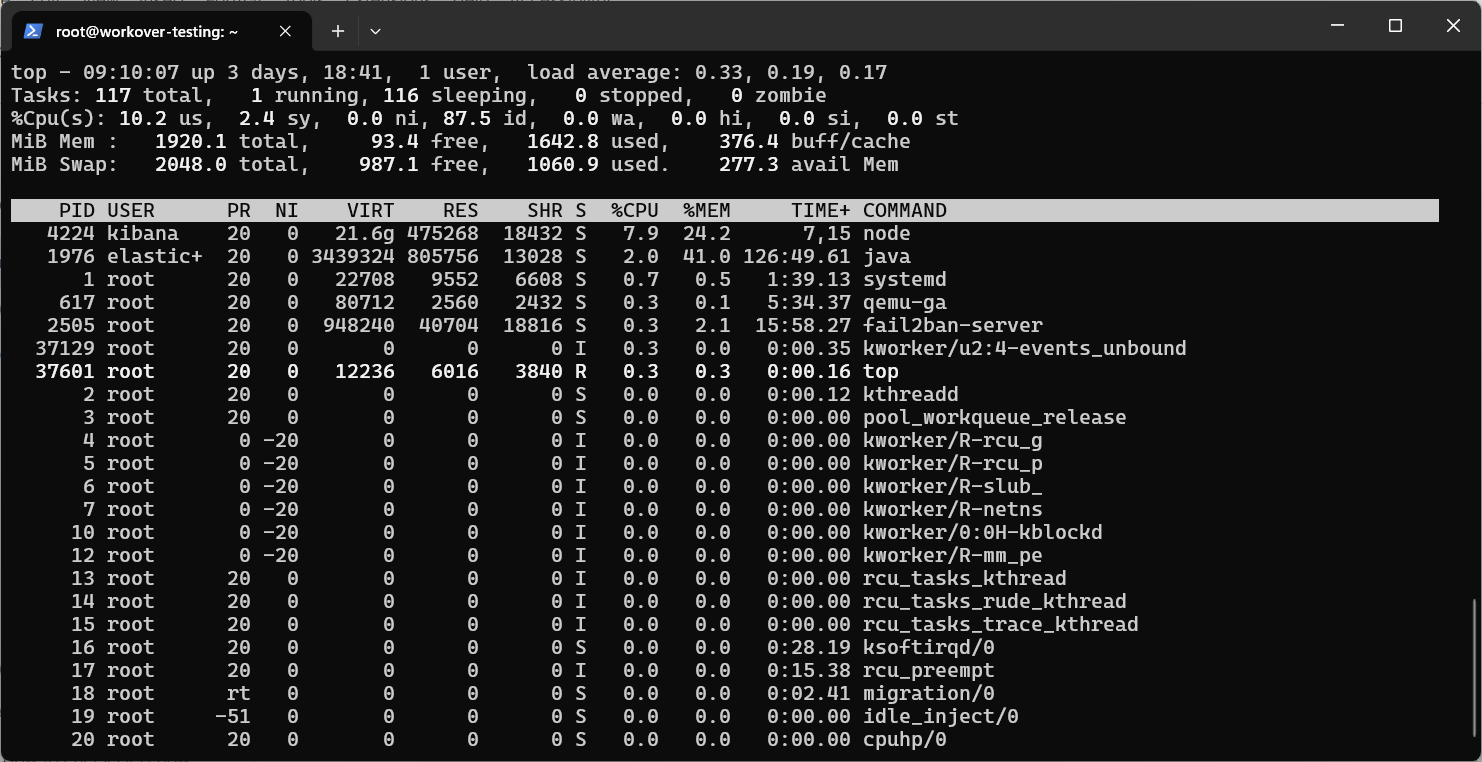
    The top command is one of the most fundamental and widely used tools for real-time system monitoring in Linux. It provides a dynamic view of system performance, showing processes sorted by CPU usage, memory consumption, and other resources. You can run it on your computer by executing the following command in your shell:

    top

    By default, the top updates every 3 seconds and displays essential information such as load averages, task statistics, and CPU states. Users can interact with the display using keyboard shortcuts, including ‘P’ to sort by CPU usage, ‘M’ for memory usage, and ‘k’ to kill processes directly from the interface.

    Suggested read: How to Check Running Processes in Linux Using ps, top, htop, and atop Commands

    Method 2: Monitor CPU Usage with the RunCloud Server Monitoring

    RunCloud has a built-in server monitoring functionality that provides a user-friendly, visual approach to tracking CPU utilization. You can view it by simply navigating to the “Monitoring” section of your server settings in the RunCloud dashboard.

    The dashboard displays historical CPU usage patterns through intuitive graphs, making it easier to identify trends and anomalies. You can also configure alerts for when CPU usage exceeds defined thresholds, and it provides detailed metrics about individual processes and system resources.

    Unlike command-line tools, RunCloud’s monitoring solution retains historical data and provides insights without requiring constant terminal access.

    In Linux systems, CPU load represents the average number of processes that are either currently executing or waiting for system resources (CPU, disk I/O, etc.) over a specific time period. Unlike CPU usage percentage, which shows immediate processor utilization, the load average gives you a broader view of system demand over time.

    A load average of 1.0 on a single-core system means the CPU is exactly at capacity, while on a quad-core system, a load of 4.0 would represent full capacity. When the load average exceeds the number of CPU cores, it indicates that processes are competing for resources and may need to wait their turn, potentially causing system slowdown.

    For example, if a quad-core system shows a load average of 8.0, it means the system is overloaded with twice as many processes as it can handle efficiently, leading to degraded performance.

    Suggested read: How to Find Most Used Disk Space Directories and Files in Linux

    Method 3: Monitor CPU Usage with the ‘mpstat’ Command

    The mpstat command is part of the sysstat package, and provides CPU statistics for each available processor. This tool is particularly valuable for multi-core systems as it shows per-processor utilization, including user time, system time, idle time, and I/O wait time. You can view your CPU usage statistics by running the following command:

    mpstat

    System administrators can use options like mpstat -P ALL 2 5 to display statistics for all processors, updating every 2 seconds for 5 iterations, helping identify potential CPU core imbalances.

    Suggested read: What are Linux Logs? What Are They & How To Use Them

    Method 4: Use the ‘sar’ Command to Check CPU Usage

    The System Activity Reporter (sar) command is a powerful tool for collecting, reporting, and storing system activity information. It can display historical CPU performance data and create detailed reports about system resource usage. The sar command can show CPU utilization data from the current day or from stored system activity files, which makes it invaluable for analyzing performance trends over time.

    You can execute the following command to see the CPU usage history on your computer:

    sar

    In the above example, we can see that each row provides a snapshot of the CPU utilization metrics in 10-minute increments. If you want to customize the output, then you can pass the appropriate flags as the input. For example, sar -u 2 5 shows CPU usage updated every 2 seconds for 5 iterations.

    Suggested read: Mastering the Echo Command in Linux (with Practical Examples)

    Method 5: Check CPU Usage with the ‘iostat’ Command

    The iostat command provides CPU statistics and input/output statistics for devices and partitions. While it is primarily known for I/O monitoring, it also offers CPU reporting capabilities, which include breakdowns of user time, system time, idle time, and I/O wait time.

    You can run the following command to view your CPU usage activity:

    iostat

    This command is particularly useful when investigating whether high CPU usage is related to disk I/O operations, and you can customize the output of this command according to your needs: options like iostat -c focus specifically on CPU statistics, while iostat -x provides extended statistics.

    Suggested read: Using Dynatrace to Monitor RunCloud Servers

    Method 6: Monitor CPU Usage with the ‘vmstat’ Command

    The Virtual Memory Statistics (vmstat) command offers a concise view of system performance, including CPU usage, memory, swap space, and I/O statistics. It’s especially useful for identifying bottlenecks affecting CPU performance, such as memory constraints or excessive swapping. You can use this command by executing the following code snippet in your terminal:

    vmstat

    You can also use some additional command-line arguments to modify its behavior. For example, running vmstat with a delay value (e.g., vmstat 2) provides continuous monitoring and shows how CPU usage changes over time. Its compact output format makes it ideal for quick system health checks and monitoring trends in real time.

    Suggested read: How To Monitor Your Web App’s RAM & CPU Usage with Netdata

    Wrapping Up

    Monitoring CPU usage helps you prevent slowdowns and keep your server running efficiently. While Linux commands like top and sar are powerful, RunCloud makes performance tracking easier with visual insights and automated alerts.

    While command-line tools are incredibly powerful for deep-dive, real-time diagnostics, they require you to be actively logged into the server via SSH. They don’t easily reveal trends over time or provide a simple “is everything okay?” status check.

    This is why RunCloud provides a Server Monitoring dashboard to get high-level oversight. RunCloud gives you a visual dashboard showing CPU, memory, and disk usage in one place.

    You can view historical data, identify spikes, and set alerts for high CPU usage – no SSH access required.

    On this screen, you can instantly assess the core vitals of your server:

    • Load: Immediately see your server’s current workload without needing to interpret the 1, 5, and 15-minute averages. 
    • Memory Usage: A simple percentage shows how much RAM is in use, letting you know if you’re approaching a memory bottleneck.
    • Disk Usage: Quickly check if you’re running out of storage space.
    • Top Processes: RunCloud automatically surfaces the most resource-intensive processes, and saves you the manual effort of scanning through the top command’s list to find the culprit behind a CPU spike.
    • Slow [Database] Queries: For web applications, this is a game-changer. RunCloud can pinpoint the exact database queries that are slowing down your entire site, a task that is notoriously difficult with standard CLI tools.
    • Automated Alerting: RunCloud can be configured to send you an alert via Slack, Telegram, or email the moment your CPU usage crosses a critical threshold (e.g., >80% for 5 minutes).

    Start your free RunCloud trial today and see your server’s performance at a glance – no command line required.

    FAQs on Linux CPU Usage

    How to check CPU power consumption in Linux?

    You can monitor CPU power consumption using tools like powertop or by reading from /sys/class/power_supply/ for battery-powered devices. For a quick check, installing and running turbostat will show detailed power and frequency statistics of your CPU.

    Why is my CPU 100% usage?

    High CPU usage typically occurs when resource-intensive processes like runaway scripts, malware, or poorly optimized applications consume excessive processing power. You can identify the culprit using top or htop commands to see which processes are consuming the most CPU resources.

    How to find CPU utilization in OS?

    The simplest way is to use the top command in the terminal, which shows real-time system statistics, including CPU usage per process. Alternatively, RunCloud’s monitoring dashboard provides an easy-to-read interface showing CPU usage trends over time.

    How do I check if my CPU is running properly?

    You can monitor CPU temperature using sensors command and check system logs (dmesg or /var/log/syslog) for any hardware-related errors or throttling messages. RunCloud’s monitoring can also alert you if CPU performance metrics deviate from normal patterns.

    How do I make sure my CPU is running at its best?

    Ensure your system is running the latest kernel version, has proper cooling, and uses tools like cpupower to manage CPU frequency scaling. Also, regularly update your BIOS and consider enabling performance mode in your CPU governor settings.

    How do I fix excessive CPU usage?

    First, identify the resource-hungry processes using top or RunCloud’s monitoring dashboard. Then, either optimize the application code, adjust configuration settings, or terminate unnecessary processes. If needed, consider implementing resource limits using groups.

    How to check how many CPU cores you have in Linux?

    You can quickly check your CPU cores by running nproc for logical core count or lscpu for detailed CPU architecture information, including physical and virtual cores. For a more detailed view, you can also read /proc/cpuinfo.

    How can I find out which specific process is causing high CPU usage?

    The quickest way to find the process is by using the top command or its more user-friendly alternative, htop, in your terminal. These tools display a live, sorted list of all running processes and automatically place the most resource-hungry ones at the very top. Simply look for the process with the highest number in the %CPU column to find the most resource hungry process.

  • How To Check Disk Space in Linux

    The fastest way to check disk space in Linux is to open your terminal and simply run the df -h command.

    However, if you are managing a Linux VPS or dedicated server, keeping your storage healthy often requires a bit more digging.

    When server storage runs out, it can trigger a cascade of critical problems:

    • Applications like your database or web server may crash because they can’t write new data
    • Essential system logs will stop recording
    • In a worst-case scenario, you could even be prevented from logging into your system entirely.

    Fortunately, managing your storage doesn’t have to be complicated. Linux comes equipped with powerful built-in tools that give you a clear picture of your disk usage so you can take action before disaster strikes.

    In this guide, you will learn several different methods to monitor and manage your drive, including how to check your overall disk usage, pinpoint exactly which directories are consuming your storage, track down the largest files, understand advanced metrics like inode usage, and take basic, actionable steps to free up disk space.

    Linux Disk Space Commands at a Glance

    Here are the most common commands to check disk space in Linux and what they do:

    CommandWhat it showsExample usage
    df -hFree and used space on all mounted filesystemsdf -h
    df -iInode usage (number of files)df -i
    du -sh <dir>Total size of a specific directorydu -sh /var/log
    du -h –max-depth=1 <dir>Sizes of top-level subdirectoriesdu -h --max-depth=1 .
    ncduInteractive, navigable disk usage viewersudo ncdu /
    ls -lhSLargest files in a directory (sorted by size)ls -lhS /var/log
    fdiskPartition tables and total physical disk capacitiessudo fdisk -l
    lsblkTree view of all block devices (disks/partitions) and mount pointslsblk
    dufModern, user-friendly, and colorized alternative to dfduf

    How to Check Linux Disk Space with the df Command

    The first and most common tool for checking disk space is the df command. This command is an abbreviation of disk free. It provides a high-level overview of the available and used space on all mounted filesystems. 

    While you can simply type df, the output shows space in 1-kilobyte blocks, which isn’t very easy to read. For a much clearer view, we’ll use the -h (human-readable) flag. To use this tool, open your terminal and run the following command:

    df -h

    You will see an output similar to this:

    Let’s break down what each column means:

    • Filesystem: This is the name of the system for the storage partition. You often see names like /dev/sda1 or /dev/vda1. These refer to the first partition on your primary hard drive. (sda is common for physical drives, while vda is often used for virtual server disks).
    • Size: The total size of the filesystem.
    • Used: The amount of space currently in use.
    • Avail: The amount of free space remaining.
    • Use%: The percentage of the disk that is full. This is the most important column to watch! If this number gets close to 100%, you may start having problems.
    • Mounted on: This is the directory in the file structure where the filesystem is accessible. The most important one is / (the “root” directory), as this is where your entire operating system and all its files are stored.

    Suggested read: How to Check Linux CPU Usage or Utilization (5 Ways)

    Useful df Options for Disk Space

    The df command has several useful options that make it easier to narrow down problems, check filesystem types, and track inode usage.

    How to Check a Specific Filesystem with df

    You can specify the path if you only care about the space in a specific directory (like your home folder). For example:

    df -h /home

    How to Show Filesystem Type in Linux

    You can use the -T flag to see the format of your filesystems (e.g., ext4, XFS). For example:

    df -hT

    How to Check Inode Usage in Linux

    Sometimes, you can run out of “inodes” before you run out of disk space. An inode is a data structure that stores information about a file. Think of it like an entry in a library’s card catalog; every file needs one. If you have millions of tiny files, you might exhaust your inodes. To check this, use the -i flag. For Example:

    df -i

    Check Disk Space with duf 

    While the standard df -h command gives you the information you need, it includes a lot of confusing “pseudo-filesystems” (like snap or tmpfs loops) and formats everything in plain text. duf automatically filters out the clutter, organizes your real hard drives into a beautiful, easy-to-read table, and uses colored output to immediately show you which drives are healthy and which are dangerously full.

    How to Install duf: Depending on your Linux distribution, you can install it using your system’s package manager.

    # For Ubuntu and Debian systems:
    sudo apt update
    sudo apt install duf
    # For CentOS, RHEL, and Fedora systems:
    sudo dnf install duf

    How to Use duf: Once installed, simply type duf and hit Enter. You don’t even need to add any extra flags!

    duf

    Suggested read: How to Check OS Version in Linux via Command Line

    How to Find What’s Using Disk Space in Linux

    Once you know a disk is nearly full, the next step is finding what’s using the space. The du (disk usage) command helps by showing the size of files and directories so you can quickly spot what’s taking up the most room.

    A simple du -h lists the size of every subdirectory, but that can be overwhelming. These options make du far more practical:

    How to Use du to Check Disk Usage

    The du command has several useful options depending on whether you need a quick summary or a detailed breakdown. Here are the most common ways to use it.

    How to Get a Summary of Directory Size with du

    The -s flag can be used to get a summary of disk usage. This command shows a single numerical value, which is the total size of the directory.

    du -sh .

    How to List Sizes of Top-Level Directories in Linux

    This is perfect for quickly breaking down which folders are the largest without digging too deep. The –max-depth=1 flag tells du to only go one level down. For example, to check the folders in the current directory, you could run:

    sudo du -h --max-depth=1

    How to Find the Largest Directories in Linux

    This is a favorite command of system administrators. It combines three tools to quickly pinpoint the biggest space hogs on your system. For example, if you want to check the ten biggest directories in the webapps directory, then you can run the following command:

    du -h ./webapps/ | sort -rh | head -n 10

    Let’s break down how this one-liner works:

    1. du -h <path>: Calculates the disk usage for every file and folder in the provided path.
    2. |: This is the “pipe.” It takes the output of the first command and sends it as the input to the next command.
    3. sort -rh: This sorts the list it receives from du. The -r flag reverses the sort to be descending (largest first), and the -h flag ensures it understands human-readable numbers (so “10G” is correctly sorted as larger than “2M”).
    4. | head -n 10: This final pipe takes the sorted list and shows only the top 10 lines.

    How to Check Attached Disks with lsblk

    The lsblk command provides a clean, tree-like overview of all block devices (such as hard drives and USB drives) attached to your system, along with their partitions. It is incredibly useful for quickly viewing your total disk capacities, device types, and structural mount points at a glance.

    While it doesn’t show free space by default, it does show each disk’s storage capacity, and adding specific output parameters makes it highly informative for hardware storage audits.

    # List all block devices with default columns
    lsblk
    # Display specific columns like name, total size, device type, and mount point
    lsblk -o NAME,SIZE,TYPE,MOUNTPOINT

    Suggested read: ARM64 vs X64 – Everything you need to know

    How to Monitor Disk Space and Set Up Automated Alerts

    You can proactively monitor your storage to prevent sudden server crashes by alerting you before your disks fill up. You can write a simple Bash script that checks whether your disk usage exceeds a set threshold (e.g., 90%) and emails you an alert, which you can then automate to run daily via a cron job.

    Open the text editor of your choice and paste the following code snippet to create a simple bash script:

    # A simple bash script (monitor.sh) to alert if root usage is over 90%
    THRESHOLD=90
    CURRENT_USAGE=$(df / | grep / | awk '{ print $5}' | sed 's/%//g')
    if [ "$CURRENT_USAGE" -gt "$THRESHOLD" ]; then
        echo "Warning: Disk usage is at ${CURRENT_USAGE}%" | mail -s "Disk Space Alert" admin@example.com
    fi

    In the above example, remember to update your email address and then save it as monitor.sh. Once the file is saved, you can create a cron job to run the script every day at midnight and notify you.

    Alternatively, if you want to skip the manual scripting entirely, consider using a modern server management panel like RunCloud, which provides built-in disk monitoring, beautiful dashboards, and automated notifications out of the box.

    How to Check Disk Space Per User in Linux

    If you are managing a multi-tenant VPS with several clients or team members, it is important to know exactly how much storage each individual account is consuming. You can quickly summarize the size of each user’s home directory using the du command with the summarize and human-readable parameters. 

    Run the following command in your terminal to calculate and display the disk space used by each user’s home directory:

    sudo du -sh /home/*

    How to Check Disk Space with fdisk -l

    The fdisk command is a popular disk manipulation tool that can be used for viewing your system’s partition tables and raw hardware capacities. It can display the total size of every attached storage drive, the sector sizes, and the exact partition boundaries. 

    This command requires root privileges and is perfect for identifying unallocated disk space or confirming the actual physical capacity of your drives before formatting.

    Run the following command to list partition tables and disk capacities for all attached devices:

    sudo fdisk -l
    # List the partition table and size for a specific disk only
    sudo fdisk -l /dev/sda

    Visual and Interactive Ways to Check Disk Space in Linux

    Commands like df and du work everywhere, but sometimes a visual tool makes it faster to understand disk usage.

    How to Use ncdu for Interactive Disk Usage in Linux

    This is a fantastic command-line tool that scans a directory and then provides an interactive, navigable list. You can use your arrow keys to drill down into folders and quickly see what’s using the most space. To install ncdu on Debian and Ubuntu-based systems, run the command sudo apt install ncdu. For CentOS and RHEL systems, you can install it using sudo yum install ncdu. Once the installation is complete, you can scan the current directory by running the command sudo ncdu .

    GUI Tools to Check Disk Space in Linux (Baobab, Filelight)

    If you are using Linux with a graphical desktop environment, you have even more intuitive options.

    • Disk Usage Analyzer (Baobab): The default tool for GNOME-based desktops like Ubuntu. It provides a visual ring chart that makes it easy to see the largest directories.
    • Filelight: A similar tool for the KDE Plasma desktop environment. This tool displays the disk usage using visual charts, which makes it easy to gather information about your filesystem at a glance.

    How to Free Up Disk Space in Linux

    After you have analyzed that your disk is getting full. The next logical step is to perform a cleanup. However, before deleting anything, it’s important to be careful. Never delete files or directories you don’t recognize, as removing the wrong thing can damage your operating system.

    Here are a few safe places to start cleaning to reclaim disk space.

    Clean the Package Manager Cache

    Package managers (like apt for Ubuntu/Debian or dnf/yum for Fedora/CentOS) download installation files and store them in a cache. After installation, these files are often no longer needed. This is usually the safest and easiest way to free up a good amount of space.

    For Debian and Ubuntu-based systems:
    These two commands will remove old installation files and any unused dependency packages:

    sudo apt clean
    sudo apt autoremove

    For Fedora, CentOS, and RHEL-based systems:
    This command will clear out all cached package data.

    sudo dnf clean all

    Or for older systems using yum:

    sudo yum clean all 

    Manage Large Log Files

    By default, the system and application logs are stored in the /var/log directory. Over time, some of these files can grow to several gigabytes.

    While you could delete a log file with rm, it’s not recommended. A running application may still be “holding” the file open, leading to issues. A safer method is to truncate the file, which empties its contents without deleting the file itself.

    To empty a large log file, use the truncate command. For example, to empty a file named large-app.log:

    sudo truncate -s 0 /var/log/large-app.log 

    This command instantly sets the file’s size to zero, freeing up the space.

    Review User and Temporary Files

    • /home Directory: This is where personal files, downloads, and documents are stored. Use the du commands covered earlier to navigate your home directory (/home/your-username) and find large files or directories that you no longer need.
    • /tmp Directory: This directory is used for temporary files. While most systems clear it on reboot, sometimes files can be left behind. It’s worth checking this directory for any old, large files that can be removed.

    Clear Old System Logs

    Your Linux system keeps detailed records of everything that happens behind the scenes. Over time, these “journal logs” can grow to take up gigabytes of space. You can safely delete logs older than a week without harming your system.

    Execute the following command on your server to delete all systemd journal logs older than 7 days:

    sudo journalctl --vacuum-time=7d

    Clean Up Docker (If you use it)

    If you run Docker containers on your server, you will quickly accumulate stopped containers, unused networks, and “dangling” images. Docker has a fantastic built-in command to wipe all of this unused data at once.

    Run the following command to remove unused Docker containers, networks, images, and build cache:

    sudo docker system prune -a

    Key Takeaways on Checking Disk Space in Linux

    Mastering command-line tools like df and du is a powerful skill that gives you direct control over your server’s health.

    You are now equipped to diagnose one of the most common server issues, a full disk, and take precise action to free up space. Understanding these fundamentals is an important step in becoming a proficient Linux user and administrator.

    Now that you understand the basics of checking and managing disk space, you can dive deeper into related commands and techniques. We recommend these guides for your next steps:

    However, manually checking your disk space isn’t always practical, and by the time you realize there’s a problem, it might already be too late.

    For those who want to move from reactive troubleshooting to proactive management, a modern server control panel is the answer.

    This is where RunCloud shines.

    RunCloud is designed to simplify every aspect of your server management workflow, including health monitoring. Instead of manually running commands, you get a clean, visual dashboard that displays your disk usage, CPU load, and memory at a glance. More importantly, you can configure alerts to be notified automatically when your disk space reaches a critical threshold, giving you plenty of time to act before it impacts your applications.

    If you’re ready to spend less time managing and more time building, take the next step.

    Sign up for RunCloud today and discover effortless server management.

    Linux Disk Space FAQs

    What is the difference between df and du in Linux?

    Think of df as your car’s fuel gauge – it shows the total space used and free. du is like the trip computer – it shows which files and folders are using the space.
    You use df to determine whether you have a problem and du to locate the problem.

    Why does df show full disk, but du shows less usage?

    This is a very common point of confusion. If df reports that a disk is 95% full but du only accounts for 85% of the space, there are usually two reasons for this:
    Reserved Space: Most Linux filesystems (like ext4) reserve a percentage of the disk (typically 5%) exclusively for the root user. This safety measure prevents essential system services from crashing if a regular user fills up 100% of the disk. df includes this reserved space in its calculation of used space, while du only sums up the actual files it can see.
    Deleted Files Held Open by a Process: In Linux, when you delete a file (e.g., a large log file), the space is not freed until the program that was using it closes the file. du will immediately stop seeing the deleted file and won’t count its size. However, df knows the space is still allocated on the disk until the process is restarted or ends. This is why it’s better to truncate active log files instead of deleting them.

    What are inodes in Linux?

    An inode is a data structure on the filesystem that stores all the information about a file except for its name and actual data. If you run out of inodes, you won’t be able to create new files or directories, even if you still have plenty of physical disk space left. This situation is most common on systems with millions of very small files, so checking inode usage with df -i is an important diagnostic step if you cannot save new files on a disk that appears to have free space.

    Is it safe to delete files in /tmp?

    Generally, it is safe to delete older files from the /tmp directory, as it is intended for temporary data that applications no longer need. However, you should avoid deleting files that are actively being used, so it’s best to remove files that haven’t been accessed in a while. The safest approach is to let the system handle it, as most Linux distributions are configured to clear the /tmp directory automatically during a reboot.

  • How to Check OS Version in Linux via Command Line

    How to Check OS Version in Linux via Command Line

    Whether you’re running Ubuntu, Arch, Debian, or any other Linux distribution, knowing how to quickly and accurately identify your OS version can be the difference between smooth operations and compatibility nightmares.

    And knowing your Linux OS version precisely is essential when troubleshooting a software installation, planning a system upgrade, or ensuring security patch compatibility.

    This straightforward guide will demystify the process of checking your Linux operating system version and provide multiple command-line techniques that work across various distributions, such as Ubuntu, CentOS, Fedora, and more.

    Understanding Linux Versions and Distributions

    Before checking your system’s version, remember that Linux comes as a “distribution” – a complete operating system built around the Linux kernel. While hundreds of different distributions are available, most systems you will encounter belong to one of two major families: Debian or Red Hat.

    For example, many servers run on distributions from the Red Hat family, such as Red Hat Enterprise Linux (RHEL) itself or others built to be compatible with it, like Rocky Linux, AlmaLinux, and CentOS Stream. On the other hand, an enormous community of developers and desktop users prefers distributions from the Debian family; the most famous is Ubuntu, which is based directly on Debian.

    This family relationship is important because software packaged for one distribution, like RHEL, will often work on its close relatives. Similarly, an application designed for Debian will usually run perfectly on Ubuntu.

    Although most Linux systems are based on these two lineages, a handful of users rely on other excellent independent distributions like Arch Linux or SUSE. Therefore, identifying your OS version is about finding the specific distribution name (e.g., Ubuntu) and its release number (e.g., 22.04), which tells you about its features and software family.

    How to Check OS Version in Linux Command Line

    There are six ways to check your Linux version via the command line. Here’s our guide to all six methods.

    1. How to Check OS Version in Linux with lsb_release

    The lsb_release -a command provides comprehensive information about your Linux distribution, including version details and codename. This command works across most Linux distributions and offers a quick, standardized way to retrieve system information.

    The lsb_release -a command

    Suggested read: How to Check Linux CPU Usage or Utilization? (5 Ways)

    2. How to Check OS Version in Linux with /etc/os-release

    The /etc/os-release file contains detailed distribution-specific information that can be viewed using the cat command. It provides the operating system name, version, and other identification details. This method offers a reliable and consistent approach to checking the OS version across different Linux distributions.

    /etc/os-release file

    Suggested read: How to Kill a Process in Linux From the Command Line

    3. How to Check OS Version and Kernel in Linux with uname

    The uname -a command displays system information, including kernel version and system architecture, which helps identify the core operating system details. If you want to check the kernel version, you can use uname -r to view the kernel release information.

    The uname -a command

    Let’s break down this example piece by piece so you can understand what it is telling you:

    FieldExample valueMeaning
    Kernel nameLinuxThe kernel in use
    Hostnameserver01The system’s network name
    Kernel rel.6.8.0-52-genericKernel version number
    Build info#53-Ubuntu SMP Fri Jul…Who built it and when
    Archx86_64CPU architecture (64-bit here)
    OS typeGNU/LinuxConfirms the operating system

    Knowing this information is extremely useful when downloading software, as you must choose a package that matches your system’s architecture (x86_64 or arm64).

    Suggested read: How to Find Most Used Disk Space Directories and Files in Linux

    4. Using the hostnamectl Command

    The hostnamectl command offers a modern, systemd based approach to retrieving system information. It displays detailed operating system and hardware details in a clean, readable format. This command is particularly useful for systems using systemd as their init system.

    The hostnamectl command

    Suggested read: Mastering the Echo Command in Linux (with Practical Examples)

    5. Using the /etc/issue File

    The /etc/issue file briefly describes the operating system and can be viewed using the cat command. It provides a quick glimpse of the system’s distribution and version. This method offers a simple, straightforward way to check basic system identification information.

    Suggested read: How to List Linux Users and Groups in Ubuntu with Command Line

    6. Using the cat /proc/version Command

    The cat /proc/version command reads the Linux kernel version directly from the virtual /proc filesystem, offering a quick and direct method to view kernel information. This command provides raw kernel details and is particularly useful for technical users seeking precise system information.

    Checking the Linux Kernel Version via CLI

    The Linux kernel is software responsible for managing your computer’s hardware and resources. While you will more frequently need to know your distribution’s version, sometimes a specific piece of software or a troubleshooting guide will require you to know the version of the Linux kernel itself.

    The kernel has its own version number, separate from the distribution’s version number. Fortunately, there is a simple and universal command to find this information on any Linux system.

    To see which kernel version your system is running, type the following command into the terminal and press Enter:

    uname -r

    After you run the command, your terminal will display your kernel version. In the above screenshot, the kernel version is 6.8.0-78-generic. This tells you the kernel’s major and minor release numbers that your system is currently using.

    Quick Guide: Checking Your Linux OS Version

    If you just want the commands without explanations, here’s a quick reference:

    Command to TypeWhat It Shows YouWhen to Use It
    hostnamectlA clean, easy-to-read summary including the distribution name, version, and kernel.Best for a quick overview.
    lsb_release -aThe full distribution name, version number, and official codename (e.g., “Jammy Jellyfish”).Use this when you need the official distribution details.
    cat /etc/os-releaseDetailed information about the distribution is formatted as simple text variables.This file is on almost all modern Linux systems and is a great alternative if other commands fail.
    cat /etc/issueA single line of text usually identifies the distribution and its version.This file contains the message shown before you log in, so it’s a simple way to see the OS name.
    uname -aThe Linux kernel version and system architecture (e.g., 64-bit), not the distribution version.Use this specifically when you need to know the kernel version for a driver or advanced software, not the OS name like “Ubuntu.”
    cat /proc/versionExtremely detailed information about the Linux kernel, including how and when it was compiled.This advanced command is useful for deep troubleshooting or when you need technical details about the kernel itself.

    Wrapping Up: When and Why to Check Your Linux OS Version

    Understanding your Linux OS version becomes particularly important when deploying web applications, and this is where platforms such as RunCloud shine for developers and website owners.

    RunCloud simplifies the complex process of Linux server management, enabling users without deep technical expertise to deploy, manage, and scale web applications effortlessly.

    Whether you’re a seasoned developer or a beginner looking to launch your first web application, RunCloud eliminates the traditional barriers associated with Linux server management.

    RunCloud provides an intuitive interface that abstracts the technical complexities, allowing you to focus on your application rather than server configuration intricacies.

    Ready to simplify your web application deployment and management? Transform your web hosting experience now with RunCloud.

    FAQs on Checking OS Version in Linux

    How do I find the kernel version in Linux?

    To find the Linux kernel version, use the command uname -r in the terminal. This command will display the current kernel release number, providing a quick and straightforward way to identify the specific kernel version running on your system.

    Which command shows the full OS version?

    The command cat /etc/os-release provides comprehensive information about your Linux distribution, including the full OS version and name. Alternatively, lsb_release -a offers detailed distribution-specific information in a user-friendly format.

    Is there a graphical way to check the OS version?

    Most Linux desktop environments, such as GNOME and KDE, offer system information tools accessible through the settings menu. This menu displays OS version details in a graphical interface. These built-in utilities provide an easy, user-friendly method for checking system information without using terminal commands.

    Can I check the OS version remotely?

    You can check the OS version remotely using SSH by executing version commands such as uname -a or cat /etc/os-release on the remote Linux system. Ensure you have proper authentication and access permissions before attempting remote system information retrieval.

    Are there differences in commands across Linux distributions?

    While core commands like uname are consistent across distributions, specific version-checking methods can vary between Linux systems including Ubuntu, CentOS, or Fedora.

    What is the significance of the OS version number?

    The OS version number indicates the current release, including kernel updates, security patches, and feature improvements. Understanding your version helps manage system compatibility and security and determines eligibility for software and hardware support.

  • How to Kill a Process in Linux From the Command Line

    How to Kill a Process in Linux From the Command Line

    Are you tired of unresponsive programs, resource-hogging applications, or rogue processes slowing your Linux system down? While knowing how to kill a process on Linux from the command line is a fundamental skill for any Linux user, the story doesn’t end with a simple kill command.

    What if you can’t find the process ID (PID)?

    What’s the difference between a “job” and a “process” – and how do you manage them?

    If you’ve ever found yourself searching for answers to these follow-up questions, you’re in the right place. This article will move past the basic ps aux | grep command and discuss more efficient tools like pgrep and pidof to find exactly what you’re looking for.

    We will learn how to manage foreground and background jobs – an essential skill for multitasking in the terminal.

    We’ll also tackle common points of confusion, such as the difference between jobs and processes, and how to find resource-hungry processes without relying on top.

    But before we kill processes, let’s first refresh our knowledge of what processes are!

    What is a Process in Linux?

    In Linux, a process is an instance of a running program. Each process has its own memory space, system resources, and a unique Process ID (PID) that the kernel assigns.

    Processes can be applications, system services, or background tasks essential for the operating system’s functionality.

    Suggested read: Introduction to Bash For Loops: A Beginner’s Guide

    What is Meant by Killing a Process in Linux?

    Killing a process in Linux means terminating or stopping a program forcefully. This action is often necessary when a process becomes unresponsive, consumes too many system resources, or needs to be stopped for maintenance or security reasons.

    Linux provides several methods to kill processes, ranging from graceful termination signals to forceful stops.

    When you kill a process, you’re essentially sending a signal to that process, instructing it to terminate. The most common signal used for this purpose is SIGTERM (signal 15), which allows the process to perform cleanup operations before exiting.

    In cases where a process doesn’t respond to SIGTERM, users can employ stronger signals such as SIGKILL (signal 9), which forces immediate termination without allowing for cleanup.

    Suggested read: How MailHog Can Transform Your Local Email Testing Process

    Reasons to Kill or Terminate a Process on Linux

    There are various scenarios where killing a process becomes necessary:

    • Unresponsive Applications: When a program freezes or becomes unresponsive, terminating it can free up system resources and allow for a restart.
    • Resource Management: Processes consuming excessive CPU or memory can be killed to maintain system stability and performance.
    • Security Concerns: Suspicious or potentially malicious processes should be terminated to prevent security breaches.
    • System Maintenance: During system updates or reconfigurations, certain processes may need to be stopped.
    • Debugging: Developers often need to terminate processes during software testing and debugging.
    • Freeing Up Ports: Killing a process can release network ports that are being held, allowing other applications to use them.
    • Clearing File Locks: Terminating a process can release file locks, enabling access to previously locked files or directories.
    • Stopping Runaway Processes: Accidental infinite loops or other programming errors can create runaway processes that need to be stopped.

    Suggested read: What is Docker and How Does it Work

    How to Find a Process ID in Linux

    Before you can stop a process, you need to find it, but multiple processes with similar names can run simultaneously. In Linux, every process running on your system has a unique Process ID (PID).

    While many users are already familiar with the ps aux | grep command, there are often faster and more precise tools for the job.

    Let’s explore the best ways to locate processes.

    Using the ps command in Linux

    The ps (process status) command gives you a snapshot of the currently running processes. It has many options, but a few combinations are incredibly useful.

    1. ps aux: This is one of the most common commands for tracking processes, as it shows all processes running for all users. You should use ps aux when you need to identify which user owns a process and how much CPU or memory it’s using.

      The ‘aux’ in this case comprises the following three parameters:
      • a = show processes for all users
      • u = display the process’s user/owner
      • x = also shows processes not attached to a terminal

    Example: To find the process ID of the RunCloud agent, you could type:

    ps aux | grep runcloud

    The second column in the output is the PID you need. You’ll notice that the output presented here is quite complex because of the number of columns, and it can be hard to locate what you need.

    Let’s look at some of the better alternatives below, which provide us with the Process ID without any other complex information.

    1. ps -ef: This command is similar to ps aux and shows every process on the system in a different format. You should use this command if you also need to find a process’s Parent Process ID (PPID).
      • -e = select every process
      • -f = display full-format listing

    Example:

    ps -ef | grep runcloud

    This command returns cleaner output; the process ID is in the second column. However, some users might still find it hard to read. Let’s look at some of the better options below, which produce even simpler output in human-readable format.

    1. ps -C <process_name>: In the previous commands, the ps utility returned a very long list of processes, and we used a different tool (grep) to extract only what we needed and discard everything else. This command provides a much cleaner way to find a process by its name without needing grep.
      • -C = select by the command name

    Example:

    ps -C runcloud

    This will list only the processes named “runcloud” with a clean output showing the PID and how long this process has been running. This command displays the information in a presentable format that is easy to read. However, it can still be cumbersome to extract the process ID of a particular process in an automated manner.

    Using the pgrep Command in Linux

    The pgrep (process grep) command is a modern and efficient tool for finding PIDs. It’s faster and less cumbersome than piping ps to grep. If you want to learn more about Linux pipes, we recommend reading our recent blog post on pipes vs xargs.

    1. Basic pgrep: Simply type pgrep followed by the process name.
    pgrep runcloud

    This command will return only the PIDs of the sshd process, nothing more.

    1. pgrep -l: If you want to see the process name alongside the PID, then you can use the -l (list-name) option
    pgrep -l runcloud
    1. pgrep -u <username>: If you need to find all processes run by a specific user, you can use the -u (user) option.
    pgrep -l -u root

    This will list the PID and name of every process owned by the user “root.”

    Using the pidof Command in Linux

    All the commands we discussed have returned some extra information. If you just want to see the process ID and nothing else, you can use the pidof command with the process name. This command is simple, fast, and doesn’t require data processing to extract the necessary information. This makes it extremely easy to integrate into bash scripts.

    Example:

    pidof runcloud

    In the above example, if any process named ‘runcloud’ is running, this command will output its PID.

    Using the top Command to find the Process ID

    The top command provides a real-time, interactive view of your system’s running processes. Just type top to launch it, and you’ll see a constantly updated list of processes, sorted by CPU usage by default. The PID is in the first column, and the command is in the last column. Once you have found what you are looking for, press the ‘q’ key to exit.

    The above example shows that the ‘runcloud’ process has the process ID 670.

    Managing Background and Foreground Tasks in Linux

    When you run a command in your terminal, it typically runs in the foreground. This means it occupies your terminal, and you must wait for it to finish before entering another command. But what if you need to run a time-consuming task and continue using your terminal?

    This can be done using the built-in job control functionality. A job is a wrapper around one or more processes, allowing you to manage them within your current terminal session.

    Sending a Job to the Background in Linux Shell

    You can start a process directly in the background by adding an ampersand (&) at the end of the command.

    Example: Let’s say you’re running a script that takes a long time.

    ./my-long-script.sh &

    The script will start, and the terminal will immediately return you to the command prompt. You’ll see output similar to [1] 12345, where [1] is the job ID and 12345 is the PID.

    The above example shows that the ls command was launched in the background and assigned the PID 241370.

    Viewing and Managing Jobs with jobs

    It is easy to forget once you have sent a job to the background. The jobs command lists all jobs associated with your current terminal session.

    jobs -l

    The -l option also shows the PID, which is very useful.

    The above example shows that the current terminal session has two jobs running in the background.

    Bringing Jobs to the Foreground and Background

    • fg (Foreground): If you need to interact with a background job again, you can bring it to the foreground with the fg command followed by its Job ID.
    fg %1

    This command brings job ID 1 back to the foreground and makes it the active process in your terminal.

    • bg (Background): If you’ve stopped a foreground process (using Ctrl+Z), you can send it to the background to continue running with bg.
    bg %1

    How to Kill a Process in Linux

    There are several ways to kill a process in Linux, but the first step is always to identify the process you want to kill. Once you identify the process, you can choose the following method based on your needs:

    How to Kill a Process Using the kill Command With a PID

    1. Using the kill command: Once you have the PID, you can use the kill command to terminate the process:
    kill PID

    Replace “PID” with the actual number you found. For instance:

    kill 1234
    kill linux process

    This sends a SIGTERM signal, asking the process to shut down gracefully.

    1. Forceful termination: If the process doesn’t respond to the regular kill command, you can use a stronger signal, SIGKILL (9), which forces immediate termination:
    kill -9 PID

    Be cautious with SIGKILL as it doesn’t allow the process to clean up, potentially leading to data loss or corruption.

    How to Kill Multiple Processes

    Sometimes, you need to terminate multiple processes simultaneously. Linux provides efficient ways to do this:

    1. Using kill with multiple PIDs: If you know the PIDs of all processes you want to terminate, you can list them after the kill command:
    kill PID1 PID2 PID3

    For example:

    kill 1234 5678 9101
    kill multiple linux process via command line
    1. Using command substitution: A more dynamic approach is to use command substitution with pgrep. This method kills all processes matching a name:
    kill $(pgrep process_name)

    For instance, to kill all Firefox processes:

    kill $(pgrep firefox)

    This command first uses pgrep to find all PIDs associated with Firefox, then passes these PIDs to the kill command.

    Suggested read: Everything You Need To Know About wp-config.php File

    How to Kill a Process Using the pkill Command

    The pkill command simplifies process termination by allowing you to kill processes based on their names rather than PIDs:

    1. Basic usage: To kill a process by name, simply type: pkill process_name
      This will terminate all processes with “process_name” in their names.
    2. Case-insensitive matching: If you need clarification on the exact capitalization of the process name, use the -i option. For instance: pkill -i firefox will match “Firefox”, “firefox”, or any other case variation.

    How to Kill a Process Using the killall Command

    The killall command is similar to pkill but requires an exact match of the process name:

    1. Basic usage: To kill all processes with an exact name match: killall process_name
    2. Forceful termination: For stubborn processes use the -9 option (equivalent to SIGKILL): killall -9 process_name

    Suggested read: Mastering the Echo Command in Linux (with Practical Examples)

    How to Kill Process in Linux by User

    Sometimes, you need to terminate all processes owned by a specific user:

    1. Listing user processes: First, you can list all processes for a user: ps -u username
      Replace “username” with the actual username.
    1. Killing user processes: To kill all processes for a user, use pkill with the -u option:
      pkill -u username. For example: pkill -u john
    1. Using killall for user processes: Alternatively, you can use the killall command to kill a particular user’s processes, as shown below.
    killall -u username

    Suggested read: What are Linux Logs? What Are They & How To Use Them

    How to Kill a Process in Linux by Name

    Killing processes by name is often more convenient than using PIDs. There are several ways to do this:

    1. Using pkill: The simplest method is by running the following command:
      pkill process_name. Don’t forget to replace process_name with the name of the process you are trying to kill.
    1. Partial name matching: Use the -f option to match a substring in the process name for more flexible matching. This is useful for processes with long or complex names. The syntax of this command is as follows:
    pkill -f "partial_process_name"

    For example, pkill -f "firefox" would match any process with “firefox” anywhere in its command line.

    How to Kill a Process in Linux with Bash Script

    Creating a bash script for process termination can be helpful for repetitive tasks. Follow the steps below to avoid typing the long and complex commands:

    1. Create the script: Use a text editor to create a file named kill_process.sh. For example, you can use the nano editor to create the file using the following command:
      nano kill_process.sh.
    2. Add the script content: After creating the file, paste the following content into it:
    #!/bin/bash
    process_name=$1
    pid=$(pgrep -f "$process_name")
    if [ -z "$pid" ]; then
        echo "Process not found."
    else
        kill $pid
        echo "Process $process_name (PID: $pid) killed."
    fi

    Once you add the content, you can save it and exit it from the file editor. This script takes a process name as an argument, finds its PID, and terminates it.

    Before you can execute the script, you need to make it executable. Change the file permissions by executing the following command to make it executable:

    chmod +x kill_process.sh

    After changing the file permissions, you can run the script by simply typing its name in the command line, followed by the name of the process you want to kill. For example:

    ./kill_process.sh firefox

    The above command will attempt to kill a process named “firefox” on your computer.

    Linux Process Management: At a Glance

    This table provides a quick reference for common commands used to manage processes directly from the command line.

    Action / GoalBash Command ExampleWhen to Use It
    Kill a process by its PIDkill 1234The standard way to terminate a process when you know its exact PID. This sends a graceful shutdown signal (SIGTERM).
    Force-kill a process by PIDkill -9 1234A last resort to forcibly terminate a non-responsive process. This sends a SIGKILL signal that cannot be ignored.
    Kill multiple specific processeskill 1234 5678When you have a specific list of PIDs, you need to terminate all at once.
    Kill a process by partial namepkill 'node'To conveniently kill a process that matches a name or pattern, without needing to find the PID first.
    Kill all processes with an exact namekillall 'firefox'To terminate all instances of a specific program (e.g., all open Firefox windows). It’s safer than pkill if other processes have similar names.
    Kill all processes owned by a userpkill -u 'Alex'To terminate all processes running under a specific user account, often for administrative or security reasons.

    Wrapping Up

    In this post, we’ve explored various methods for killing processes in Linux from the command line. From using the kill command with a process ID to tools such as pkill and killall, you should now understand how to terminate unwanted or misbehaving processes on your Linux system.

    While a good understanding of the Linux command line helps manage your website, it is not a requirement.

    With the help of a hosting platform like RunCloud, you can easily manage your Linux server without getting bogged down in the technical details.

    RunCloud provides a user-friendly interface that simplifies server management, allowing you to focus on building and growing your online presence.

    Whether you’re a seasoned Linux user or just getting started, RunCloud makes it easy to deploy, monitor, and handle mundane tasks like performing regular backups.

    Ready to take your website to the next level? Sign up for RunCloud today and let us handle the Linux management so you can spend more time on what matters most – your business.

    FAQs on Killing Linux Processes

    How do you kill unnecessary processes in Linux?

    To kill unnecessary processes in Linux, you can use commands such as kill, pkill, or killall to terminate the unwanted processes based on their process ID (PID) or name.

    What command can you use to kill a process?

    The kill -9 PID command, which sends the SIGKILL signal, can be used to forcefully terminate a process that is not responding to a regular termination signal.

    How do you find the killed process in Linux?

    To find a killed process in Linux, you can use the ps command to list all running processes or the pgrep command to search for processes by name.

    How do I gracefully shut down a process in Linux?

    To gracefully shut down a process in Linux, you can use the kill command without any signal options, which will send the SIGTERM signal and allow the process to perform cleanup operations before exiting.

    How do you end a process by keystroke?

    In Linux, you can use the Ctrl+C keyboard shortcut to interrupt and terminate the currently running foreground process.

    How do you abort a run in Linux?

    To abort a running process in Linux, you can use the Ctrl+C keyboard shortcut. This will send the SIGINT signal and interrupt the process’s execution.

    Which key is used to cancel a process?

    The Ctrl+C keyboard shortcut is commonly used to cancel or interrupt the currently running process in Linux.

    How do I kill a high CPU process in Linux?

    In Linux, you can use the top command to identify a process that consumes a large amount of CPU resources and then use the kill command to terminate it.

    What’s the difference between a “job” and a “process” in Linux

    A process is any program that is currently running on the operating system. The Linux kernel manages all processes.
    A job is a shell-level concept that manages one or more processes within a single terminal session. Think of it as a label for a task you’re running. You can move a job to the background or foreground, but the kernel still manages it as a process.

    How can I see processes in a tree-like view?

    It’s useful to see which processes were started by other processes (parent-child relationships). The pstree command is perfect for this, as it gives you a visual map of everything running on your system, which can be very helpful for troubleshooting.

  • How to Check Your Ubuntu Version (Using the Command Line and Gui)

    How to Check Your Ubuntu Version (Using the Command Line and Gui)

    Whether installing new software, following an online tutorial, or troubleshooting an issue, one of the first questions you’ll face is, “What version of Ubuntu are you running?” Your operating system details are necessary for managing your system’s health and functionality.

    The version number of your operating system determines which applications and Personal Package Archives (PPAs) you can safely install, as many are built for specific releases. It also informs you about your system’s support lifecycle. For example, knowing you are on a Long-Term Support (LTS) version confirms that you will receive critical security updates for several years.

    Additionally, countless online guides tailor their instructions to a particular version, such as 22.04 or 24.04, so using the correct one prevents errors. Finally, when you ask for help on a forum or file a bug report, providing your version number is the first and most critical step toward getting a fast and accurate solution from the community.

    In this quick guide, we will show you two simple methods for finding your Ubuntu version: the graphical and command-line methods.

    Let’s get started!

    Method 1: The Graphical (GUI) Way

    If you prefer clicking over typing, Ubuntu’s graphical user interface (GUI) provides a straightforward path to find your system’s information. This method is ideal for desktop users and requires no command-line knowledge.

    Follow these simple steps:

    1. Open the Activities Overview. To do so, click the Activities button at the top-left corner of your screen. Alternatively, press your keyboard’s Super (Windows) key to open the same view.
    2. Find the Settings Application. Once the overview is open, begin typing the word Settings. An icon for the Settings application will appear in the search results. Click on this icon to launch the program.
    3. Navigate to the About Section. The Settings window will open. In the navigation panel on the left-hand side, scroll to the bottom and click on the About tab.

    This will open a screen dedicated to your system’s details. Look for the OS Name line. This line displays your Ubuntu version number and its release type, for example, Ubuntu 24.04 LTS.

    If you are using RunCloud to manage your servers, then you can also see this information in the server dashboard summary section:

    Suggested read: How to Check OS version in Linux

    Method 2: The Command-Line (CLI) Way

    The terminal offers the fastest way to get system information if you are a server administrator, developer, or anyone who prefers working with text-based commands. The Command-Line Interface (CLI), or terminal, is a powerful tool that allows you to communicate directly with your computer.

    Even if you are not a server administrator, we recommend you try this out. These commands are simple, safe, and incredibly useful.

    To begin, open your terminal. The quickest way to do this on a desktop is by pressing the keyboard shortcut Ctrl+Alt+T.

    Option A: The Best All-Around Command (lsb_release)

    This is the standard and most recommended command for checking your Ubuntu version. lsb_release stands for Linux Standard Base, a standardized way for Linux systems to report their identity. Using this command ensures you get clear, well-formatted information.

    In your terminal, type the following command and press Enter:

    lsb_release -a

    Your screen will display an output similar to this. Let’s break down what each line means:

    • Distributor ID: This simply confirms that your operating system is Ubuntu.
    • Description: This is the most important line for most users. It provides the full, human-readable version name, such as Ubuntu 24.04 LTS. The “LTS” signifies a Long-Term Support release, guaranteeing five-year security updates.
    • Release: This shows you just the version number (24.04), which can be useful for scripts or when a guide asks only for the number.
    • Codename: Every Ubuntu version has a unique, alliterative codename (such as “Noble Numbat” or “Jammy Jellyfish”).

    The Codename is more than just a name. You will often use it when adding new software sources, known as PPAs (Personal Package Archives), to your system. The codename ensures you download the correct package built specifically for your version of Ubuntu.

    Option B: Checking the /etc/os-release file

    This alternative method is wonderfully simple and works on nearly all modern Linux systems, not just Ubuntu. Instead of running a specific program, this command directly reads and displays the contents of a system configuration file.

    Type the following command into your terminal and press Enter:

    cat /etc/os-release

    The cat command is a classic utility used to display the contents of files. Here, you are asking it to show you what’s inside the os-release file located in the /etc directory.

    While that looks like a lot of information, you only need to focus on one line. The PRETTY_NAME variable gives you exactly what you need in a clean, easy-to-read format: “Ubuntu 24.04 LTS”.

    Bonus Tip: Checking Your System Architecture (32-bit or 64-bit)

    Knowing your Ubuntu version is important, but sometimes it’s only half the story. When you visit a software download page, you will often see different files listed for the version and the architecture. This refers to the type of processor your computer uses. Installing software built for the wrong architecture will simply not work, so it’s an essential piece of information to have.

    Thankfully, finding your system’s architecture is as easy as finding its version. In your terminal, run the following command:

    uname -m

    On most modern desktop and laptop computers, the command will almost always output: x86_64. This indicates you are running a 64-bit system. You will often see this referred to as amd64 in software package names.

    However, you might encounter a different output, especially on cloud servers or single-board computers like the Raspberry Pi. For example, we see a different result when we run this command on our cloud server managed by RunCloud:

    An output of aarch64 (or sometimes arm64) indicates that the server uses an ARM-based processor. Many people and cloud providers now choose ARM because these processors are designed to be extremely power-efficient. This efficiency means they consume less electricity to perform their tasks, directly translating into lower operational and hosting costs.

    So, if you’re using a modern, cost-effective cloud server, don’t be surprised to find it’s running on an ARM architecture.

    Combining your version (24.04 LTS) with your architecture (x86_64 or aarch64) gives you all the information you need to download the correct software package every time.

    If you are a RunCloud user, you can get this information directly from your server dashboard summary:

    Ubuntu Version Reference Cheat Sheet

    What you want to knowThe command to use
    Full Version Detailslsb_release -a
    Human-Readable Versioncat /etc/os-release
    System Architectureuname -m

    Final Thoughts

    Whether you prefer the visual approach of clicking through the Settings panel or the speed of typing a quick command in the terminal, you can now instantly find both your Ubuntu version and system architecture.

    Knowing your system’s details is the first step to becoming a more confident and capable Ubuntu user.

    Do you have a favorite method or a useful tip we didn’t cover? Let us know in the comments below!

    If you manage one or more servers, there’s an even easier way. Constantly logging in to a terminal just to check basic stats can be time-consuming. RunCloud allows you to directly check the Ubuntu version of your server from the RunCloud dashboard, alongside other critical server health information. RunCloud makes it incredibly easy to manage your Linux servers by providing a clean, powerful interface for tasks that would otherwise require complex command-line work.

    Ready to take the complexity out of managing your Linux servers?

    Sign up for RunCloud today and see how effortless server management can be.