Category: Security

  • How to Block AI Crawlers (GPTBot, ClaudeBot, PerplexityBot, Bytespider) on Your Server in 2026

    How to Block AI Crawlers (GPTBot, ClaudeBot, PerplexityBot, Bytespider) on Your Server in 2026

    AI crawlers can consume bandwidth, increase server load, and collect your content without sending visitors back to your website. Blocking them isn’t as simple as adding a few lines to robots.txt, since not every crawler respects those instructions.

    You also need to distinguish between different types of AI bots.

    • Training crawlers such as GPTBot, ClaudeBot, and Bytespider collect content for AI development.
    • User-triggered agents, such as ChatGPT-User and Perplexity-User, may help your pages appear as cited sources in AI-generated answers.

    Blocking every AI-related user agent could reduce your visibility as well as your server traffic.

    This guide explains how to control AI crawler access without accidentally blocking legitimate search engines or useful AI referral traffic. You will learn how to:

    • Identify the AI crawlers you may want to block
    • Set rules in robots.txt
    • block requests at the NGINX server level
    • Configure Cloudflare’s AI crawler controls
    • Test your rules and confirm they work

    By the end, you will have a layered approach that gives you greater control over who can access your content and how much server capacity automated crawlers consume.

    Why robots.txt Alone Won’t Stop AI Crawlers

    AI-related crawlers serve several different purposes. Some collect content for model training, while others build search indexes or retrieve pages in response to a user request. High-volume crawling can consume bandwidth and server resources, but the impact depends on the crawler, its request rate, your caching configuration, and your application stack.

    This is exactly why you should identify the crawler and its purpose before deciding whether to block it.

    While adding a disallow directive to your robots.txt file is the traditional method for managing bots, it is ineffective against these bots because it runs on an honor system. Aggressive scrapers, poorly configured rogue bots, and many proprietary data brokers routinely ignore robots.txt entirely.

    If you want to protect your infrastructure and intellectual property, you need to implement server-level blocking using NGINX or implement other firewall measures. This allows you to intercept these unauthorized requests at the server level, where you can drop the connection by returning a 403 Forbidden response before the request ever reaches your web application or consumes your server’s computing resources.

    Suggested read: How To Use ModSecurity and OWASP CRS For Web App Firewall (WAF) To Secure Your Website

    Which AI Bots Should You Block in 2026?

    If you want to protect your server resources and intellectual property, you should prioritize blocking the following primary training crawlers.

    Targeting High-Volume AI Training Crawlers

    The following control tokens and user agents are associated primarily with AI training, model development, or large-scale dataset collection:

    • GPTBot
    • ClaudeBot
    • Bytespider
    • Amazonbot
    • Applebot-Extended
    • Google-Extended
    • Meta-ExternalAgent
    • CCBot

    Claude-SearchBot should be considered separately, as Anthropic uses it to support search results rather than for general model training. 

    PerplexityBot is also separate from bulk training crawlers. Perplexity states that it uses PerplexityBot to build its search index and surface links in Perplexity results, not to train foundation models. Blocking it may prevent your pages from appearing in Perplexity search results. 

    block AI crawlers

    Evaluating Real-Time AI Search Agents

    Real-time fetchers operate under a different set of rules than bulk scrapers. Instead of indiscriminately harvesting data, these digital assistants visit your server only when a human query explicitly triggers them to fetch your content. This makes them an important component for maintaining visibility in modern, AI-driven search results.

    Integrating with these tools can be a good marketing move, but it requires balancing visibility against your specific privacy concerns.

    • ChatGPT-User
    • Perplexity-User
    • OAI-SearchBot
    • Claude-User

    Allowing these agents enables AI services to retrieve and cite your current content in response to user requests. It doesn’t guarantee that your page will be selected, cited, ranked prominently, or visited by the user. However, if your domain contains sensitive data or strictly paywalled content, you should weigh your goals carefully. If you prefer total privacy over AI search exposure, block these alongside the bulk training bots.

    Anthropic uses separate user agents for different purposes. ClaudeBot crawls content for model development, Claude-SearchBot supports Claude’s search results, and Claude-User may retrieve a page in response to an individual user’s request. 

    Suggested read: How to Use Cloudflare Firewall Rules to Protect Your Web Application

    Will Blocking AI Crawlers Hurt Your Google Rankings?

    Blocking AI crawlers won’t harm your traditional Google Search rankings if you implement your security blocks correctly and target the right bots. Google designed its ecosystem to allow web admins to opt out of generative AI training without sacrificing their organic SEO visibility.

    Google uses the Googlebot user agents to crawl, index, and rank your pages in standard search engine results. For AI training and generative model grounding (such as feeding live search context to Gemini), Google uses a separate control token known as Google-Extended. Disallowing Google-Extended tells Google not to use your content for training and grounding in certain Gemini systems. Google states that Google-Extended doesn’t affect inclusion or ranking in Google Search.

    Google-Extended doesn’t control AI features that form part of Google Search itself. Access to those features is governed through Googlebot and standard Search controls such as nosnippet, data-nosnippet, max-snippet, and noindex.

    However, there is a massive technical caveat for web admins: unlike most web scrapers, Google-Extended doesn’t have its own separate HTTP request user-agent string. The physical crawling is still executed using standard Google crawler user agents, meaning the Google-Extended token functions purely in a control capacity within your robots.txt file.

    Because the phrase “Google-Extended” will never appear in your server’s incoming HTTP requests, you can’t block it at the NGINX or Cloudflare WAF level using a simple User-Agent string match. You must use the traditional robots.txt opt-out method for Google’s AI training and rely on server-level blocks for other companies’ bots.

    Because of this shared infrastructure, you must be extremely cautious when writing your NGINX rules or WAF policies. Using broad wildcards like *Google* or *bot* to stop scrapers will result in a catastrophic SEO failure, as you will accidentally block the legitimate Googlebot, Googlebot-Image, and Googlebot-Video indexers that your business relies on.

    Suggested read: Linux Server Hardening: 11 Steps to Secure a Production VPS 

    Implementing a Multi-Layered Strategy for AI Bot Management

    Relying on a single method for blocking unwanted AI traffic can leave your infrastructure exposed. If you want to build a truly resilient defense, it is best to implement a layered strategy that covers public directives, server-level interception, and network-edge filtering. This ensures that if one mechanism fails or is ignored, your subsequent layers act as a fail-safe to protect your server resources.

    Layer 1 – Block AI Bots with robots.txt

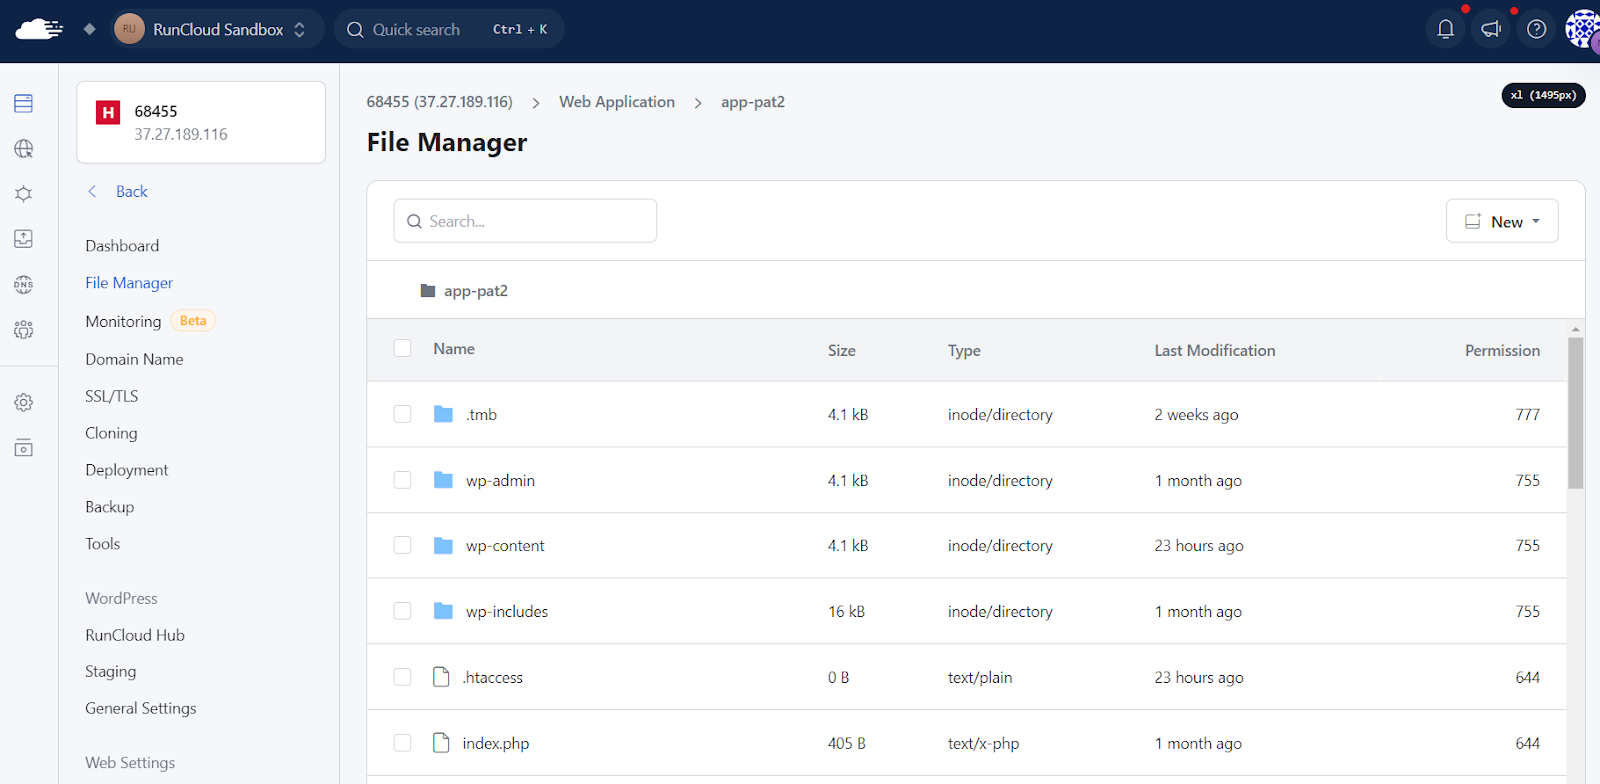
    To set up your first layer of defense, create or edit a simple text file named robots.txt and place it in the root directory of your website (usually the public_html or htdocs folder). 

    To edit your robots.txt, you can simply open your web host’s file manager, create this file, and copy-paste the code below to ask all major 2026 AI training bots to stay away from your entire site:

    User-agent: GPTBot
    User-agent: ClaudeBot
    User-agent: Bytespider
    User-agent: Amazonbot
    User-agent: Applebot-Extended
    User-agent: Google-Extended
    User-agent: Meta-ExternalAgent
    User-agent: CCBot
    Disallow: /

    Why robots.txt alone is not enough (RFC 9309 is advisory)

    While adding a robots.txt file is the industry standard first step, it is important to understand that it operates entirely on an honor system. RFC 9309 standardizes how crawlers should interpret robots.txt, but it doesn’t provide authentication or access control. Compliant crawlers follow its directives voluntarily, while another client can still request the same URL directly. 

    Reputable companies like Google and OpenAI currently program their bots to respect these rules, but aggressive scrapers, rogue data brokers, and malicious AI crawlers will completely ignore your robots.txt file and scrape your content anyway. Therefore, relying on this file alone leaves your server vulnerable to heavy automated traffic, so you must implement server-level blocking as well.

    Layer 2 – Block AI Bots at the NGINX Layer

    If you search for tutorials on how to block bots using NGINX, almost every old guide will tell you to place an if statement directly inside your server block (for example, if ($http_user_agent ~* "GPTBot") { return 403; }).

    Complex rewrite logic inside an NGINX if block can produce unexpected results, particularly when it is placed inside a location block. A simple condition that performs only a return is much less problematic.

    If you want to block traffic, you should use the map directive, which is a better and highly optimized alternative to if statements. When a visitor sends a request, NGINX checks their User-Agent exactly once against this map and assigns a variable (like a simple true/false flag). Because it is evaluated outside the complex location rules, it is incredibly fast and can automatically apply to every single website hosted on your entire server without repeating code.

    To implement this on your server, you will need to access your global NGINX configuration (often located in /etc/nginx/conf.d/) and create a new file named ai_bot_map.conf. Paste the following map directive into that file, which flags the 2026 AI bots with a 1 (true) if they match, and a 0 (false) for normal human visitors:

    map $http_user_agent $is_ai_bot {
        default 0;
        "~*GPTBot" 1;
        "~*ClaudeBot" 1;
        "~*Bytespider" 1;
        "~*Amazonbot" 1;
        "~*Meta-ExternalAgent" 1;
        "~*CCBot" 1;
    }

    Don’t add Google-Extended or Applebot-Extended to this map. They are robots.txt control tokens rather than independent crawler User-Agent strings. Instead, use robots.txt to control them. 

    Choosing the response code

    After identifying the crawlers, you need to decide how your server should handle them when they arrive. Here is a list of appropriate HTTP status codes you can return when rejecting a web request.

    403 Forbidden 

    Returning a 403 Forbidden status is the most common and standard choice because it clearly communicates to the bot that the server understood the request but is actively refusing to fulfill it. 

    444 (Nginx-specific, drops the connection with no response)

    If you are dealing with an incredibly aggressive bot that is hitting your server thousands of times a minute and draining your bandwidth, you should use NGINX’s special 444 response code. Unlike standard HTTP codes, 444 doesn’t send any headers or error pages to the bot; it simply closes the connection immediately. This can reduce the response work and outbound data associated with rejected requests, although NGINX must still accept and process the connection far enough to match the rule. 

    410 Gone (signals permanent removal, deters re-crawls)

    Another good option is to return a 410 Gone status code, which signals to the AI crawler that the resource it is looking for has been permanently deleted and won’t be returned. Use 410 Gone only when the requested resource has been permanently removed. Don’t return 410 solely as a bot-blocking technique for pages that remain available to other visitors. Use 403 or 444 when you are refusing access based on the requester rather than the state of the resource. 

    Logging Blocked Requests for Audit

    You shouldn’t blindly block traffic without keeping a record of what your server is doing. You can instruct NGINX to log blocked bot attempts to a separate file so they don’t clutter your main website analytics.

    By adding a simple directive like access_log /var/log/nginx/blocked_ai_bots.log; inside the block that returns your 403 or 444 code, you create an isolated, easily readable audit trail where you can safely monitor which AI companies are trying to harvest your data.

    Suggested read: How to Block IP Address Using WordPress .htaccess File to Stop Bad Visitors

    Layer 3 – Block AI Bots at the Edge with Cloudflare WAF

    If you manage your DNS through Cloudflare, you can easily intercept AI bots at the network edge before they ever reach your web server by configuring their built-in bot policies. Cloudflare has updated its approach to AI traffic by introducing new features that categorize bots into three distinct behaviors:

    • “Search” (crawlers indexing content to answer queries later and drive referrals)
    • “Agent” (real-time automated bots acting on a human’s behalf, like chat fetch bots) 
    • “Training” (scrapers permanently absorbing your data to train large language models).

    Configure AI Bot Policies

    Cloudflare provides two related ways to manage AI traffic:

    In AI Crawl Control, open the Crawlers tab to review individual crawlers and set each one to Allow or Block.

    For broader behavior-based controls, open the Security settings and configure how Cloudflare handles Search, Agent, and Training traffic. Each category can be allowed, blocked across the domain, or blocked only on pages where Cloudflare detects advertising.

    For each type of bot, you can choose to “Block (on all pages),” “Allow (do not block),” or select “Block on pages with ads,” which uses Cloudflare’s automated detection to block bots strictly on monetized pages while leaving the rest of your site accessible.

    Additionally, from September 15, 2026, Cloudflare will automatically block ‘Training’ and ‘Agent’ bots on pages with ads for all new domains, while keeping Search bots allowed. Cloudflare’s updated system will apply the most restrictive rule to multi-purpose crawlers, such as Googlebot or Applebot, that crawl for both search indexing and AI training.

    From 15 September 2026, Cloudflare plans to evaluate multi-purpose crawlers against all their declared behaviors. A crawler that combines Search and Training may therefore be affected by your Training rule even when Search traffic is allowed.

    Review Cloudflare’s displayed outcome before applying category-wide rules, particularly where a crawler also supports conventional search discovery.
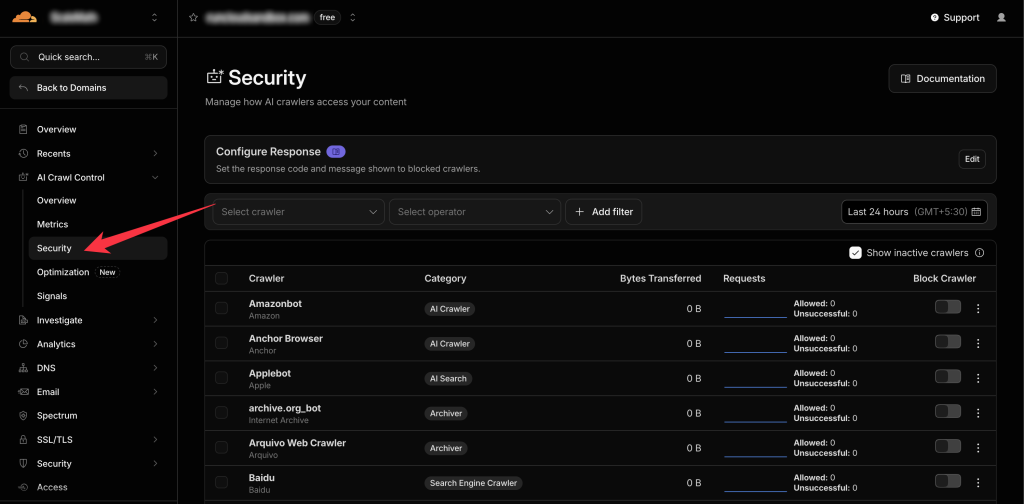
    cloudflare AI crawlers block

    Before enforcing broad blocks across your entire domain, you can also establish governance rules using Cloudflare’s AI Audit tools. The AI Audit dashboard provides visibility into which AI services are scanning your website, allowing you to clearly see the volume of requests from specific bots and understand how they interact with your content.

    By analyzing this traffic, novice users can make data-driven security decisions, such as explicitly allowing search-focused tools that drive referral traffic, while firmly rejecting exploitative scrapers.
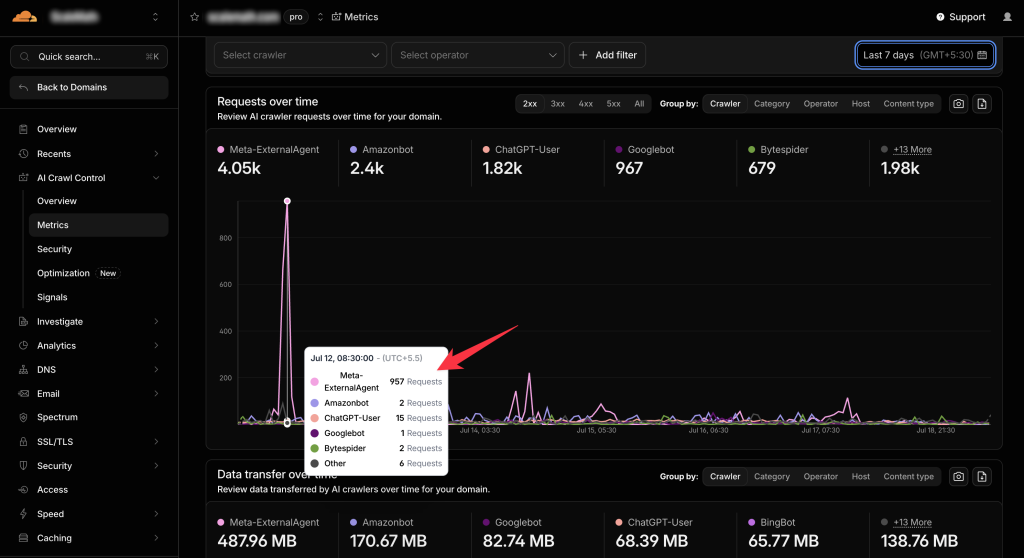
    AI traffic in cloudflare

    Future of AI Content Monetization

    Cloudflare is also testing Pay Per Crawl, which is currently in closed beta. Participating site owners can set a price and choose whether to allow, block, or charge supported crawlers.

    A crawler that doesn’t provide the required payment information receives an HTTP 402 Payment Required response. Availability and crawler participation remain limited, so this shouldn’t yet be treated as a general replacement for blocking.

    Suggested read: What is Fail2Ban with Setup & Configuration? (Detailed Guide)

    Verify that NGINX Blocking is Working

    After deploying your NGINX mapping rules, you shouldn’t simply assume they are functioning perfectly. Server-level configurations are powerful but unforgiving; a minor syntax error could potentially block legitimate traffic or fail to stop the unwanted bots you are targeting.

    You need to validate your setup to ensure your defenses are correct and not causing collateral damage to your site’s availability. Follow the steps below to verify that your block list is successfully intercepting requests.

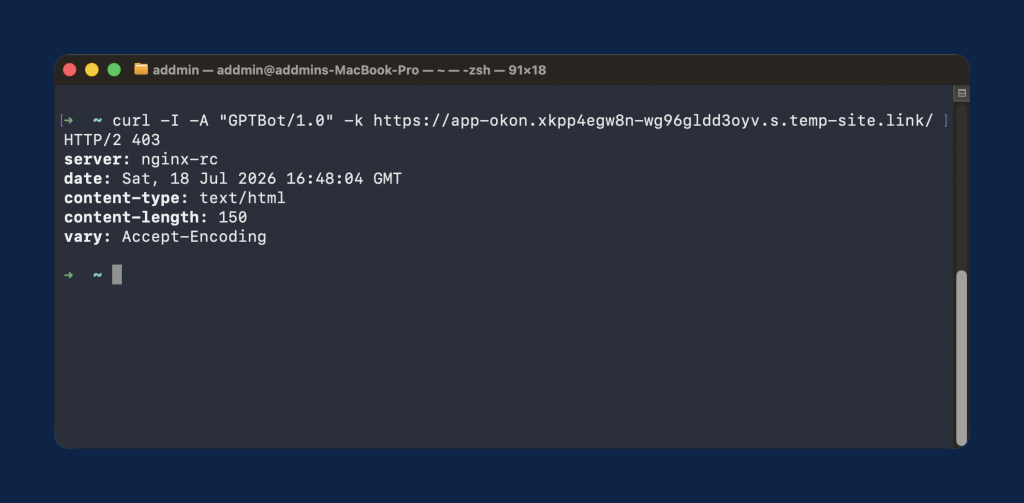
    Curl with a faked GPTBot User-Agent and expect 403

    The easiest way for a novice to test if their server block is working is to pretend to be an AI bot using the command line. Open your computer’s terminal (or Command Prompt) and type the following command exactly:

    curl -I -A "GPTBot/1.0" https://example.com

    This command sends a fake request to your site claiming to be GPTBot; if your NGINX rules are working correctly, your terminal will print out an HTTP/2 403 Forbidden error (or return an empty reply if you used the 444 code), proving the block is active.
    Tail NGINX access logs and grep for the bot user-agents

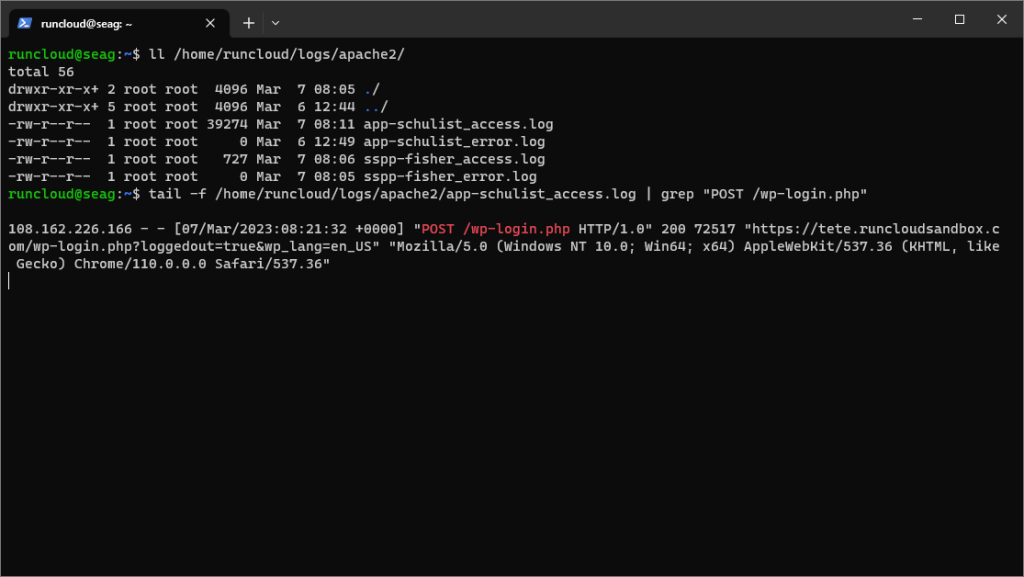
    To watch your server actively defend itself in real-time, you can filter your live server logs for specific bot names. Log in to your server via SSH and run the command:

    tail -f /var/log/nginx/access.log | grep -i "gptbot"

    The tail -f command streams the log file live, while grep filters out everything except requests containing the word “gptbot”, allowing you to sit back and watch the exact moment the AI crawler hits your server and gets rejected.

    Cross-check with Cloudflare bot analytics

    Finally, you can verify your edge-level blocks by reviewing your visual data within the Cloudflare dashboard. Navigate to Security and then click on Events to see a complete log of all web traffic that triggered your WAF rules.

    By filtering this list by “User Agent” or specifically looking at the “Block AI bots” rule metrics, you can visually confirm how many thousands of requests from scrapers like ClaudeBot and Bytespider were successfully dropped by Cloudflare’s network before they ever touched your origin server.

    Final Thoughts: Take Control of Your Server Traffic

    In this article, we have discussed how to manage custom NGINX configurations and protect your websites. It might sound overwhelming, but RunCloud makes the entire process effortless.

    With RunCloud, you can easily manage and deploy sites on your own cloud infrastructure without needing to be a command-line expert. Its highly intuitive dashboard allows you to make quick NGINX updates and instantly reload your server to deploy those security rules across all your hosted applications in just a few clicks.

    Whether you’re hosting a single high-traffic web application or managing dozens of client sites, having complete, frictionless control over your hosting environment is important. 

    Start using RunCloud today.

    Should You Block AI Crawlers? Common Questions Answered

    Will blocking GPTBot or ClaudeBot affect my Google search rankings?

    No, blocking AI crawlers like GPTBot or ClaudeBot won’t negatively impact your Google search rankings. These bots are completely separate from Googlebot, which is the scraper responsible for indexing your site for search engine results. Blocking AI scrapers only prevents your content from being scraped to train their large language models.

    What is the difference between ClaudeBot, Claude-SearchBot, and Claude-User? 

    ClaudeBot crawls web content for Anthropic’s model development. Claude-SearchBot supports Claude’s search results, while Claude-User may retrieve a page in response to an individual user’s request.
    You may choose to block ClaudeBot while allowing Claude-SearchBot and Claude-User if you want to limit training access without removing your content from Claude’s search and user-directed retrieval features.

    Can AI crawlers bypass robots.txt and NGINX blocks?

    Reputable AI crawlers will respect robots.txt directives, but rogue scrapers or malicious bots can easily ignore them. NGINX blocks are significantly more powerful because they intercept and drop the connection at the server level based on the User-Agent or IP address before the site even loads. Custom NGINX rules provide stronger enforcement than robots.txt because they can reject matching requests before they reach the application. User-Agent matching is not foolproof, since another client can spoof a crawler’s name.
    For stronger protection, combine NGINX rules with rate limiting, request logs, verified crawler IP ranges where available, and edge-level bot controls such as Cloudflare.

    Should I block ChatGPT-User and Perplexity-User the same way as I do for GPTBot?

    It depends on your goals, as GPTBot crawls your site globally for AI training, whereas ChatGPT-User and Perplexity-User act as real-time search agents triggered by active user prompts. Blocking these “User” bots will prevent those AI tools from summarizing or linking to your live pages in their chat interfaces. If you want your site to be cited as a live source in AI-generated answers, you should leave user bots alone and block only training bots.

    Does blocking Google-Extended affect Googlebot or Google Ads?

    No, blocking Google-Extended only prevents your site’s content from being used to train Google’s generative AI models, such as Gemini. It operates entirely independently from traditional search indexing and advertising systems. Disallowing Google-Extended doesn’t affect your inclusion or ranking in Google Search. It is separate from the Googlebot controls used for conventional Search crawling.
    Avoid blocking broader Google user agents or IP ranges at the server or firewall level, since an overly broad rule could interfere with Google services that rely on those crawlers.

  • Linux Server Hardening: 11 Steps to Secure a Production VPS

    Linux Server Hardening: 11 Steps to Secure a Production VPS

    Almost as soon as you deploy a server on the internet, it is under attack.

    Within seconds, automated bots begin scanning your ports and hammering your SSH login. If you’re using the default settings on your server, then you are more likely to get compromised.

    While most cloud providers offer a clean slate, those default configurations are built for convenience, not combat. To truly protect your data, you need to follow industry-standard Linux server security best practices.

    Through this guide, you will have a detailed roadmap to secure your VPS with enterprise-grade security. 

    Why a Fresh Linux VPS Is a Target for Hackers

    As soon as your cloud provider assigns a public IPv4 address to your server, the clock starts. Security researchers and malicious botnets continuously scan the entire IPv4 address space using tools such as Shodan, Censys, and Zmap.

    Honeypot data consistently shows that a new, exposed Linux server will experience its first automated SSH login attempt within 3 to 5 minutes of going live.

    If you leave default settings intact, it isn’t a matter of if you get breached, but when. If you don’t protect your server, an automated script will root your server, deploy a crypto-mining payload, and potentially leave you with a thousand-dollar cloud compute bill overnight.

    What Does the “Attack Surface” Mean?

    The “attack surface” is the exact combination of open ports, default configurations, and predictable patterns your server exposes to the internet. A fresh VPS usually has:

    • Port 22 open to the world: The universal beacon for SSH brute-force scripts.
    • Root login enabled: Giving attackers the ultimate username; they only need to guess the password.
    • Password authentication is enabled, allowing unlimited dictionary attacks against your login prompt.

    If you provision your servers through a control panel like RunCloud, much of this attack surface is already minimized for you. But if you are managing a bare-metal VPS yourself, run the commands below to manually lock it down.

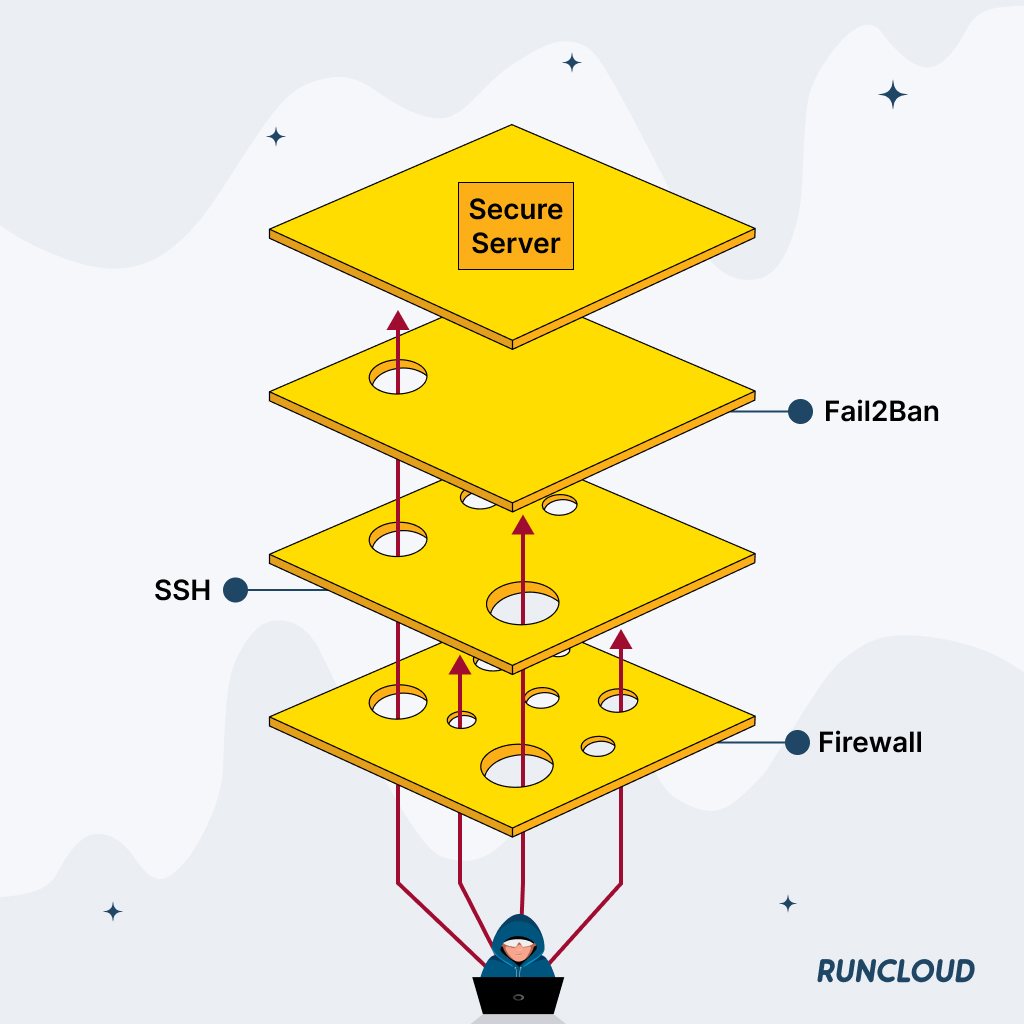
    However, any one single measure won’t be enough to protect your server; that’s why we recommend following the “Swiss Cheese Model of Security”.

    Suggested read: 10 Security Tips to Secure VPS Server in 2025 [Ultimate Guide] 

    The Swiss Cheese Model of Security

    This model is built on the principle that security should never rely on a single control, as even the best defense has holes, or “slices” of weakness. 

    In this model, each layer of security (like disabling root login, configuring UFW, enabling Fail2Ban, etc.) is represented by a slice of Swiss cheese. Each slice has holes representing vulnerabilities, misconfigurations, or human error.

    • A single slice (one defense) is easily penetrated if an attacker’s exploit aligns with the hole in that single layer.
    • Multiple slices stacked together provide defense-in-depth. While the holes in the first slice (e.g., a custom SSH port) might align with the threat, the second slice (e.g., SSH key authentication) or the third slice (e.g., Fail2Ban) is highly unlikely to have a hole in the exact same spot.
    The Swiss Cheese Model of Security for Linux Server Hardening

    By stacking all 11 steps in this guide, we can ensure that even if one defense fails, the next layer (or the layer after that) will stop the threat, preventing it from reaching your core application.

    Suggested read: 5 Ways to Fix the SSH Connection Refused Error [SOLVED] 

    How to Harden a Linux Server

    Follow the steps below to protect your Linux server on the internet:

    Step 1: Disable Root Login and Create a Sudo User

    Performing regular maintenance activities on your server as the root user is dangerous – a single typo can destroy your system.

    To protect your system, we recommend creating an unprivileged user and granting it administrative rights via sudo.

    Connect to your VPS as root, then run:

    # Replace 'sysadmin' with your preferred username
    adduser sysadmin

    You will be prompted to set a password. Make it strong, even though we will disable password logins shortly. Skip the contact information prompts by hitting Enter.

    Next, add your new user to the sudo group so you can execute administrative commands:

    usermod -aG sudo sysadmin

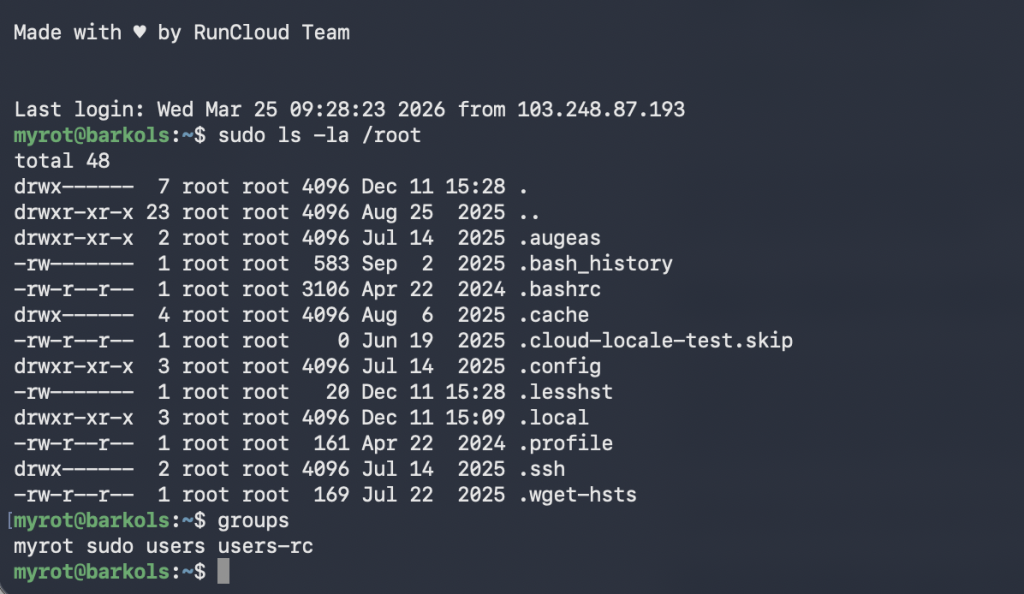
    Verify it works before logging out. Switch to your new user and test sudo:

    su - sysadmin
    sudo ls -la /root

    If you are prompted for your password and can successfully see the contents of the root directory, your sudo user is ready.

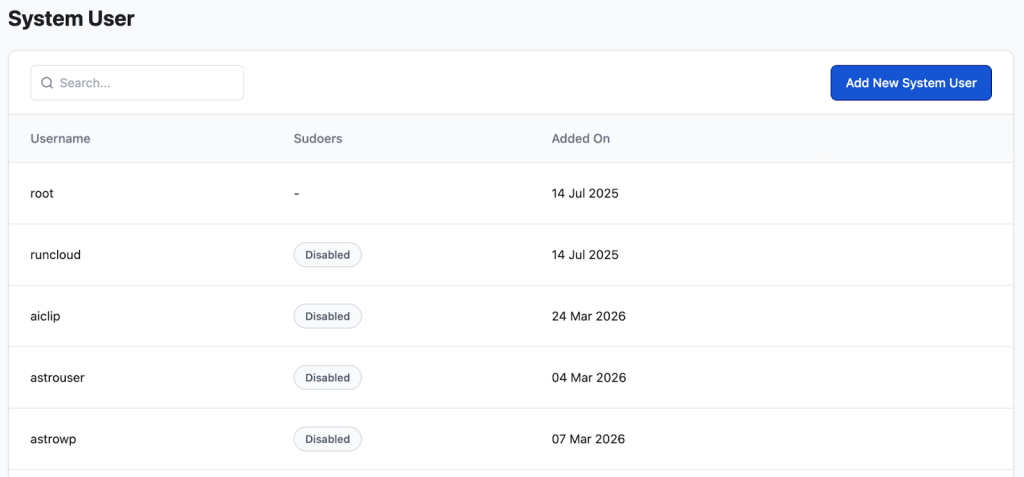
    With RunCloud, you can manage users and permissions for your Linux server directly from the web dashboard, without SSHing into the server. 

    Step 2: Switch to SSH Key Authentication and Disable Password Login

    A secure password is hard to remember, and a weak password can be cracked immediately. That’s why all cybersecurity experts agree that cryptographic keys are a better replacement for your username/password based logins.

    In this step, we are going to replace password authentication with an ed25519 SSH key pair (which is faster and more secure than older RSA keys).

    Generate your key pair locally

    Do not run this on your VPS. Open a new terminal on your local computer (your Mac, Windows, or local Linux machine):

    ssh-keygen -t ed25519 -C "your_email@example.com"

    Hit Enter to save the key to the default location (~/.ssh/id_ed25519). When prompted, you can set a strong passphrase to encrypt the key on your local disk or leave it blank if you don’t want to encrypt it.

    Copy the public key and lock down the sshd_config

    Still on your local computer, copy the public key to your VPS, targeting your new sudo user:

    ssh-copy-id sysadmin@YOUR_VPS_IP

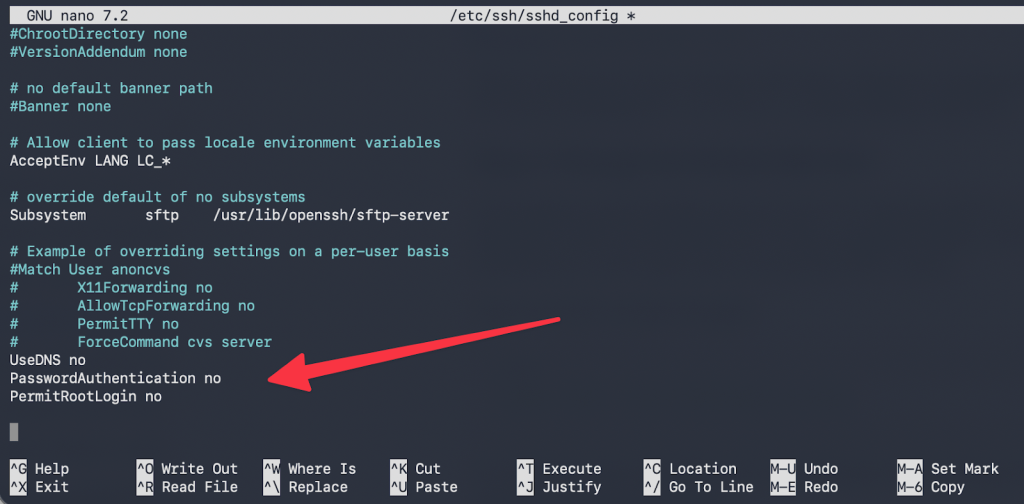
    Now, go back to the terminal window connected to your VPS. It’s time to edit the SSH daemon configuration to disable password logins and root access permanently.

    sudo nano /etc/ssh/sshd_config

    Find the following lines, uncomment them (remove the #), and change their values to match these exactly:

    PermitRootLogin no
    PasswordAuthentication no
    PubkeyAuthentication yes

    Save and exit (CTRL+O, Enter, CTRL+X). Do not restart the SSH service just yet; we are going to change the port in the next step.

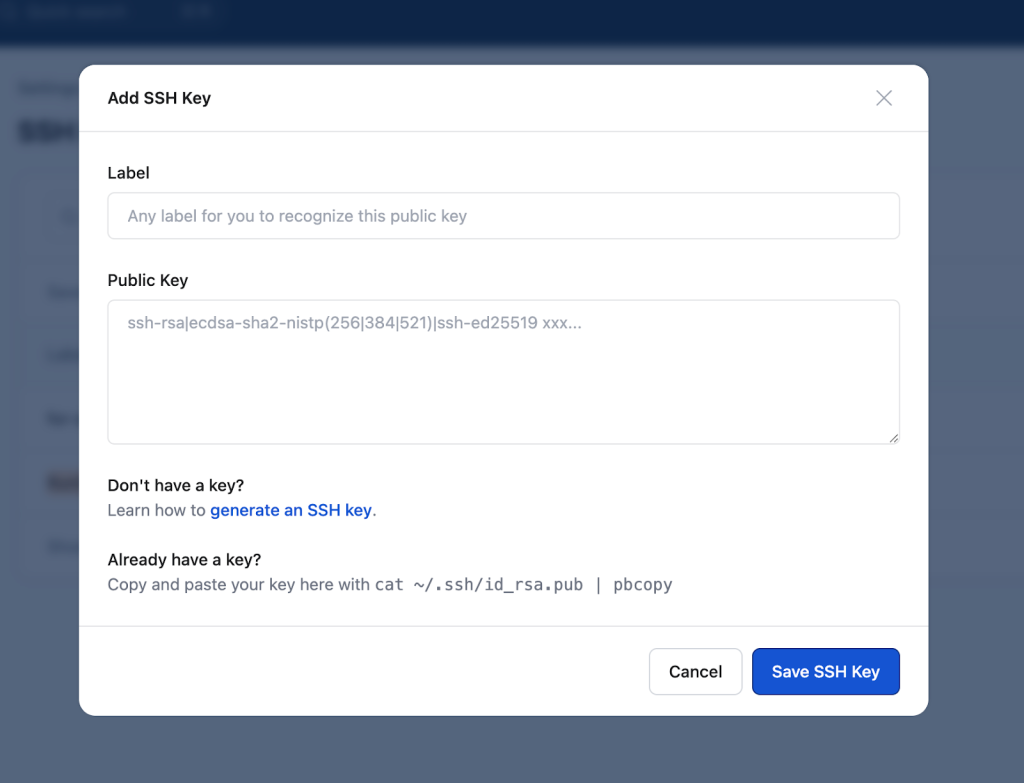
    Note: RunCloud users can add SSH keys to their servers simply by pasting their public key into the RunCloud dashboard, no nano or config editing required.

    Step 3: Change the Default SSH Port

    Most automated scripts scan for and try to exploit port 22. Moving SSH to a non-standard high port (between 1024 and 65535) won’t stop a targeted attack, but it drops botnet noise by 99%, keeping your auth logs clean and saving CPU cycles.

    Open the SSH config file again:

    sudo nano /etc/ssh/sshd_config

    Find the line that says #Port 22. Uncomment it and change it to your desired port. For this example, we will use 52222:

    Port 52222

    Save and exit.

    Warning: DO NOT restart SSH until we configure the firewall in Step 4, or you will permanently lock yourself out.

    Step 4: Configure UFW to Allow Only What You Need

    Ubuntu and Debian servers use UFW (Uncomplicated Firewall) to manage network connections. To protect your server, we recommend setting a default-deny policy for incoming traffic, allowing outgoing traffic, and explicitly opening only the ports we need.

    Run the following commands on your VPS:

    # Deny all incoming traffic by default
    sudo ufw default deny incoming
    
    
    # Allow all outgoing traffic by default
    sudo ufw default allow outgoing
    
    
    # Allow your NEW custom SSH port (crucial!)
    sudo ufw allow 52222/tcp
    
    
    # Allow HTTP and HTTPS if you are hosting web apps
    sudo ufw allow 80/tcp
    sudo ufw allow 443/tcp

    Review your staged rules:

    sudo ufw show added

    If everything looks correct, you can enable the firewall by running the following command:

    sudo ufw enable

    Once the firewall is enabled, any new traffic entering or leaving your server will be inspected and filtered according to the rules we configured above. If any application has already established a connection, it won’t be terminated, but if the application attempts to establish a new connection, it will be blocked by the firewall. 

    Now that the firewall allows traffic on your custom port, we can safely apply the SSH changes by running the following command:

    sudo systemctl restart ssh

    Testing phase: DO NOT CLOSE your current terminal session. Open a new terminal on your local machine and test your new setup:

    ssh -p 52222 sysadmin@YOUR_VPS_IP

    If you successfully connect using your SSH key, you can close the original root session.

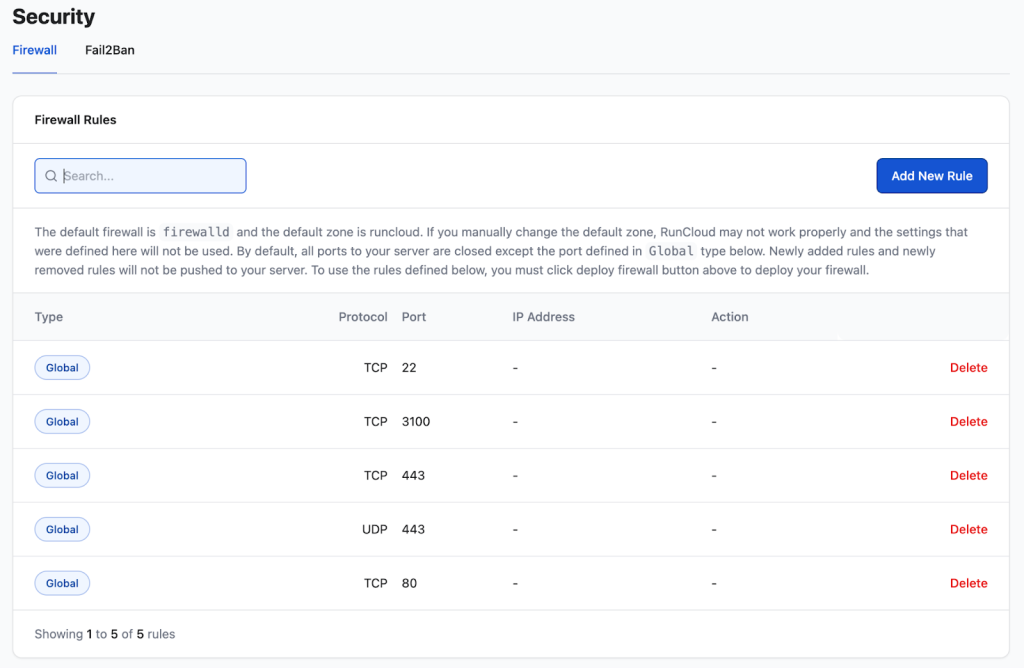
    Note: If configuring firewalls over CLI makes you nervous, RunCloud’s Firewall Manager lets you set, preview, and deploy port rules and IP whitelists directly from the dashboard without touching the terminal.

    Suggested read: Enable Zero-Trust SSH with Cloudflare on Windows, Mac, Linux, and ChromeOS 

    Step 5: Install Fail2Ban to Block Brute-Force Attacks

    Now that we have changed the SSH port and disabled password authentication, the server is relatively secure, but automated bots will still try to break in by sending random login attempts with incorrect credentials.

    Fail2Ban monitors your log files and dynamically updates your firewall to block IP addresses that show malicious behavior.

    To configure this on your Linux server, you can install the Fail2Ban package using the following command:

    sudo apt update && sudo apt install fail2ban -y

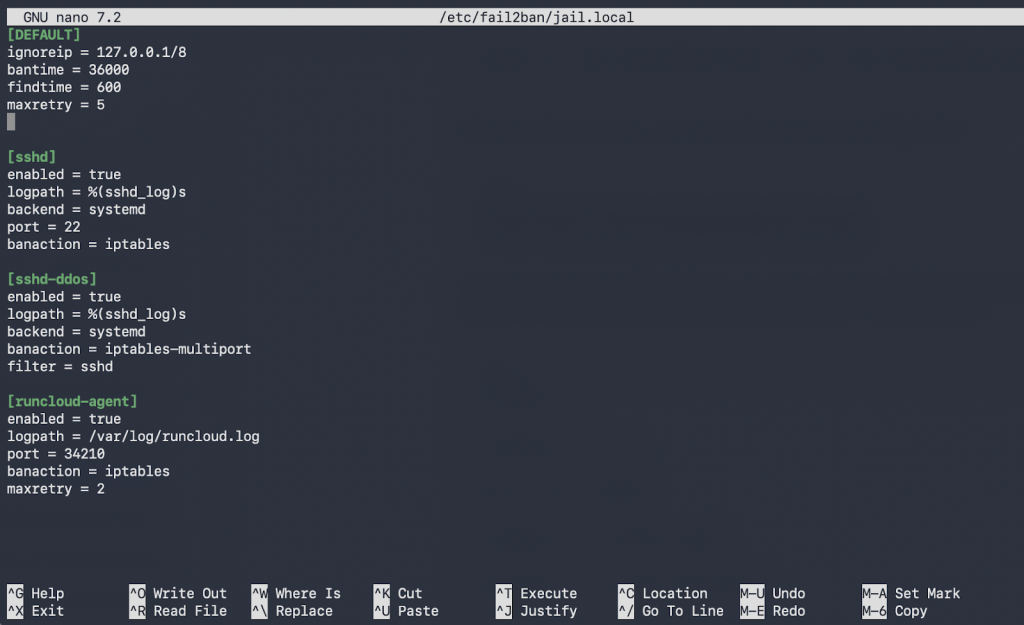
    After installing it, you need to create a set of rules (called “jails”) for your server. We strongly recommend that you don’t edit the default jail.conf file, as package updates will overwrite it. Instead, you should copy it to create a new file called jail.local. You can do this on a Linux server using the following command:

    sudo cp /etc/fail2ban/jail.conf /etc/fail2ban/jail.local

    After creating the file, you can edit your local configuration:

    sudo nano /etc/fail2ban/jail.local

    Scroll down to the [sshd] block. You need to tell Fail2Ban that you are using a custom port, and explicitly enable the jail. Modify the block to look like this:

    [sshd]
    enabled = true
    port    = 52222
    logpath = %(sshd_log)s
    backend = %(sshd_backend)s
    maxretry = 3
    bantime = 1h

    Run the following commands to save and exit, then start and enable the service:

    sudo systemctl enable fail2ban
    sudo systemctl restart fail2ban

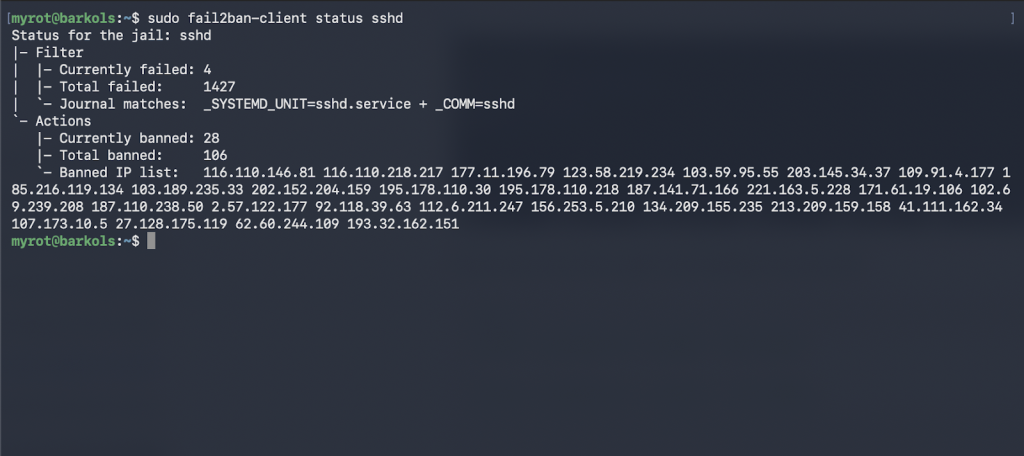
    After creating the service, you can verify that your SSH jail is active using the following command:

    sudo fail2ban-client status sshd

    In the screenshot above, we can see the list of IP addresses that Fail2Ban has banned from accessing our server.

    By completing these 5 steps, you have eliminated the low-hanging fruit that compromises 95% of fresh Linux setups. 

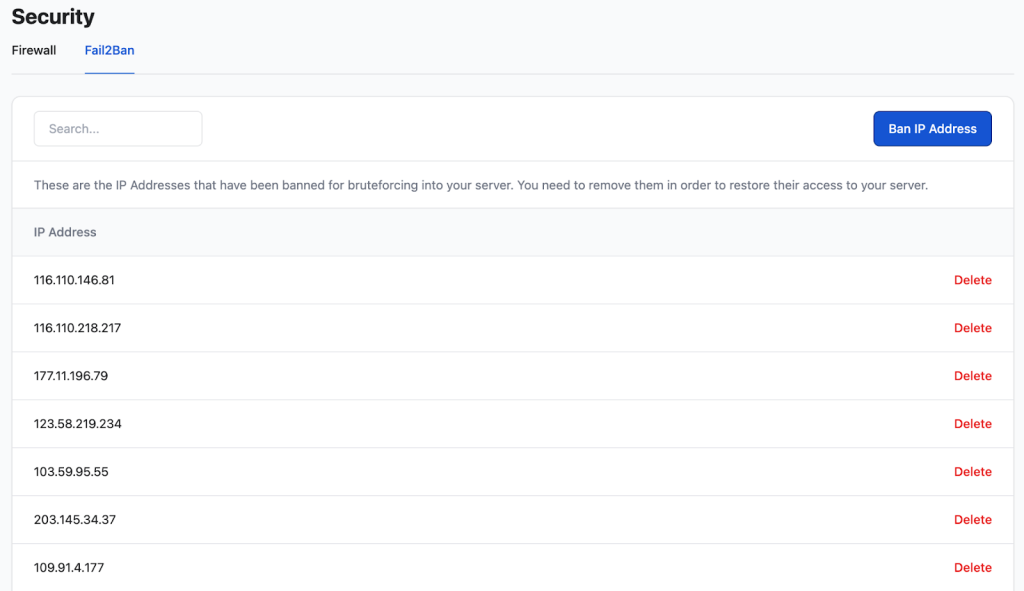
    Note: Getting Fail2Ban thresholds wrong in jail.local often results in banning yourself or failing to trigger on real attacks. That’s why RunCloud ships with Fail2Ban pre-configured for web and SSH traffic. 

    Suggested read: How to Use Cloudflare Firewall Rules to Protect Your Web Application 

    Step 6: Enable Automatic Security Updates

    A hardened server is only secure until the next CVE is published. If you are managing more than one server, you should not want to manually run apt upgrade whenever a vulnerability is discovered in OpenSSL or your kernel. Enable unattended-upgrades to automatically install critical security patches in the background.

    To do this, first you need to install the necessary packages using the following command:

    sudo apt update && sudo apt install unattended-upgrades apt-listchanges -y

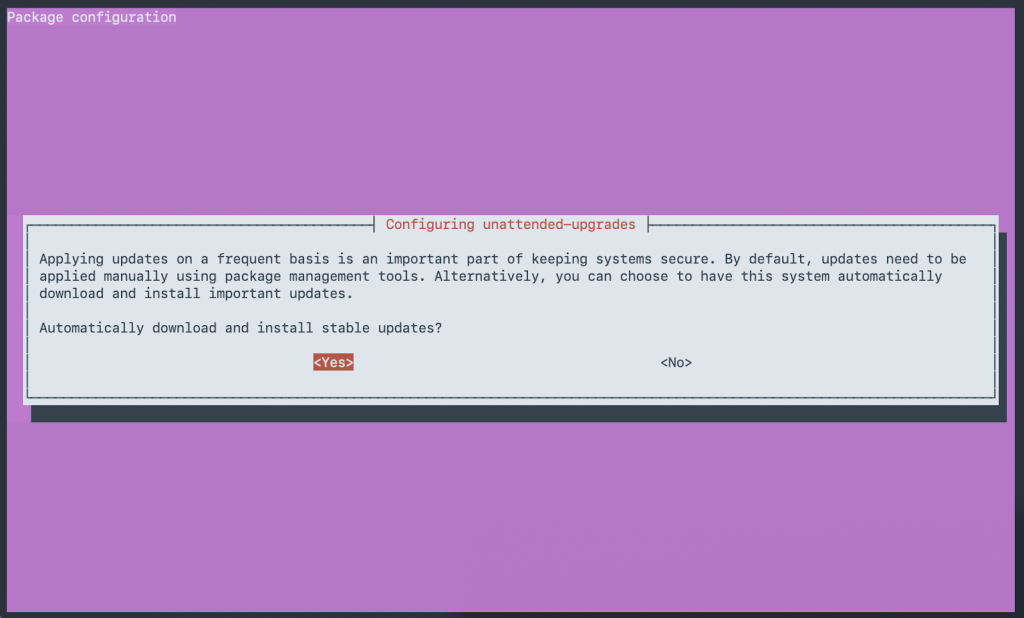
    After installing the services, you can enable the service via the interactive prompt:

    sudo dpkg-reconfigure -plow unattended-upgrades

    Select Yes when prompted to automatically download and install stable updates.

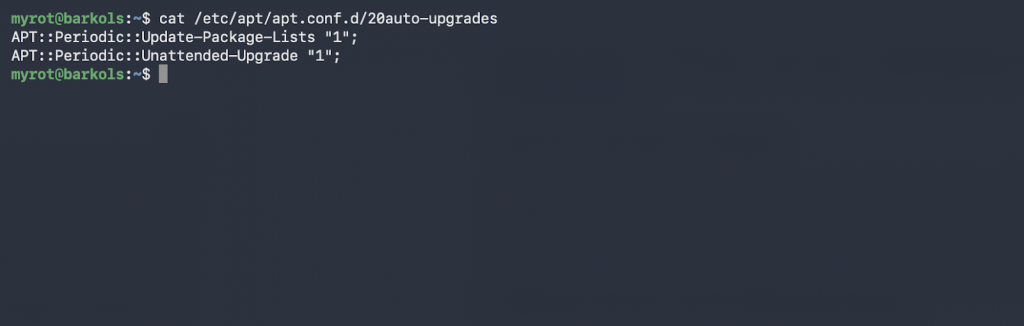
    After configuring it, check the configuration file to verify that it has been activated successfully using the following command:

    cat /etc/apt/apt.conf.d/20auto-upgrades

    When you run the above command, you should see APT::Periodic::Unattended-Upgrade "1"; in the output.

    Step 7: Remove Unused Packages and Disable Unnecessary Services

    Every service running on your server is a potential entry point for hackers. If you aren’t using a service or application, you can turn it off to protect your server and conserve resources.
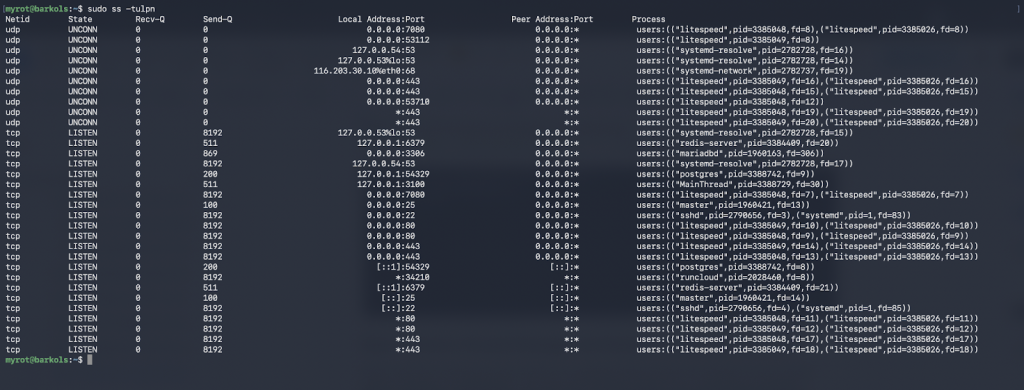
    To do this, first, we will audit what is actively listening on your server’s network interfaces by using the following command:

    sudo ss -tulpn

    If you see any services that you don’t want, then you can stop and disable them so they don’t start on reboot:

    sudo systemctl stop <name>
    sudo systemctl disable <name>

    In the above commands, replace the <name> with the actual name of the service that you want to disable. 

    Next, purge any orphaned packages and dependencies that came pre-installed on your provider’s OS image but which aren’t needed anymore:

    sudo apt autoremove --purge -y

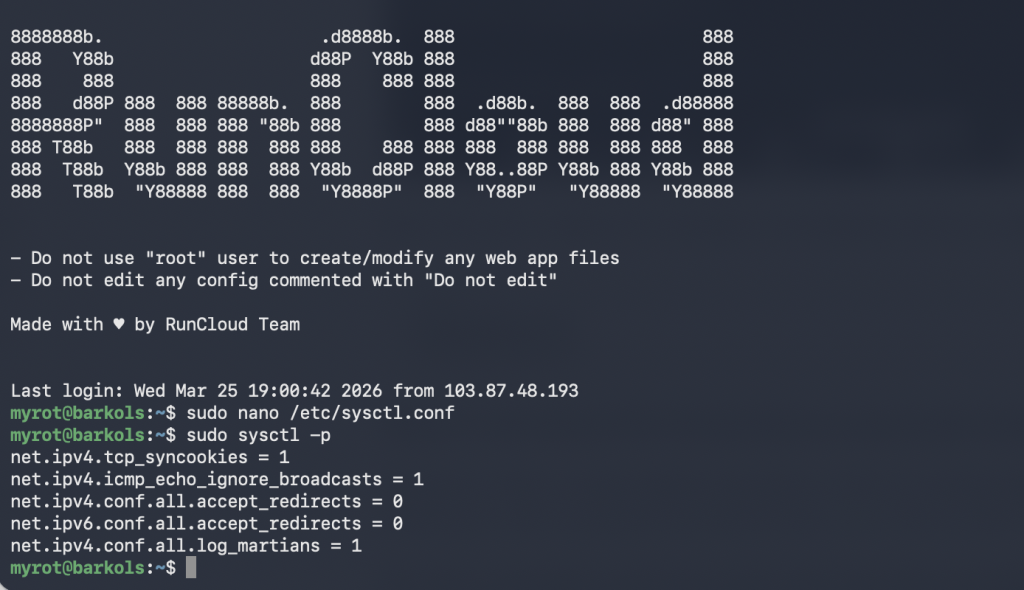
    Step 8: Harden Kernel Parameters with sysctl

    By default, the Linux kernel uses networking parameters optimized for broad compatibility rather than strict security. When you deploy your server on the internet, it will be constantly bombarded with hundreds of attacks that try to exploit these compatibility features. 

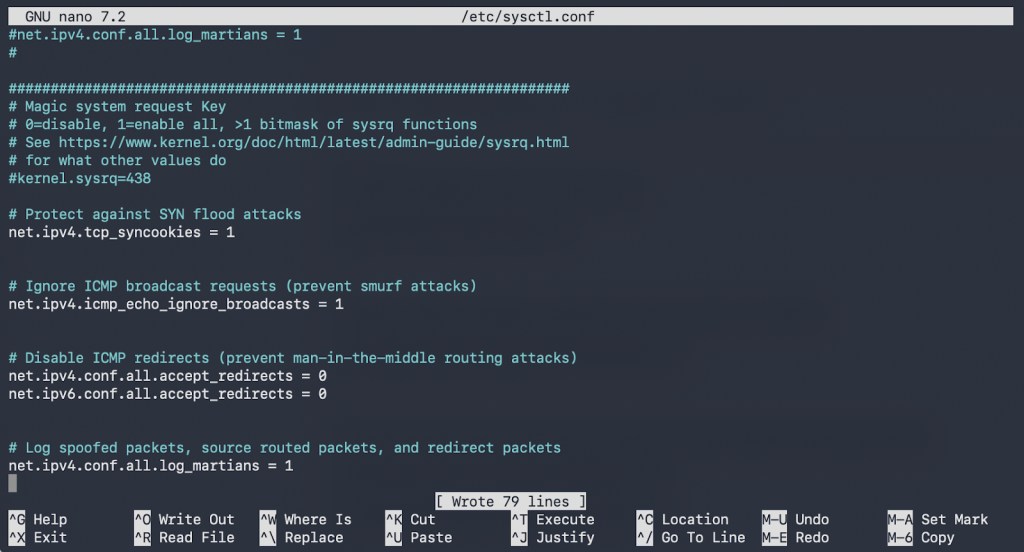
    But you can mitigate several types of network attacks (like SYN floods and IP spoofing) by tweaking sysctl.conf. To do this, you can open the configuration file using the following command:

    sudo nano /etc/sysctl.conf

    In this file, we will disable certain features by appending the following lines to the bottom of the file:

    # Protect against SYN flood attacks
    net.ipv4.tcp_syncookies = 1
    
    
    # Ignore ICMP broadcast requests (prevent smurf attacks)
    net.ipv4.icmp_echo_ignore_broadcasts = 1
    
    
    # Disable ICMP redirects (prevent man-in-the-middle routing attacks)
    net.ipv4.conf.all.accept_redirects = 0
    net.ipv6.conf.all.accept_redirects = 0
    
    
    # Log spoofed packets, source routed packets, and redirect packets
    net.ipv4.conf.all.log_martians = 1

    After editing the file, you can save and exit the file editor (CTRL+O, Enter, CTRL+X). After that, you can apply the changes immediately without rebooting by running the following command:

    sudo sysctl -p

    Suggested read: 16 Best Linux Distros in 2025 

    Step 9: Set Strict File Permissions and Audit User Accounts

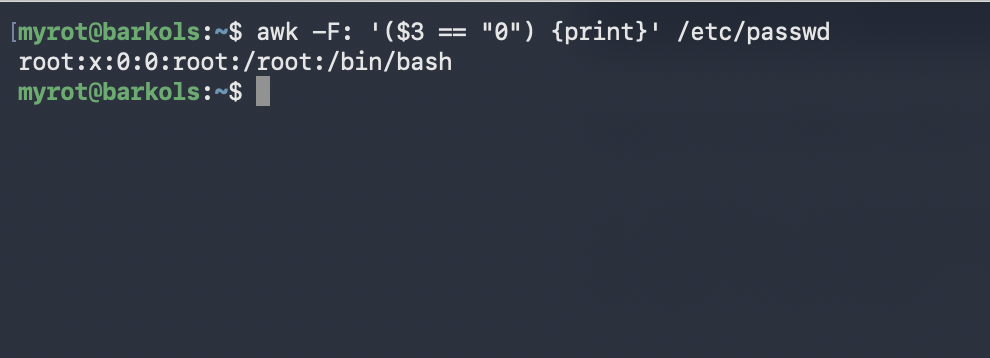
    If an attacker compromises a system, they will try to either create hidden backdoor users, or leave files with wide-open permissions. There are several steps you can take to ensure this isn’t the case on your server. First, you can audit your user accounts to ensure only root has a User ID (UID) of 0. Run this command to print any user with root-level privileges:

    awk -F: '($3 == "0") {print}' /etc/passwd

    This should output exactly one line: root:x:0:0:root:/root:/bin/bash. If you see any other user here, then it is possible that your server is compromised.

    Next, verify that no users have empty passwords:

    sudo awk -F: '($2 == "") {print}' /etc/shadow

    This should return no output.

    Finally, find and review any world-writable directories (directories anyone can write to) that don’t have the “sticky bit” set (which prevents users from deleting each other’s files):

    sudo find / -type d -perm -0002 -a ! -perm -1000 -print 2>/dev/null

    If your server is serving multiple websites, then the above command will probably return a long list of directories. You need to review this list and, if you find any rogue directories, investigate them immediately and restrict their permissions using chmod 755.

    Step 10: Review Mandatory Access Control (AppArmor and SELinux)

    AppArmor (on Ubuntu/Debian) and SELinux (on RHEL/AlmaLinux) are Mandatory Access Control (MAC) systems. They act as a high-level security guard built directly into the Linux kernel. While standard file permissions (chmod) control who can see a file, MAC systems control which specific programs are allowed to do what.

    In a standard setup, if a hacker exploits a vulnerability in a web server such as NGINX and gains “root” access, they can theoretically access every file on your server.

    With AppArmor or SELinux active, the program is confined to a “sandbox.” Even if NGINX is compromised, the MAC system detects that NGINX is attempting to access sensitive system files (such as/etc/shadow) or execute unauthorized commands. Because that behavior isn’t in the program’s predefined “security profile,” the kernel blocks the action instantly, even if the attacker has root privileges. It effectively limits the “blast radius” of any potential hack.

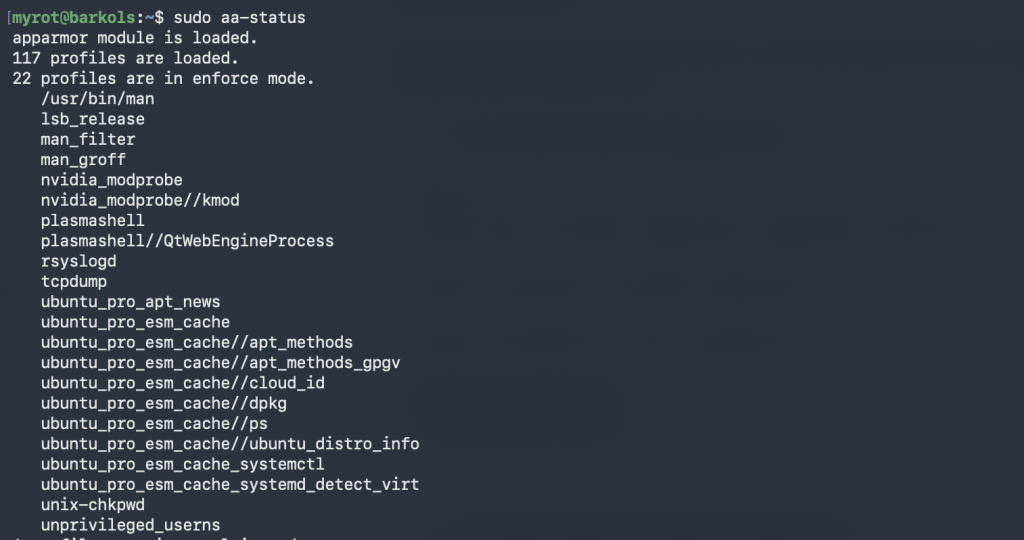
    You can run the following commands to check the configuration of these systems on your server:

    • On Ubuntu/Debian (AppArmor):
    sudo aa-status
    • On RHEL/Alma/Rocky:
    sestatus

    Manually configuring MAC systems is tricky, and beyond the scope of this article. It requires writing deep-level security profiles that define every single file, port, and network socket a program is allowed to touch. One small mistake in a profile can cause your database to crash or prevent your website from loading, leading to hours of frustrating troubleshooting.

    The good news is that if you are using RunCloud, you don’t need to lift a finger.

    RunCloud servers are engineered to be secure out of the box. The platform automatically configures and optimizes these security layers during server provisioning. Your server is hardened the moment it connects to the RunCloud panel, allowing you to focus on your applications while RunCloud handles the complex kernel security in the background.

    Step 11: Configure Off-Server Backups

    Hardening your server reduces the risk of a hack, but it cannot protect you against hardware failure, a data center fire, or an accidental rm -rf / command. Off-server backups ensure that even if your entire VPS is deleted, your business can be restored in minutes.

    There are several ways to handle backups, each with its own pros and cons:

    1. Disk-Level Snapshots: Taking a full image of your server via your provider (like DigitalOcean or AWS). These are easy but often expensive, and they’re hard to move between providers.
    2. Application Plugins: Using WordPress plugins like UpdraftPlus. These are user-friendly, but they can slow down your site because they use your server’s PHP resources to compress files.
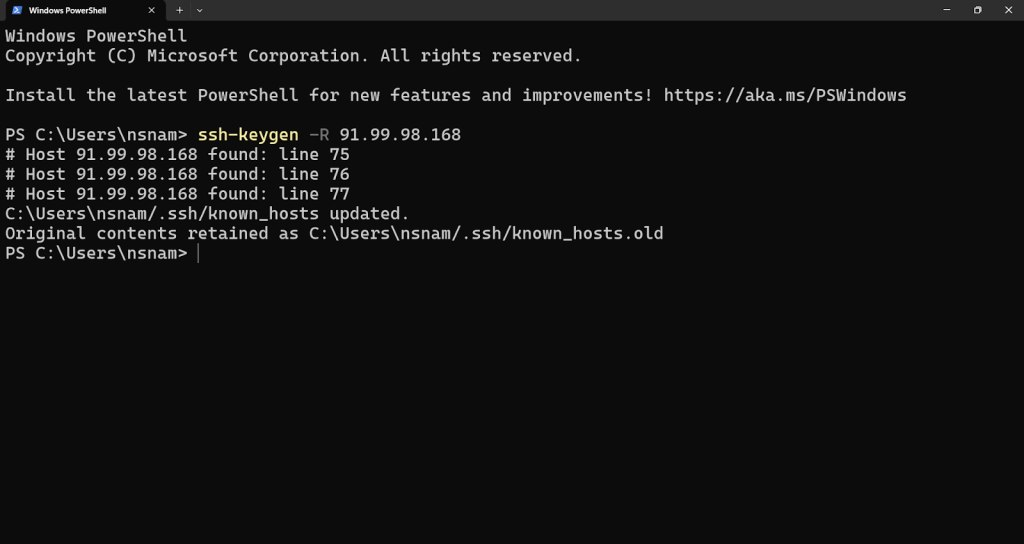
    3. Manual Scripting: Using Linux tools to manually move data. If you choose to do this manually, you must manage three distinct parts: the database, the files, and the transport. 
      • Security: Manual rclone or script configs often store your Cloud API keys or Database passwords in plaintext on the server. If a hacker gets in, they now have your backup keys too.
      • Resource-Heavy: Compressing large folders (tar) and dumping databases every night causes high CPU and Disk I/O spikes, which can make your website sluggish during the backup window.
      • Reliability: If the script fails, you won’t know until you try to restore and find out that the files are empty.

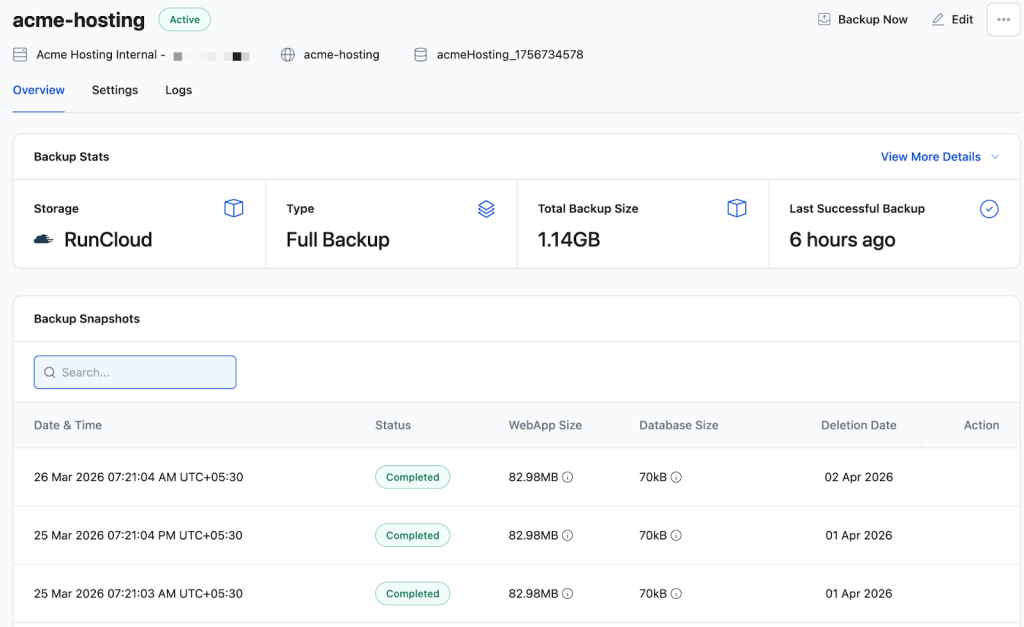
    If you are using RunCloud, you don’t need to deal with any of this.

    RunCloud uses Incremental Backups, which is a far superior technology. Instead of zipping your entire site every night (which is slow and uses a lot of disk space), RunCloud only identifies the specific data that changed – and syncs just that.

    • Fast & Efficient: Because it only moves “changes,” backups finish in seconds rather than minutes.
    • Zero Resource Lag: It doesn’t put a heavy load on your server, keeping your website fast even during a backup.
    • Encrypted & Secure: Your S3 or Backblaze credentials are stored in RunCloud’s encrypted vault.
    • Backup Notifications: You can configure the Backup script to notify you via Slack/Email/Discord if the backup fails for any reason.
    • One-Click Restore: If something goes wrong, you don’t have to remember complex Linux commands. You just click “Restore” in the dashboard, and RunCloud puts everything back exactly where it belongs.
    Runcloud automated backups

    After Action Report

    If you have followed all the steps in this article, your server is now locked down and can withstand a variety of internet attacks. But a hardened server isn’t very useful if it doesn’t host anything. The next step is installing your web stack (NGINX/Apache, PHP, MySQL) and provisioning SSL certificates.

    Doing this manually means diving right back into the terminal. After hardening, managing NGINX, PHP-FPM, and SSL still requires SSH for every single configuration change, virtual host creation, and certificate renewal.

    RunCloud manages your NGINX configuration, PHP-FPM tuning, and Let’s Encrypt SSL deployments entirely from a UI, while fully respecting the hardened SSH and firewall configurations you just put in place. 

    While RunCloud simplifies complex server management tasks, it is designed for developers, agencies, and power users who need more than just a basic cPanel replacement. Once your servers are hardened, RunCloud enables you to scale your operations by offering tools for advanced management:

    • Multi-Server Management: Easily oversee, update, and manage dozens or hundreds of hardened Linux servers from a single dashboard.
    • Team & Role-Based Permissions: Delegate server access to team members or clients without sharing SSH keys or root passwords, thanks to granular control over who can manage applications, databases, or backups.
    • API-Driven Control: Integrate server and application management into your custom workflows using the RunCloud API, allowing for automated server provisioning and deployment.

    Start using RunCloud today.

    Frequently Asked Questions

    What is Linux server hardening?

    Linux server hardening is the process of reducing a system’s attack surface by patching vulnerabilities, disabling unused services, and implementing strict access controls. Common hardening steps include disabling root SSH access, configuring firewalls like UFW, and enforcing cryptographic key-based authentication.

    How long does it take to harden a Linux server?

    Manually executing a basic Linux hardening checklist on a fresh VPS typically takes an experienced sysadmin about 30 minutes. However, advanced hardening procedures like configuring SELinux, setting up intrusion detection systems, and passing compliance audits can take several hours to properly tune. 

    Should I run hardening on an existing server or only on fresh ones?

    You should ideally harden a fresh Linux server before it is ever exposed to public internet traffic or connected to your production application stack. Applying strict firewall rules, altering permissions, and modifying SSH configurations on an existing server carries a high risk of breaking active application dependencies or accidentally locking yourself out. If you must harden an existing production server, thoroughly test the new security policies in a staging environment and ensure you have recent, verified off-site backups first.

    Does changing the SSH port actually improve security?

    Changing the default SSH port from 22 to a non-standard high port is a security-through-obscurity tactic that will not stop a determined, targeted attacker running a full port scan. However, it is still highly recommended because it drops automated botnet brute-force attempts by over 99 percent. This drastically cleans up your system authentication logs, reduces wasted CPU cycles, and prevents tools like Fail2Ban from being overwhelmed by background internet noise.

  • How to Fix the Cloudflare HTTP Error 526

    How to Fix the Cloudflare HTTP Error 526

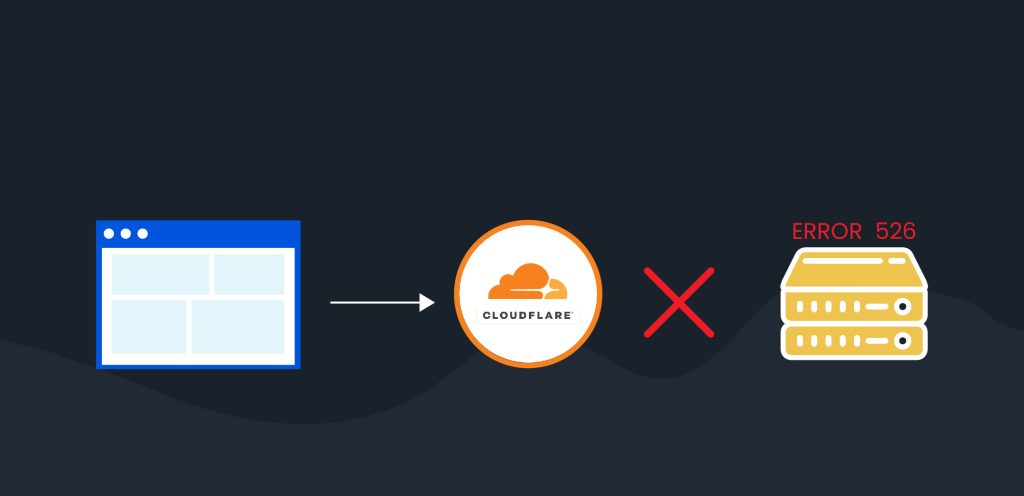
    If you’re seeing Cloudflare HTTP Error 526 (Invalid SSL Certificate) on your site, it means Cloudflare couldn’t verify the SSL certificate on your server. The result is that your visitors are blocked from accessing your website until it’s fixed.

    In this guide, we’ll show you how to fix the Cloudflare HTTP Error 526 step by step. You’ll learn what the error means, the most common causes, and the exact fixes you can apply on your RunCloud-managed server to get your site back online quickly and securely.

    Let’s get started!

    What Causes Cloudflare HTTP Error 526?

    The HTTP Error 526 is a specific error message generated by Cloudflare. It tells us that Cloudflare successfully connected to your origin web server (the server you manage with RunCloud), but it was unable to validate the SSL/TLS certificate presented by that server.

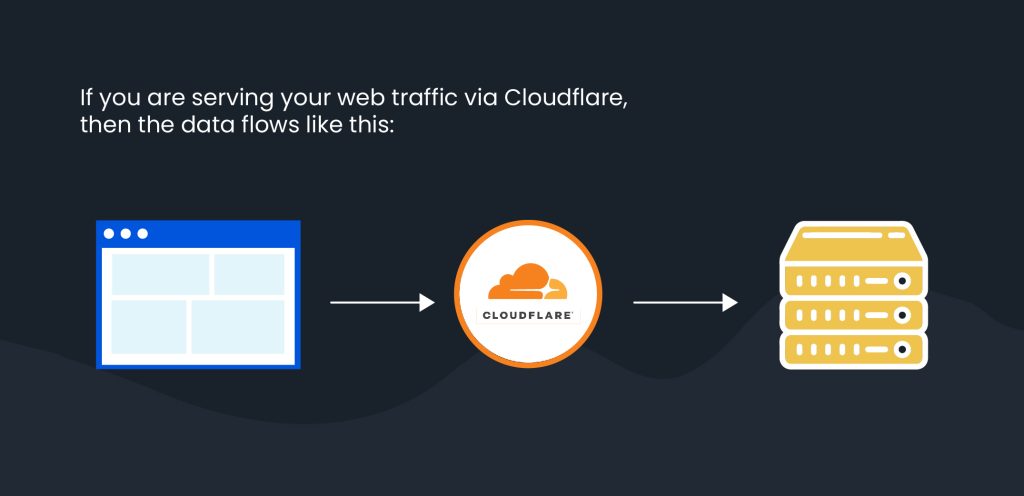
    Your Visitor → Cloudflare → Your RunCloud Server

    Your Visitor → Cloudflare → Your RunCloud Server

    The error occurs on the second leg of this journey, between Cloudflare’s network and your server. Cloudflare is acting as a security guard, and when it approached your server, the identification (the SSL certificate) was either missing, expired, or not from a trusted source.

    Cloudflare SSL/TLS Modes Explained (and How They Affect Error 526)

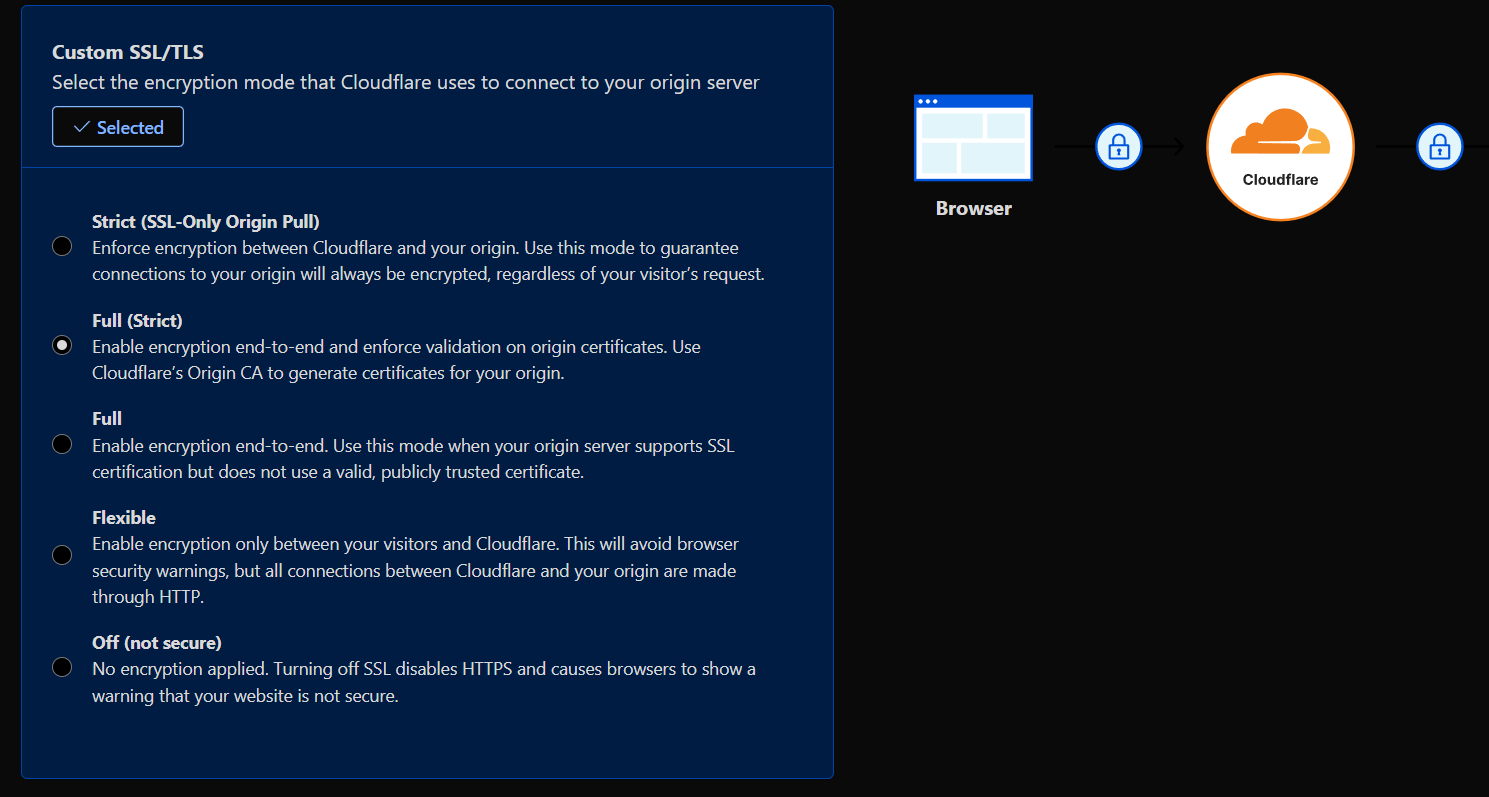
    The root cause of the Error 526 almost always lies within your Cloudflare SSL/TLS encryption settings. Cloudflare offers several ways to secure the connection to your server. The mode you have selected determines how strictly Cloudflare validates your server’s SSL certificate.

    You can find this setting in your Cloudflare dashboard under SSL/TLS > Overview:

    • Flexible: This mode encrypts traffic between the visitor and Cloudflare, but not between Cloudflare and your server. This is not the most secure method, but it is good enough for hobby sites.
    • Full: This mode encrypts the entire connection, but Cloudflare does not verify the identity of the SSL certificate on your origin server. It will accept an expired, self-signed, or unmatching CN/SAN entry for the requested hostname.
    • Full (Strict): This is a secure and recommended mode. It encrypts the entire connection and requires that your origin server has a valid, unexpired SSL certificate issued by a publicly trusted Certificate Authority (CA) such as Let’s Encrypt or Cloudflare’s own Origin server.

    The HTTP Error 526 occurs when your Cloudflare SSL/TLS mode is set to Full (Strict), but the certificate on your RunCloud server does not meet these strict requirements.

    Our goal is to fix the server’s certificate, not to downgrade this security setting.

    How to Fix Cloudflare HTTP Error 526: Step-by-Step Guide

    Follow these steps in order to diagnose and fix the problem efficiently.

    Step 1 – Check Your Cloudflare SSL/TLS Encryption Settings

    First, let’s be certain that the Full (Strict) setting is the trigger.

    1. Log in to your Cloudflare account and select your domain.
    2. Navigate to the SSL/TLS section from the left-hand menu.
    3. On the Overview tab, look for the SSL/TLS Encryption mode.
    4. Confirm that it is set to Full (Strict). If it is, proceed to the next step.

    Step 2 – Verify Your SSL Certificate on RunCloud

    Now, we need to inspect the SSL certificate that is installed on your server for the specific web application.

    Method A: Check SSL Certificates in the RunCloud Dashboard

    The RunCloud dashboard provides an easy way to check your SSL status.

    1. Log in to your RunCloud account and navigate to your server.
    2. Select Web Applications from the menu.
    3. Click on the name of the web application that is experiencing the error.
    4. In the application’s menu, click on SSL.

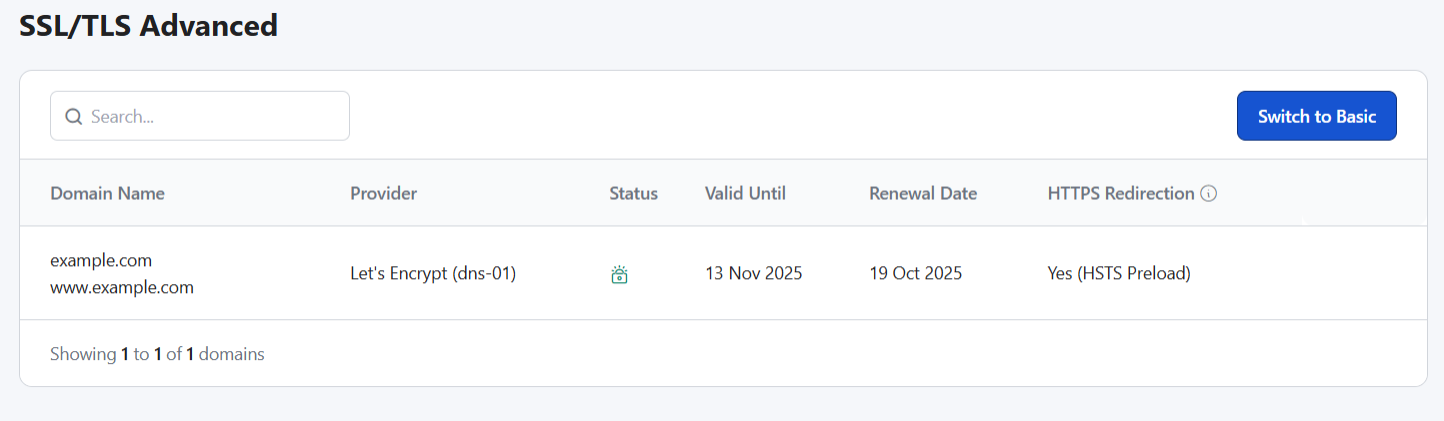
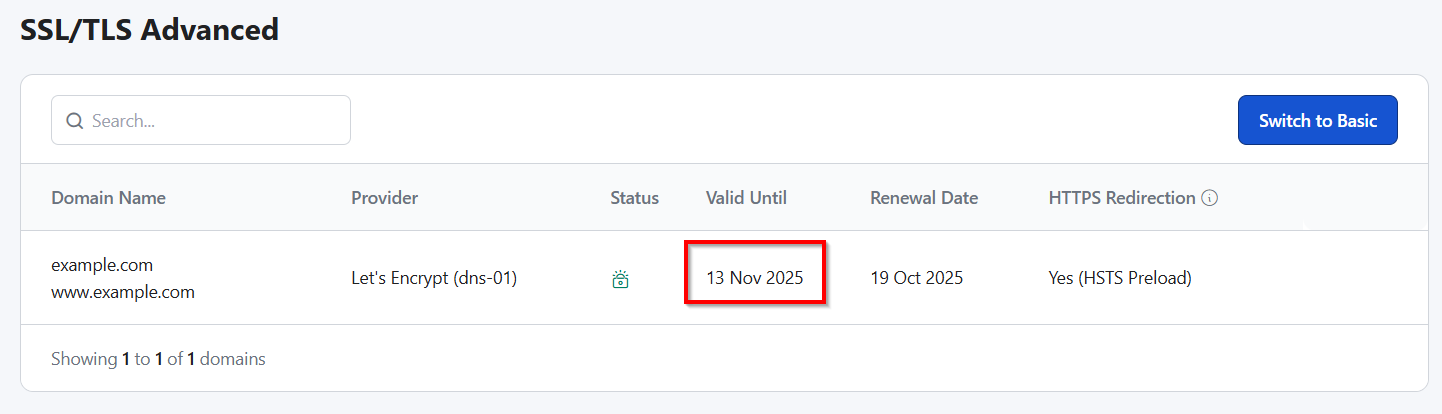
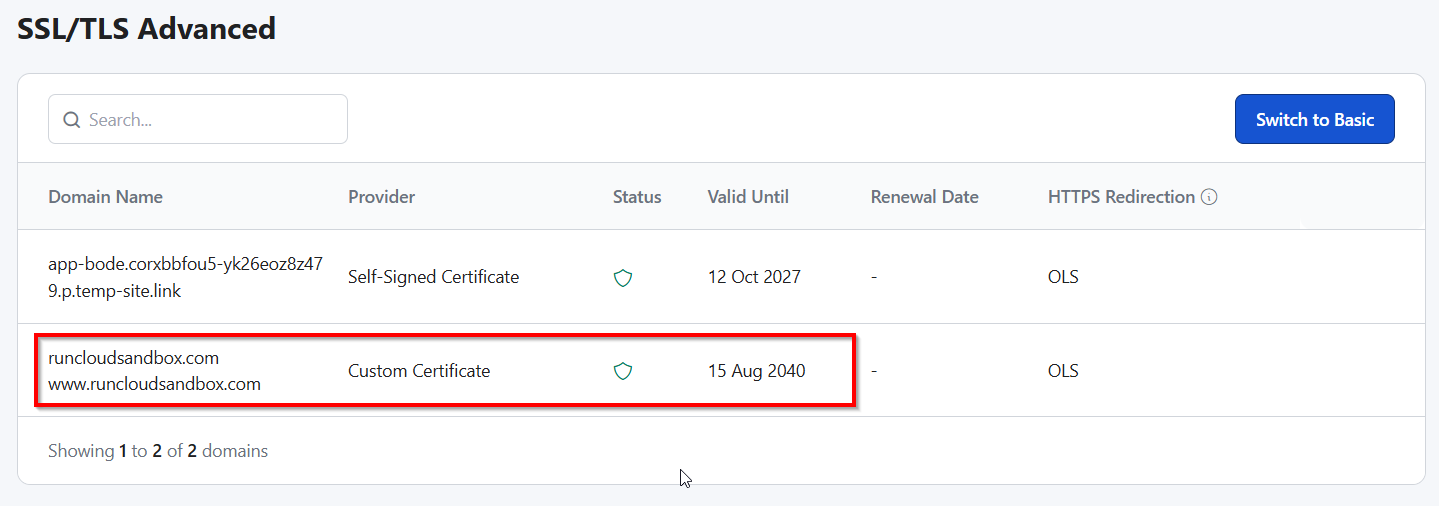
    Here, you will see the current SSL status. Pay close attention to the Provider, the Status (it should be “Active”), and the Valid Until date to ensure it has not expired.

    Method B: Check SSL Certificates with External Tools

    For a definitive, external check, you can use an online SSL checker or a command-line tool like openssl. These tools verify what the outside world, including Cloudflare, sees.

    Using the openssl command from your local terminal (replacing yourdomain.com with your actual domain and YOUR_SERVER_IP with your server’s IP address):

    openssl s_client -connect YOUR_SERVER_IP:443 -servername yourdomain.com

    In the output, look for the certificate details, including the “subject” (which should match your domain name) and the “notAfter” date (the expiration date).

    Step 3 – Fix Common SSL Certificate Issues Causing Error 526

    Based on what you discovered in Step 2, here are the most common scenarios and their solutions within RunCloud.

    Fix 526 Error: No SSL Certificate Installed

    If the RunCloud dashboard shows “No SSL Configuration” or an external check fails, you simply need to install a certificate.

    In the RunCloud SSL section for your web application, select Let’s Encrypt as the SSL Provider. Ensure your domain’s DNS is pointing correctly to the server, then click “Install SSL Certificate”. RunCloud will automatically provision and install a trusted certificate.

    Fix 526 Error: Expired SSL Certificate

    Let’s Encrypt certificates are issued with a 90-day validity period. RunCloud attempts to automatically renew your certificates well before they expire. However, this process can occasionally encounter issues, such as temporary DNS validation problems or other specific server conditions, which may prevent the renewal from completing successfully.

    If the automated renewal has failed, you can simply click the “Renew” button to trigger the process manually. This action immediately sends a new request to Let’s Encrypt to provision and install a valid certificate.

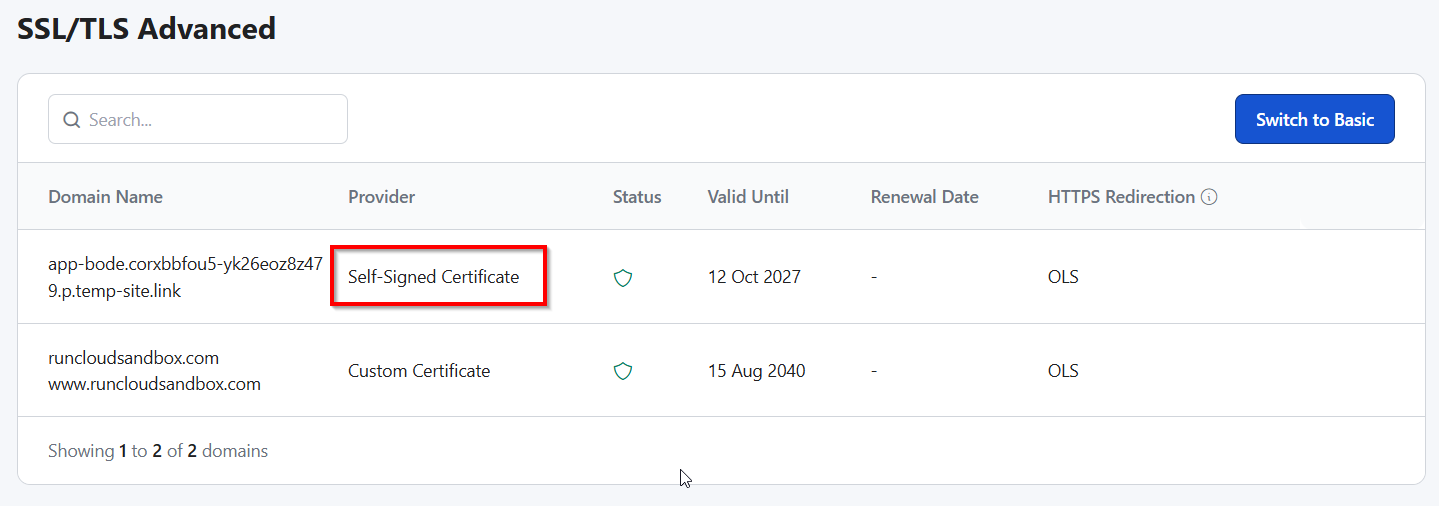
    Fix 526 Error: Self-Signed Certificate

    A self-signed certificate can be created by anyone and is used for testing within internal networks. Because it lacks external validation from a trusted third party, it cannot be automatically verified for authenticity.

    Therefore, when Cloudflare’s SSL/TLS encryption is set to the highly secure Full (Strict) mode, it will always reject a self-signed certificate and trigger the HTTP 526 error. The most secure and permanent solution is to replace the self-signed certificate with a certificate from a trusted authority.

    On the RunCloud platform, you can easily do this by removing the existing custom SSL configuration and using the integrated Let’s Encrypt functionality to install a valid, trusted certificate.

    Fix 526 Error: Certificate Name Mismatch

    This happens when the certificate does not cover all the hostnames for your site. For example, the certificate might only be for example.com, but visitors (and Cloudflare) are trying to reach www.example.com.

    When installing the Let’s Encrypt certificate in RunCloud, make sure to add all domain variations you use (e.g., both the root domain and the www subdomain) to the list of domains to be included in the certificate.

    Fix 526 Error: Incomplete SSL Certificate Chain

    A trusted SSL certificate relies on a “chain of trust,” which includes intermediate certificates linking your domain certificate back to a trusted root CA.

    This is rare when using RunCloud’s Let’s Encrypt integration, as it provides the complete chain. If you are installing a Custom SSL certificate from another provider, ensure you are pasting the entire certificate chain (often called fullchain.pem or a .crt file with multiple certificate blocks) into the “SSL Certificate” field, not just the single-domain certificate.

    Suggested Read: Fixing redirect loop on Cloudflare SSL

    Permanent Fix – Install a Cloudflare Origin Certificate

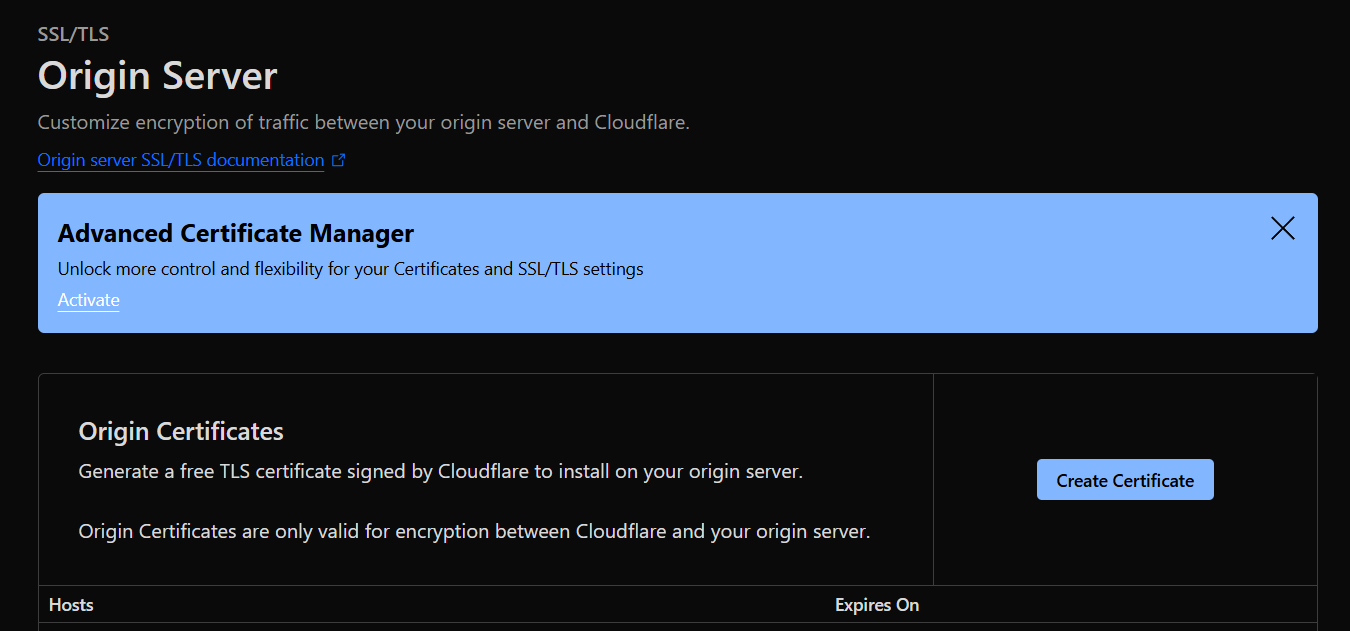
    If you want a permanent and guaranteed solution, you can use a Cloudflare Origin Certificate. This is a free, long-lasting certificate that you install on your RunCloud server. It is not publicly trusted, but it is specifically trusted by Cloudflare’s network, which resolves the 526 error perfectly.

    1. In Cloudflare, navigate to SSL/TLS > Origin Server.
    2. Click Create Certificate. Follow the prompts, leave all the values to default, and generate the certificate.
    Fixing HTTP error 526 with Cloudlfare origin certificate
    1. Cloudflare will show you an Origin Certificate and a Private Key. Copy both of these.
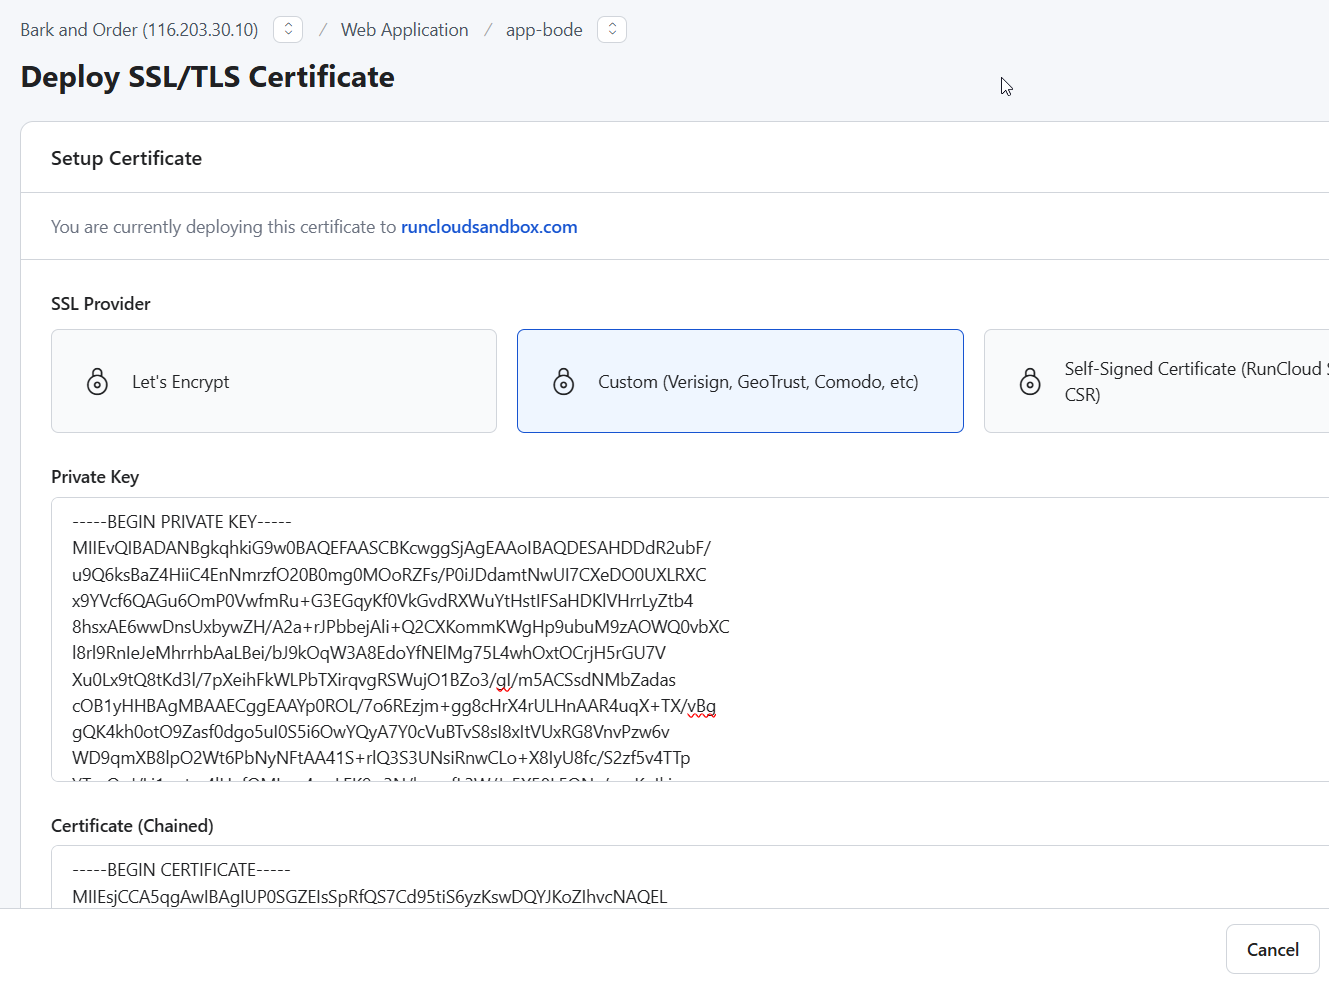
    2. In your RunCloud application’s SSL section, choose the Custom SSL option.
    3. Paste the Origin Certificate into the “Certificate” box and the Private Key into the “Private Key” box.
    1. Click Install SSL Certificate.

    Temporary Workaround – Switch to “Full” Mode in Cloudflare

    If your site is experiencing critical downtime and you need an immediate, temporary fix while you sort out the certificate issue, you can downgrade Cloudflare’s security.

    Go to Cloudflare > SSL/TLS > Overview and change the mode from Full (Strict) to Full.

    This will bring your site back online, but this is not a permanent solution.

    Downgrading your Cloudflare security exposes a potential security gap between Cloudflare and your server. Your top priority should still be to install a valid certificate on your server and switch back to Full (Strict) mode as soon as possible.

    Fix Cloudflare HTTP Error 526 with RunCloud

    The Cloudflare HTTP Error 526 is not a server crash, it’s a warning that your SSL setup isn’t fully trusted. With the right configuration, you can resolve it quickly and make sure it doesn’t come back.

    RunCloud makes SSL management simple.

    From one dashboard, you can install Let’s Encrypt, renew certificates automatically, or configure a Cloudflare Origin Certificate for long-term stability. That means less downtime, fewer SSL headaches, and a more secure experience for your visitors.

    Ready to fix Cloudflare errors and manage your servers with confidence? Start your free RunCloud trial today.

  • How to Fix the ERR_NETWORK_CHANGED Error in Chrome

    How to Fix the ERR_NETWORK_CHANGED Error in Chrome

    If you use Google Chrome regularly, you’ve probably encountered the dreaded ERR_NETWORK_CHANGED error at least once. One moment, your page is loading fine – the next, you’re staring at a cryptic message that stops you in your tracks.

    This error means Chrome has detected a sudden change in your internet connection. Maybe your Wi-Fi briefly dropped, you switched networks, or your VPN reconnected in the background. The good news is that it’s almost always easy to fix – and you don’t need to be a networking expert to do it.

    In this guide, we’ll walk you through how to fix the ERR_NETWORK_CHANGED error in Chrome. You’ll learn the most common causes, how to troubleshoot them step-by-step, and how to get back online in minutes. We’ll start with quick fixes anyone can try, then move to more advanced solutions if the problem persists.

    Let’s get started!

    What Causes the ERR_NETWORK_CHANGED Error?

    This error appears when Chrome loses track of its network route to a website. Even a split-second change in your internet connection can trigger it. Common causes include:

    • Unstable Wi-Fi Connection: Brief drops in signal or switching between your router’s 2.4GHz and 5GHz bands can interrupt Chrome’s connection.
    • Switching Between Networks: Moving from Ethernet to Wi-Fi, or from Wi-Fi to mobile data, forces Chrome to re-establish the connection.
    • VPNs and Proxy Servers: Connecting, disconnecting, or switching VPN servers (or having a proxy enabled without realizing it) alters your network path.
    • Waking Your Computer from Sleep Mode: Your device’s network adapter may take a moment to reconnect, during which Chrome shows the error.
    • Faulty Network Hardware: Loose cables, an ageing router, or a failing modem can cause intermittent drops.
    • Outdated or Corrupt Network Drivers: If your network adapter drivers aren’t working properly, you’ll experience more frequent connection issues.
    • DNS Cache Issues: An outdated or corrupted DNS cache can send Chrome to the wrong address.

    Knowing the cause helps you apply the right fix faster. Let’s go through the steps – starting with the quickest solutions that solve most cases.

    How to Fix the ERR_NETWORK_CHANGED Error in Chrome

    Now that you know what’s behind the ERR_NETWORK_CHANGED error, it’s time to fix it. We’ll start with quick, low-effort checks that solve most cases, then move into more targeted troubleshooting if the problem sticks around.

    Important Instruction: Start with Solution 1 and work your way down the list. One of the first few steps will likely solve your problem, so you won’t need to complete the guide.

    Step 1: Quick Fixes

    These first steps take less than a minute each and solve most ERR_NETWORK_CHANGED errors. Think of them as a quick reset – no settings changed, just a fresh connection.

    Solution 1: Reload the Page to Clear Temporary Connection Glitches

    Before you do anything else, try the simplest fix of all. The network change may have been a temporary hiccup that has already resolved itself.

    • Click the reload icon (the circular arrow) next to the address bar in Chrome.
    • Or, press Ctrl + R on your keyboard (or Cmd + R on a Mac).

    If the page loads, you’re all set! If the error reappears, move on to the next step.

    Solution 2: Restart Your Router and Modem to Refresh the Network

    Restarting your router and modem is one of the most reliable ways to fix network issues. This process clears your hardware’s temporary memory, which can get clogged with errors over time.

    1. Unplug Router: Unplug the power cords from both your modem (the device that brings the internet into your home) and your router (the device that creates your Wi-Fi network).
    2. Wait 60 Seconds: Leave them unplugged for at least a full minute. This ensures they fully power down and clear their memory.
    3. Test Your Connection: Once your computer reconnects to the Wi-Fi, try loading the webpage again.

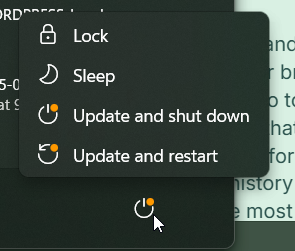
    Solution 3: Restart Your Computer to Fix System Connection Issues

    Your computer can also develop temporary glitches in its operating system or network services. A simple restart is a quick and easy way to fix them and start fresh.

    • For Windows: Go to the Start Menu, click the Power icon, and select Restart.
    • For macOS: Click the Apple logo in the top-left corner and select Restart….

    After your computer boots up, open Chrome and check if the error is gone.

    Step 2: Chrome-Specific Fixes

    If a simple restart didn’t help, the issue may be in Chrome’s stored data or your network configuration. These next steps dig deeper but are still safe and straightforward for any user.

    Solution 4: Clear Chrome’s Cache and Data to Remove Corrupt Files

    Chrome stores temporary data (cache and cookies) to help websites load faster. Sometimes, these files can become outdated or corrupt, especially after a network change, causing conflicts.

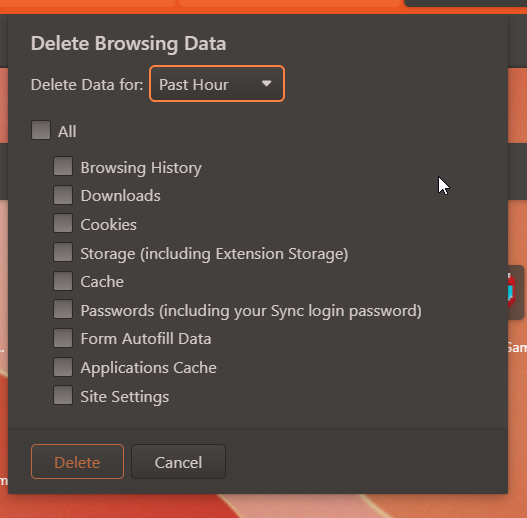
    1. Open Chrome and press Ctrl + Shift + Del on Windows or Cmd + Shift + Y on Mac to open the “Clear browsing data” window directly.
    2. Alternatively, go to Settings > Privacy and security > Clear browsing data.
    3. In the window that appears, set the “Time range” to All time.
    4. Check the box for “Cached images and files.” If you don’t want to be logged out of websites, leave “Cookies” and “Browsing history” unchecked.
    5. Click the Clear data button.

    Solution 5: Turn Off VPN or Proxy Server to Restore a Stable Connection

    VPNs and proxies change your network route, making them a primary suspect for this error. If you use a VPN, temporarily disconnect or quit the application completely. Then, try reloading the webpage. If the error is gone, the problem lies with your VPN’s connection or configuration. You may need to try connecting to a different server within your VPN app.

    Sometimes, a proxy can be enabled without you knowing.

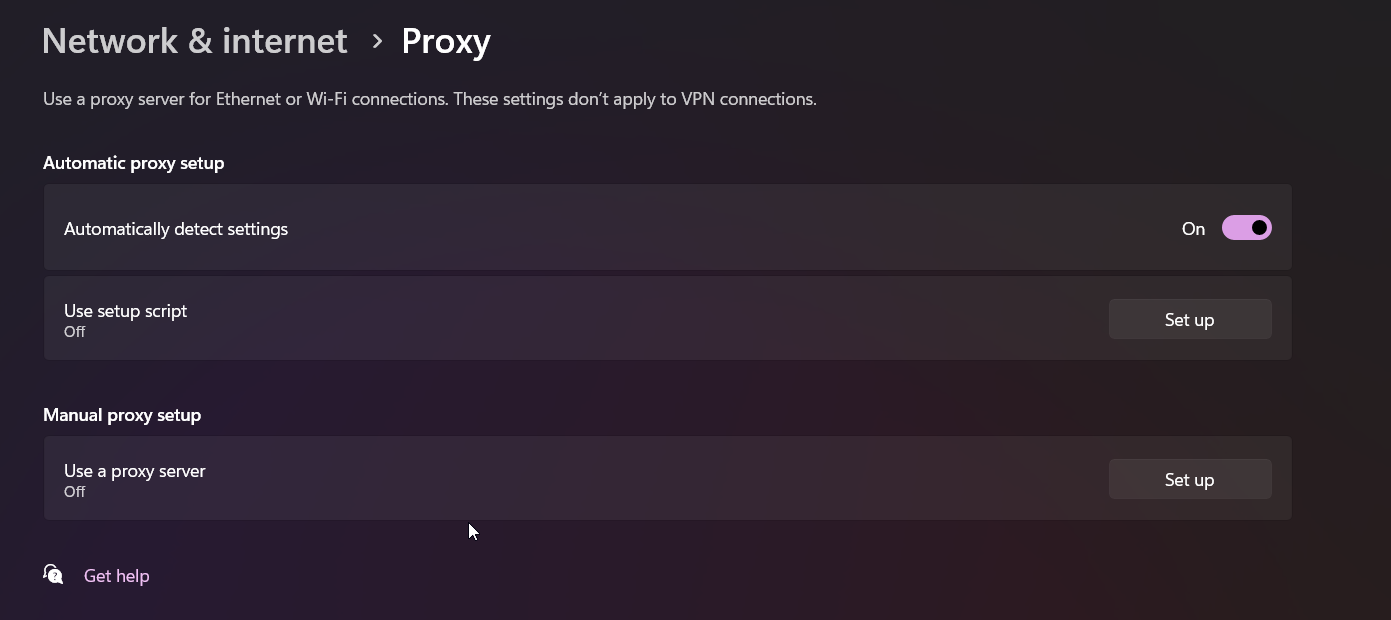
    • On Windows: Go to Settings > Network & Internet > Proxy. Make sure “Use a proxy server” is turned off.
    • On macOS: Go to System Settings > Network, select your Wi-Fi or Ethernet connection, click Details…, and then go to the Proxies tab. Make sure no proxies are checked.

    Suggested Read: Best Chrome Extensions to Protect your Privacy

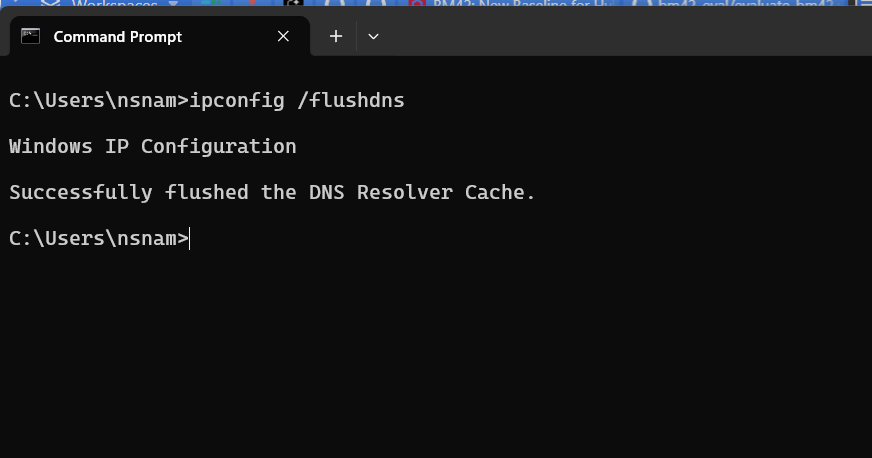
    Solution 6: Flush DNS and Reset Network Settings to Fix Address Conflicts

    This step sounds technical, but it only takes a single command in your computer’s terminal or command prompt.

    For Windows Users:

    1. Click the Start Menu and type cmd.
    2. Right-click on Command Prompt and select “Run as administrator.”

    Type the following command and press Enter:

    ipconfig /flushdns
    netsh winsock reset

    For macOS Users:

    1. Open the Terminal app (you can find it using Spotlight search with Cmd + Space).

    Copy and paste the following command and press Enter:

    sudo dscacheutil -flushcache; sudo killall -HUP mDNSResponder
    1. You will be prompted to enter your Mac’s password. Type it in and press Enter (you won’t see the cursor move, which is normal). The command will run and fix the issue.

    Step 3: Network and Hardware Fixes

    If you’re still seeing the error, the problem may be tied to your device’s core software or hardware. These last steps address driver issues and hardware faults that can cause persistent connection drops.

    Solution 7: Update Your Network Adapter Drivers to Improve Stability

    A driver is the software that lets your operating system communicate with hardware like your Wi-Fi card. An outdated or corrupt driver can cause all sorts of connection instability.

    • On Windows:
      1. Right-click the Start Menu and select Device Manager.
      2. Expand the “Network adapters” section.
      3. Right-click on your primary adapter (it will usually have “Wi-Fi” or “Ethernet” in the name) and select Update driver.
      4. Choose “Search automatically for drivers.” Windows will search for and install any available updates.
    • On macOS:
      Apple handles driver updates differently. They are bundled with system software updates. To ensure your drivers are current, simply check for a system update:
      1. Go to System Settings > General > Software Update.
      2. Install any available updates.

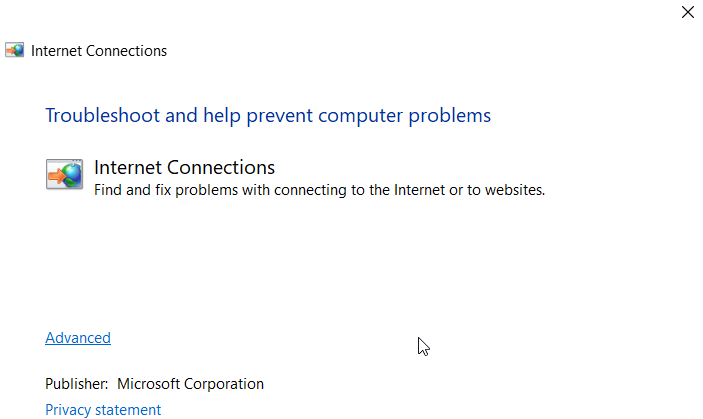
    Solution 8: Run the Windows Network Troubleshooter for Automatic Fixes

    For Windows users, there’s a built-in tool designed to automatically find and fix network problems. It’s a quick way to detect and fix issues automatically.

    1. Go to Settings > System > Troubleshoot.
    2. Click on Other troubleshooters.
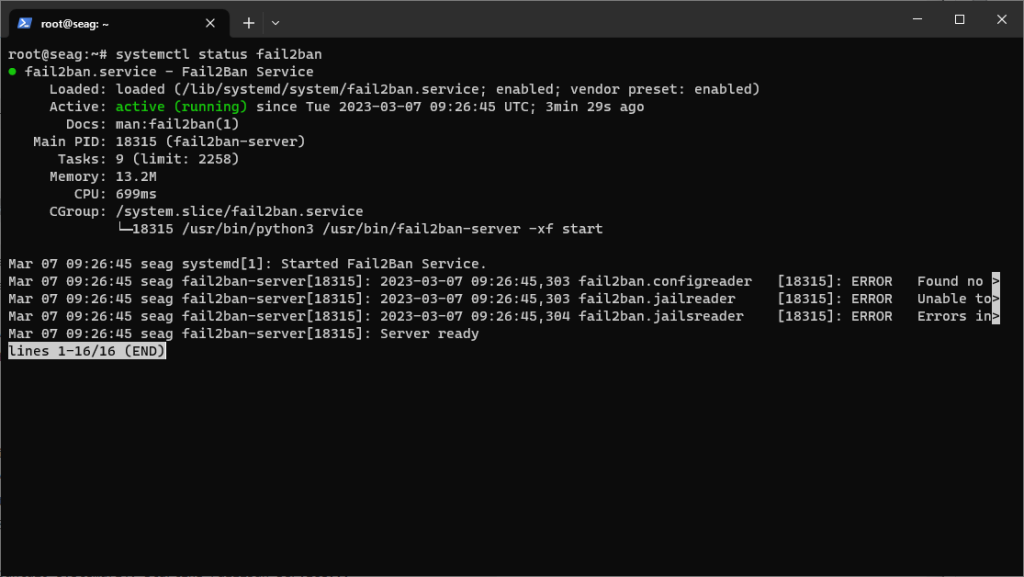
    3. Find the Network Adapter in the list and click the Run button next to it.
    4. Follow the on-screen prompts and let Windows attempt to diagnose and resolve the issue.

    Wrapping Up: Keep Chrome Connected and Avoid ERR_NETWORK_CHANGED in the Future

    The ERR_NETWORK_CHANGED error might interrupt your work, but fixing it is usually quick once you know where to start. Whether it’s a simple Wi-Fi hiccup, a VPN reconnecting, or a misconfigured setting, this guide should help you get Chrome back online fast.

    Of course, avoiding these interruptions starts with a stable, well-managed hosting environment – especially if you’re running WordPress sites for clients or your business.

    That’s where RunCloud comes in. It gives you a powerful, easy-to-use control panel for deploying, managing, and securing your WordPress sites on any cloud provider. You’ll spend less time troubleshooting and more time building and delivering projects without disruption.

    Take the hassle out of server management and keep your sites running smoothly.

    Start your free RunCloud trial today.

  • How to Fix the “Warning: Remote Host Identification Has Changed” SSH Error

    How to Fix the “Warning: Remote Host Identification Has Changed” SSH Error

    The WARNING: REMOTE HOST IDENTIFICATION HAS CHANGED! error will stop you dead in your tracks. Despite looking like your server is under attack, this message usually means SSH is working correctly, it’s just spotted something different about your server and wants you to know.

    This security check matters, but it can be frustrating when you just need to get back to work. The key is knowing when the error signals a real problem versus routine server maintenance.

    This guide covers everything you need to know: what causes the warning, how to tell if it’s dangerous, and how to fix it without compromising your server’s security. You’ll be able to handle this error confidently, whether you’re managing one server or dozens.

    Quick Fix (If You Know Your Server is Safe)

    Already certain this error came from recent server changes? Remove the old host key with this command:

    ssh-keygen -R your-server-hostname

    Just swap your-server-hostname for your actual server address. But before you run this, make sure you understand what’s happening. Blindly removing host keys can leave you vulnerable to attacks.

    What Does This Error Mean?

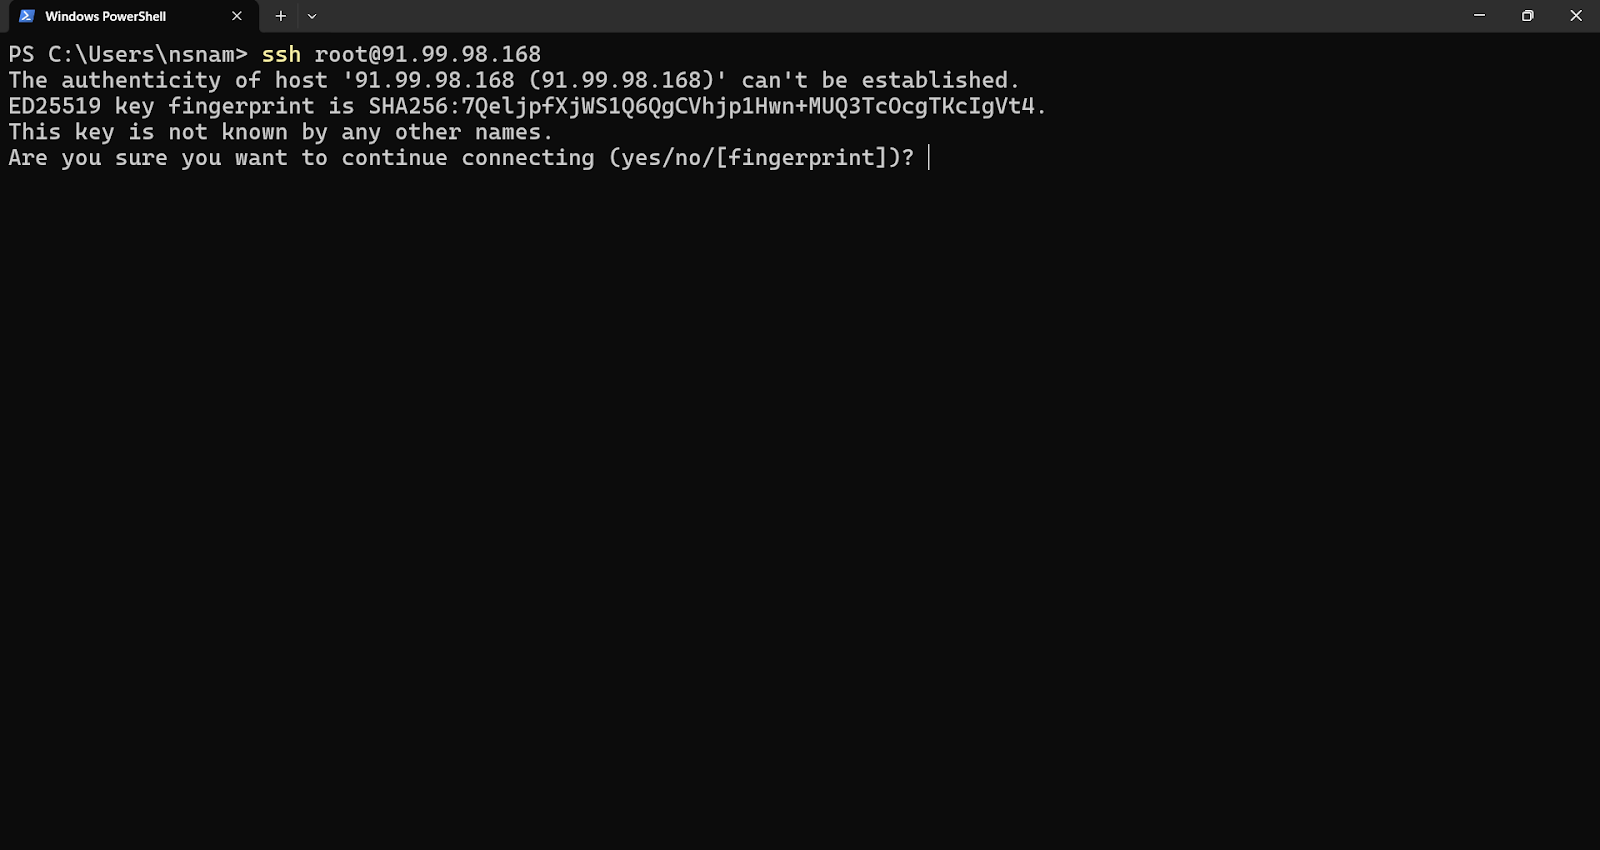
    To understand the error, you need to know how SSH establishes trust. The first time you connect to a new server, it presents its “public host key”, which is a unique identifier for that server. Your SSH client asks you if you trust this key.

    When you type ‘yes’, your computer saves this key and its associated hostname/IP address in a file located at ~/.ssh/known_hosts. This file acts as your personal “phonebook” of trusted servers.
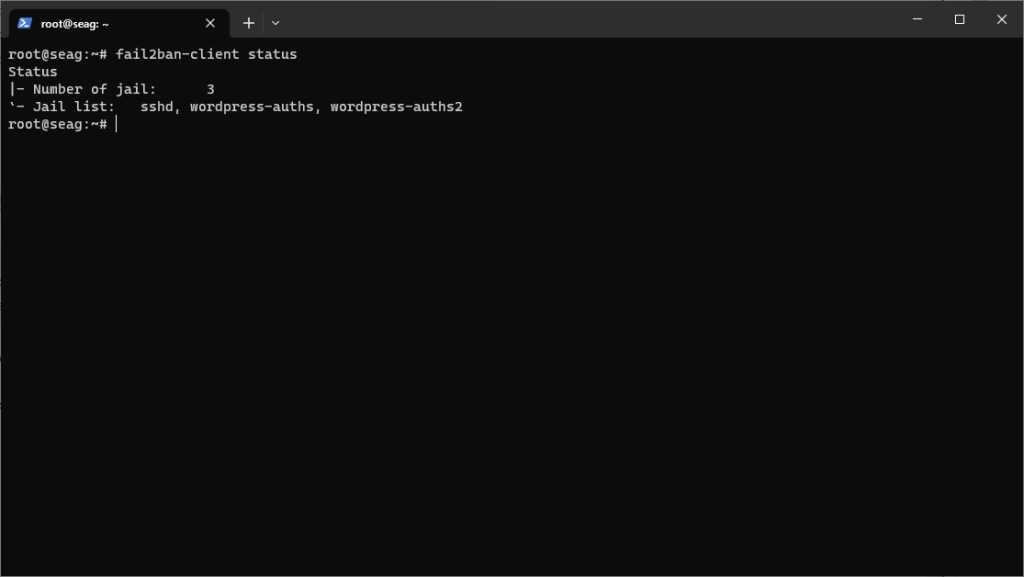
    From that point on, every time you connect, the server presents its key again. Your SSH client checks its known_hosts file and says, “Does the key this server is showing me match the key I saved for it last time?”

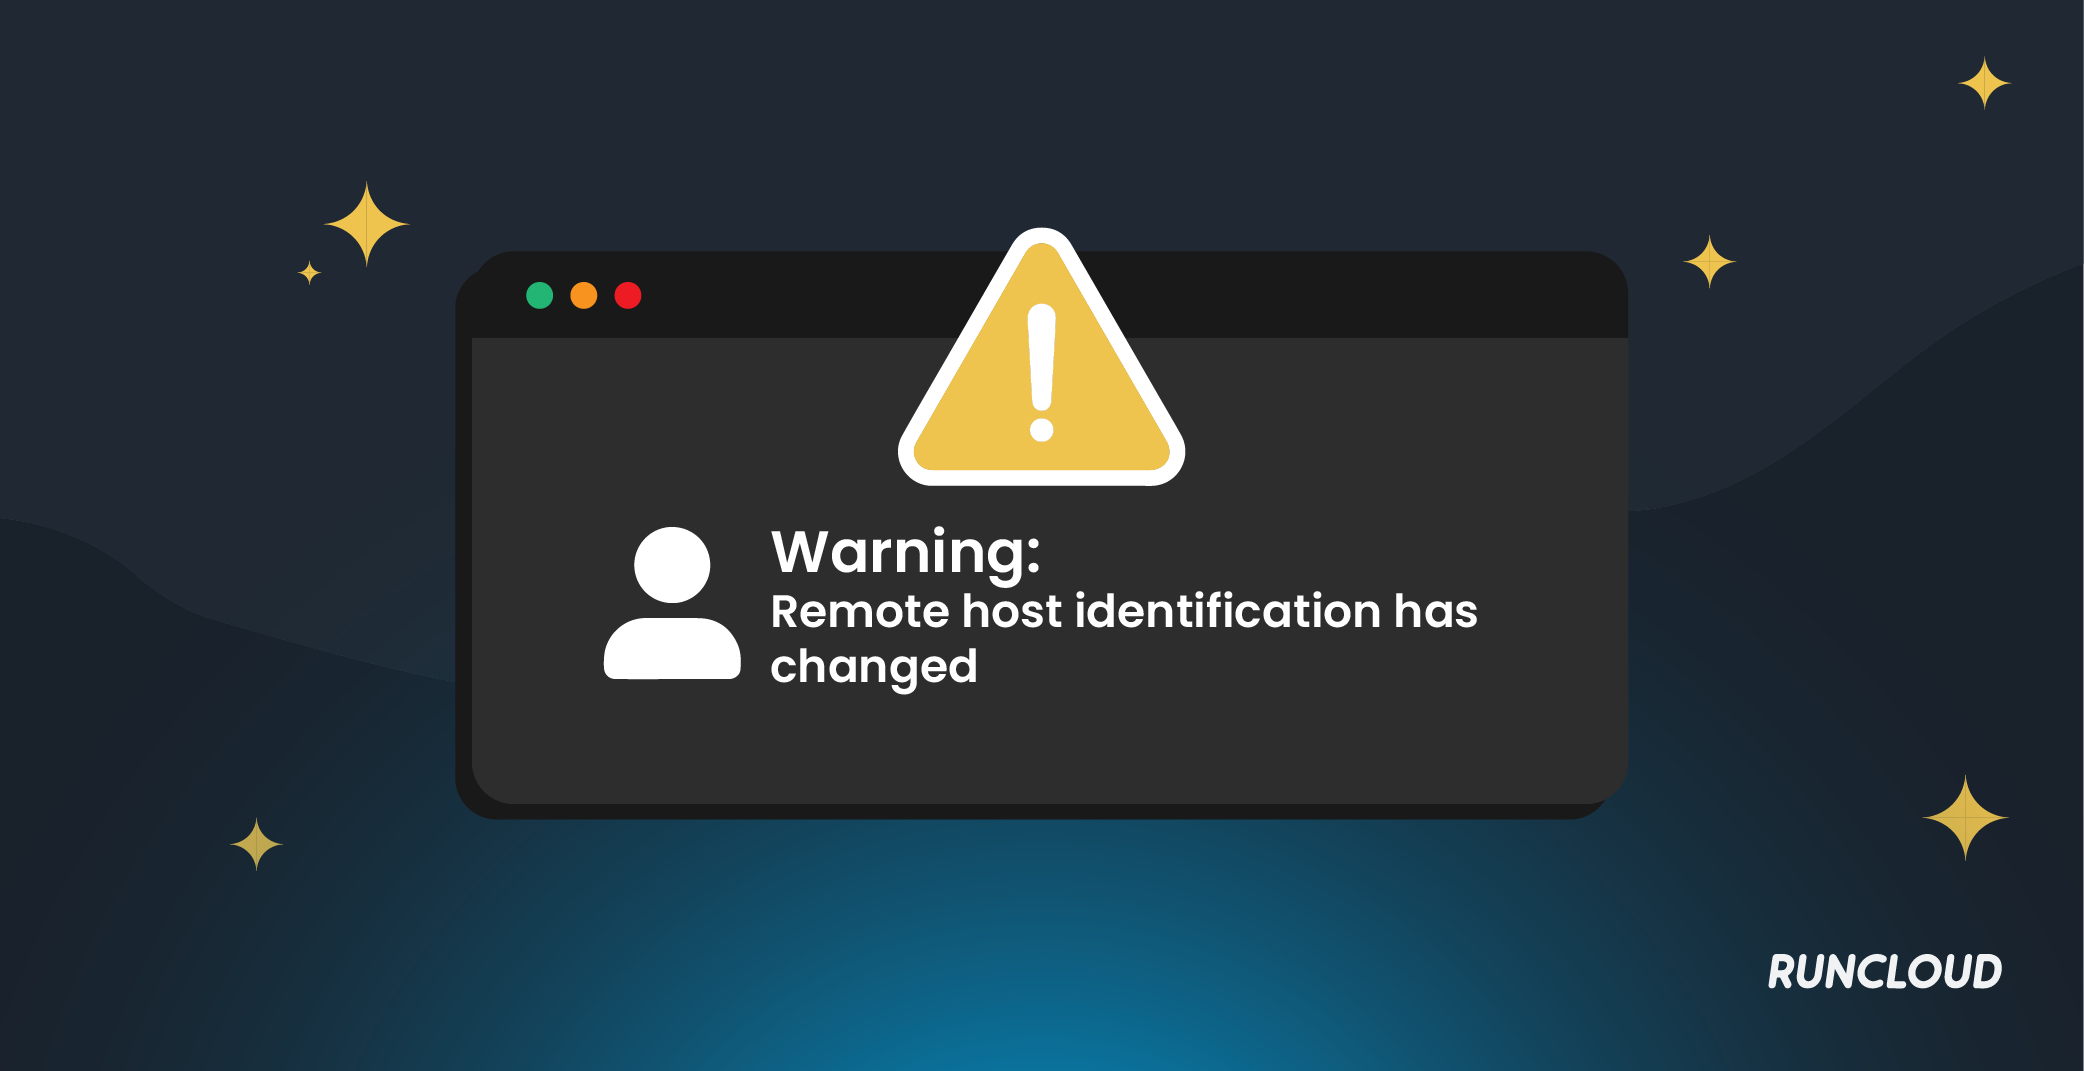
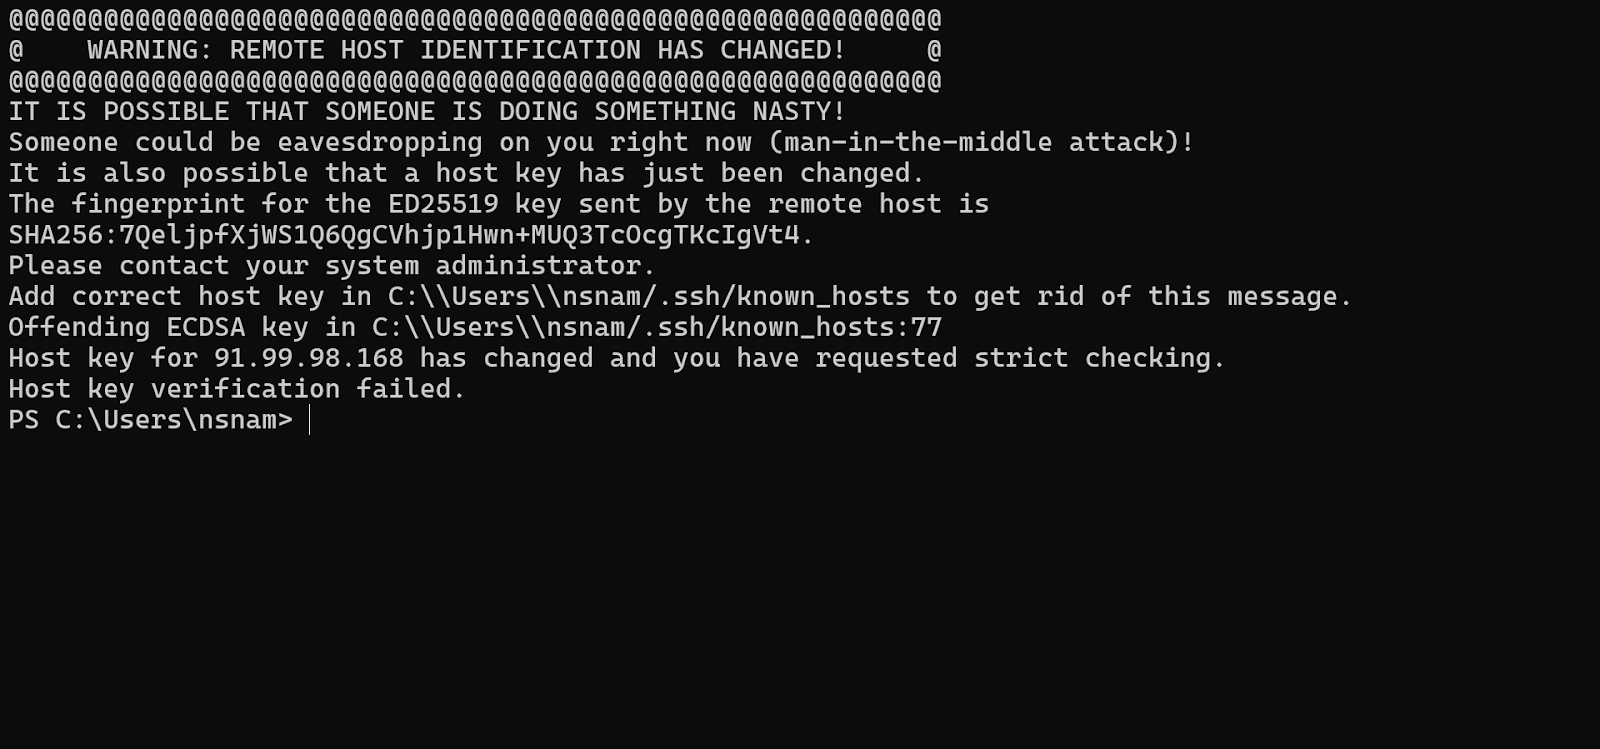
    The “Remote Host Identification Has Changed” error occurs when the answer is NO. The server is presenting a key your computer has never seen before.

    Remote Host Identification Has Changed

    Why Did the Host Key Change?

    More often than not, this error is caused by routine server administration, not a malicious attack. Here are the most common legitimate reasons:

    1. Server OS Reinstallation: If the server’s operating system (e.g., Ubuntu, CentOS) was reinstalled from scratch, the SSH service would have generated a new set of unique host keys. The old ones will have been wiped out with the old OS. This is the most frequent cause.
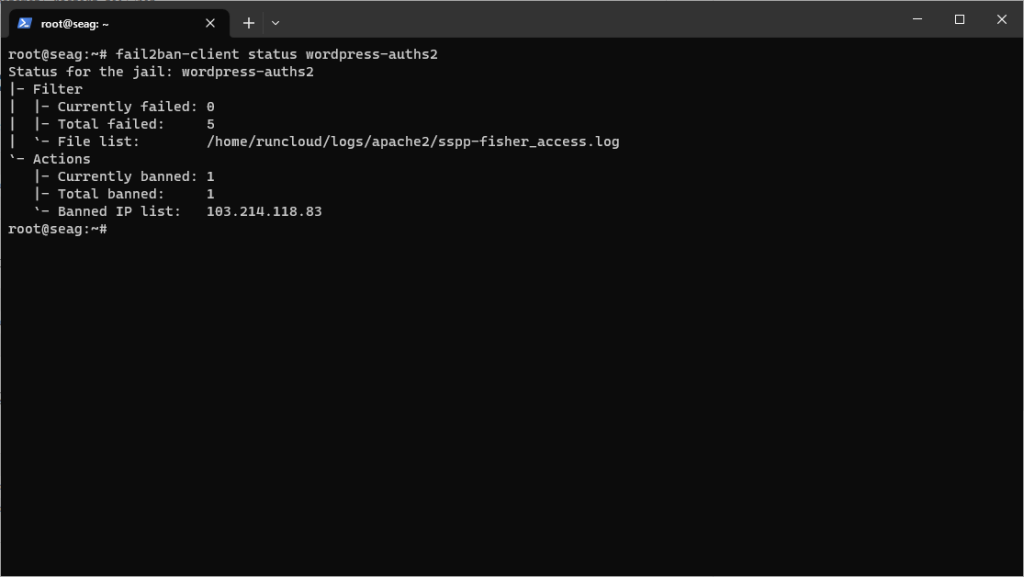
    2. Server Migration or Re-IP: The IP address you are connecting to may have been reassigned. For example, the old server 123.45.67.89 was decommissioned, and a brand new server was spun up and given the same IP address.
    3. Cloud/Virtualization Environments: In cloud environments like AWS, GCP, or Azure, virtual server instances can be terminated and replaced. The new instance will have a different host key, even if it has the same IP address or hostname.
    4. Load Balancers: If you connect to a hostname behind a load balancer, your connection might be routed to a different server in the pool from the one you connected to last time. You’ll see this error if the servers don’t share the same host key.
    5. Deliberate Key Regeneration: A system administrator may have intentionally regenerated the server’s SSH keys for security policy reasons.

    The Man-in-the-Middle (MITM) Attack

    Although this is usually a benign warning, the error’s primary purpose is to protect you from a Man-in-the-Middle (MITM) attack. Here’s how an MITM attack works in this context:

    1. You try to connect to your legitimate server.
    2. An attacker, positioned somewhere on the network between you and the server (e.g., on the same public Wi-Fi), intercepts your connection request.
    3. The attacker blocks your connection to the real server and instead presents their own fake SSH server to you.
    4. Your SSH client sees a new, unexpected host key and throws the “REMOTE HOST IDENTIFICATION HAS CHANGED” error.

    If you ignore this warning and proceed, you will send your password or other credentials directly to the attacker’s machine, completely compromising your account. This is why you must verify the cause before you implement any fix.

    How to Safely Fix the Error: The “Verify, Then Remove” Protocol

    Follow these steps to resolve the issue without compromising your security.

    Step 1: VERIFY the New Host Key

    This is the most important step. Do not proceed until you have confirmed the new key is legitimate.

    • If you are not the server administrator: Contact the person or team that is and ask them if the server’s host key was recently changed. They should be able to confirm if this is the case, and even provide you with the new key’s fingerprint.
    • If you are the server administrator: You must get the new key’s fingerprint directly from the server console.
      • Log in to the server using an alternative method (e.g., the web console provided by your cloud provider, like AWS EC2 Connect, GCP Console, or a direct KVM/IPMI connection in a data center).
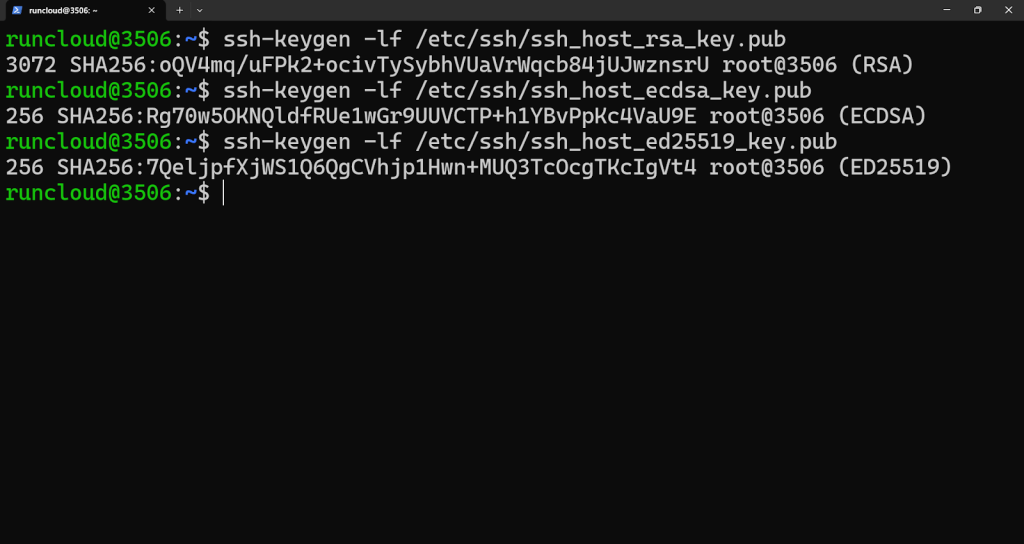
      • Once logged in, run the following commands to display the fingerprints of the server’s host keys. A server usually has several key types (RSA, ECDSA, ED25519).
    # Run these on the remote server you're trying to connect TO (not on your personal laptop)
    ssh-keygen -lf /etc/ssh/ssh_host_rsa_key.pub
    ssh-keygen -lf /etc/ssh/ssh_host_ecdsa_key.pub
    ssh-keygen -lf /etc/ssh/ssh_host_ed25519_key.pub

    Compare this fingerprint with the one your local SSH client shows you in the error message. If they match, you have successfully verified the new key is authentic.

    Step 2: REMOVE the Old Host Key from known_hosts

    Once you’ve verified the new key’s authenticity, you can safely remove the old, conflicting key from your local ~/.ssh/known_hosts file. The ssh-keygen command has a specific function for removing hosts.

    On your local machine (the one you are connecting from), run the following command, replacing your-server-hostname with the actual hostname or IP address from the error message:

    ssh-keygen -R your-server-hostname

    Open the file with your favorite text editor:

    nano ~/.ssh/known_hosts

    Go to the line number mentioned in the error and delete that entire line. The line will start with the hostname or IP address. Save the file and exit the editor.

    Step 3: Reconnect and Accept the New Key

    Now that the old key is gone, try your SSH connection again. You will be prompted to accept the new key as if you were connecting for the first time. Since you have already verified its fingerprint, you can confidently type ‘yes’.

    Conclusion

    In this post, we have seen that the “Warning: Remote host identification has changed” error is an important security mechanism that is doing its job. By following the steps in this article, you can confidently handle this common issue while ensuring your connections remain secure.

    Managing servers and deploying new web applications can be challenging, especially if you are unfamiliar with Linux and the command line.

    That’s why we built RunCloud.

    With RunCloud, you can deploy and manage your web applications, databases, and firewalls directly from an intuitive dashboard, completely sidestepping common issues like the “Remote Host Identification Has Changed” error.

    Sign up for RunCloud today and experience hassle-free web server management.

    FAQs About the SSH Host Key Warning

    What does “Warning: Remote host identification has changed” actually mean in simple terms?

    This means your computer’s security system no longer recognizes your server. The first time you connected, your laptop saved a unique “fingerprint” for that server. Now, the server shows a different fingerprint.
    With RunCloud, you rarely need to connect to your server with SSH to manage your web applications, databases, or firewall. The RunCloud dashboard provides a secure, visual interface for all these tasks so that you can sidestep this error completely.

    Is this error a virus, or am I being hacked?

    Probably not! While the warning is designed to protect you from a “man-in-the-middle” attack, the most common cause is a harmless server change. For instance, if your hosting provider reinstalled the operating system on your server, a new, perfectly safe fingerprint would have been created.

    How do I fix this error quickly? I’m in a hurry!

    If you’re sure the server is safe, the fastest fix is to tell your computer to forget the old fingerprint. You can do this by running a single command on your local machine (not the server):
    ssh-keygen -R your-server-ip-or-hostname   
    Replace your-server-ip-or-hostname with your server’s actual address. After you run this, you can connect again and be asked to approve the new fingerprint.

    Why would the server’s fingerprint change? I didn’t do anything!

    This is very common, especially in cloud hosting environments. Here are a few reasons it can happen:
    The server’s operating system was reinstalled or upgraded.
    You moved your site to a new server with the same IP address as the old one.
    Your cloud provider (like AWS, DigitalOcean, etc.) replaced the underlying virtual machine.

  • How to Fix the “Safari Can’t Establish a Secure Connection to the Server” Error

    How to Fix the “Safari Can’t Establish a Secure Connection to the Server” Error

    Have you ever tried to open your bank, favorite store, or work portal – only to be stopped by this message?

    “Safari Can’t Establish a Secure Connection to the Server.”

    It’s frustrating, vague, and can block you completely – on a Mac, iPhone, or iPad.

    But what does this error mean?

    This guide explains what’s happening behind the scenes when Safari shows this message and gives you a step-by-step checklist to fix it. Whether the problem lies with your device or the website’s server, you’ll leave with a clear path to restore access.

    Let’s start by understanding why this error happens in the first place.

    What Causes the “Safari Can’t Establish a Secure Connection to the Server” Error?

    When you visit a website on your browser, your computer encrypts the data so no one else on your network can read it. This encryption is done using a TLS/SSL handshake. If any part of this process fails, Safari will terminate the connection and display this error to protect you from potentially insecure communication.

    The causes can range from a simple misconfiguration on your device to a serious problem with the website’s server.

    In this article, we will proceed with troubleshooting in a logical order, from the most common and simplest fixes to more advanced, system-level solutions.

    Let’s get started!

    Common Fixes to Solve the Secure Connection Error

    If you encounter the “Can’t Establish a Secure Connection to the Server” error, you should begin your troubleshooting process with these steps. The following solutions are entirely safe and non-destructive to your data and will successfully resolve the “secure connection” error in most situations.

    1. Verify the Website Address and Reload the Page

    The most straightforward fix is often to check the website’s domain name. Carefully check the URL in Safari’s address bar for any typos. A single misspelled character in a website’s domain name can direct your browser to an entirely different server or a server that does not possess a valid security certificate for the address you intended to visit, immediately triggering this security error.

    If the web address is correct, the next step is to perform a “force reload” of the page. You can accomplish this by pressing the Cmd + R key combination on your keyboard or by clicking the reload icon in the address bar. This action instructs Safari to discard any temporary data stored for the page and request a completely fresh copy from the server. This can resolve transient network hiccups or minor glitches that may have interrupted the initial connection.

    safari can't establish a secure connection

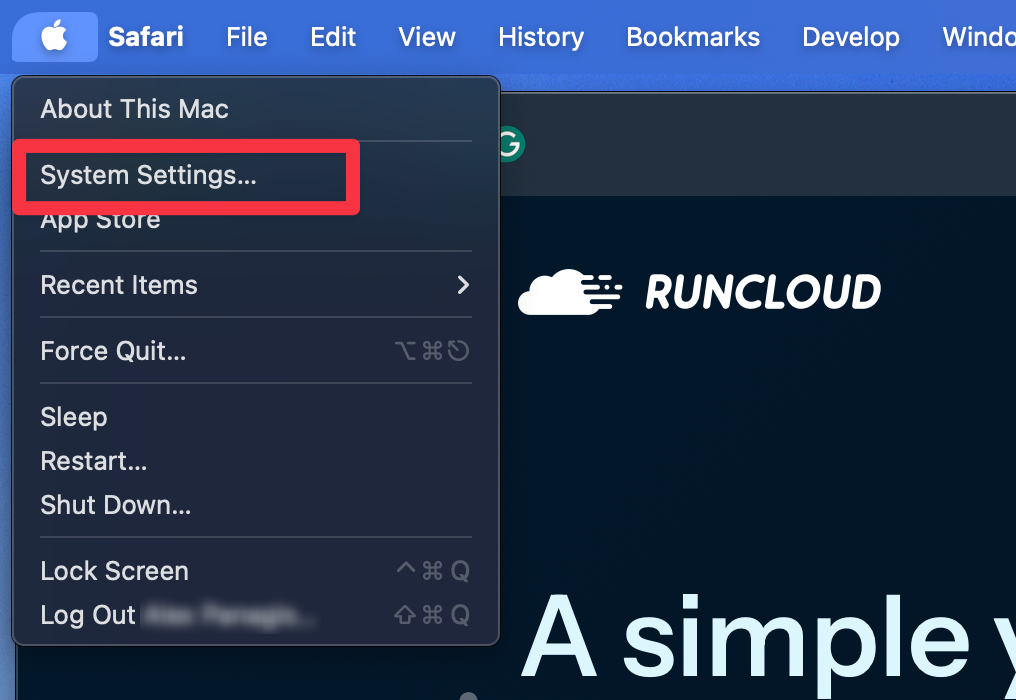
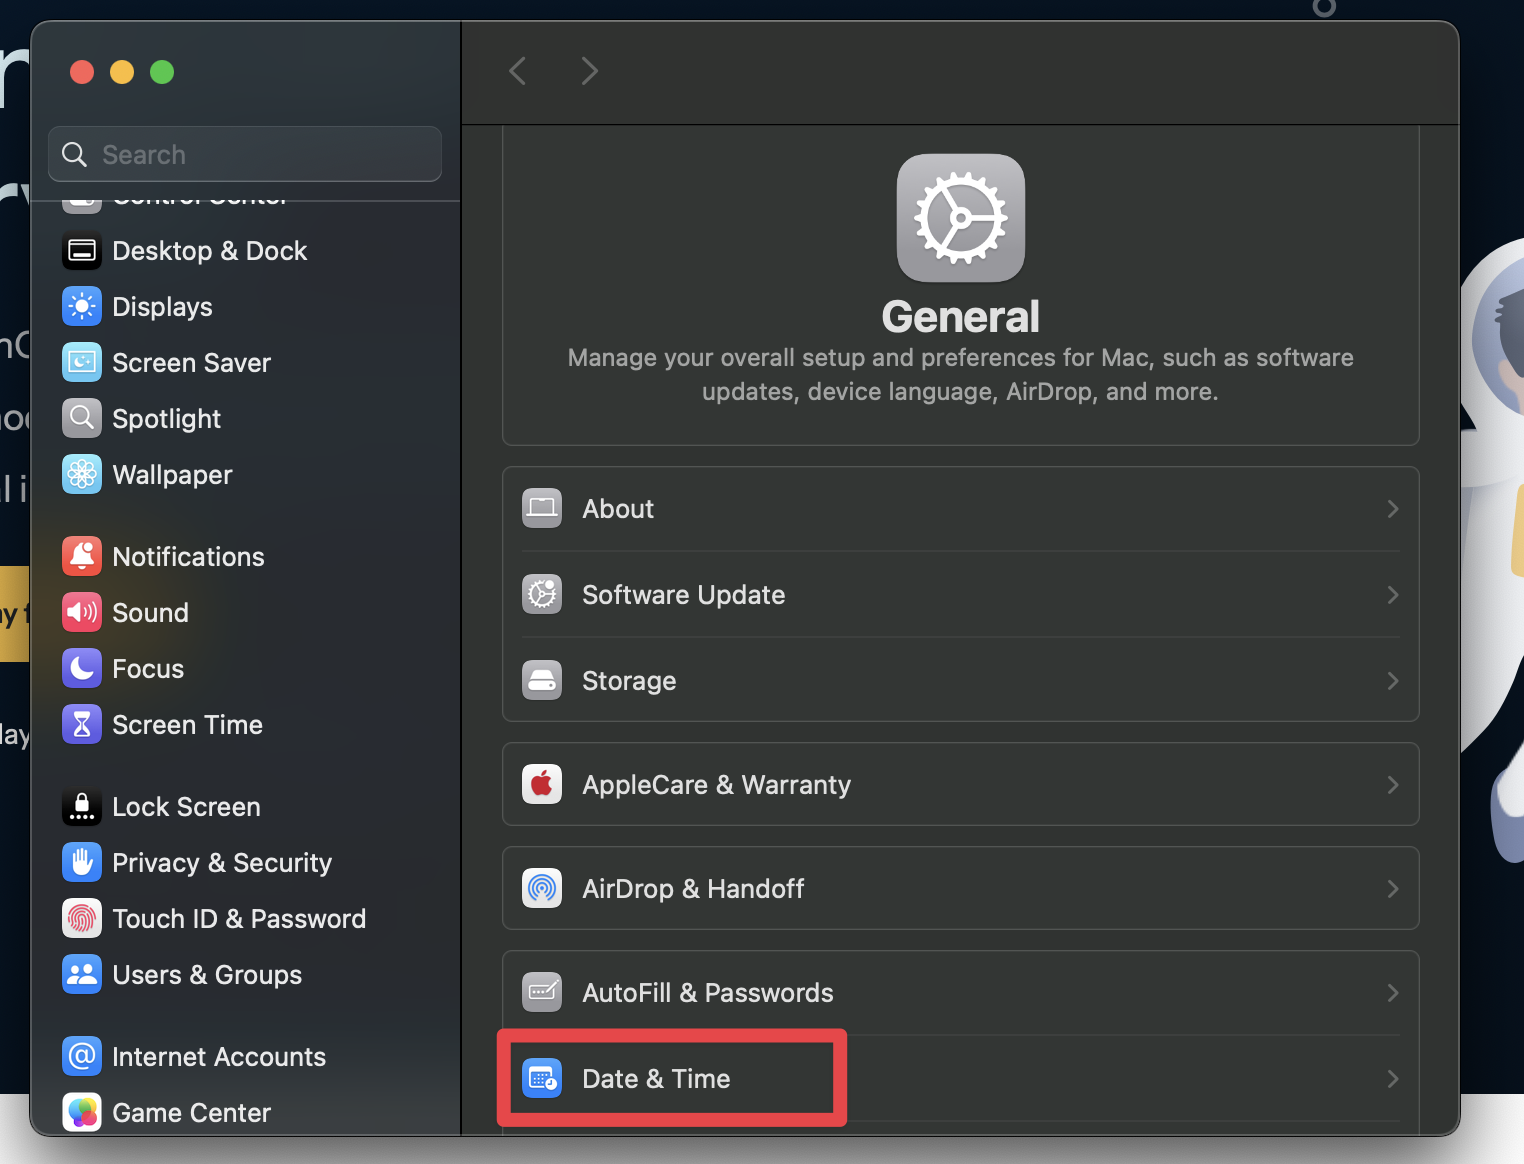
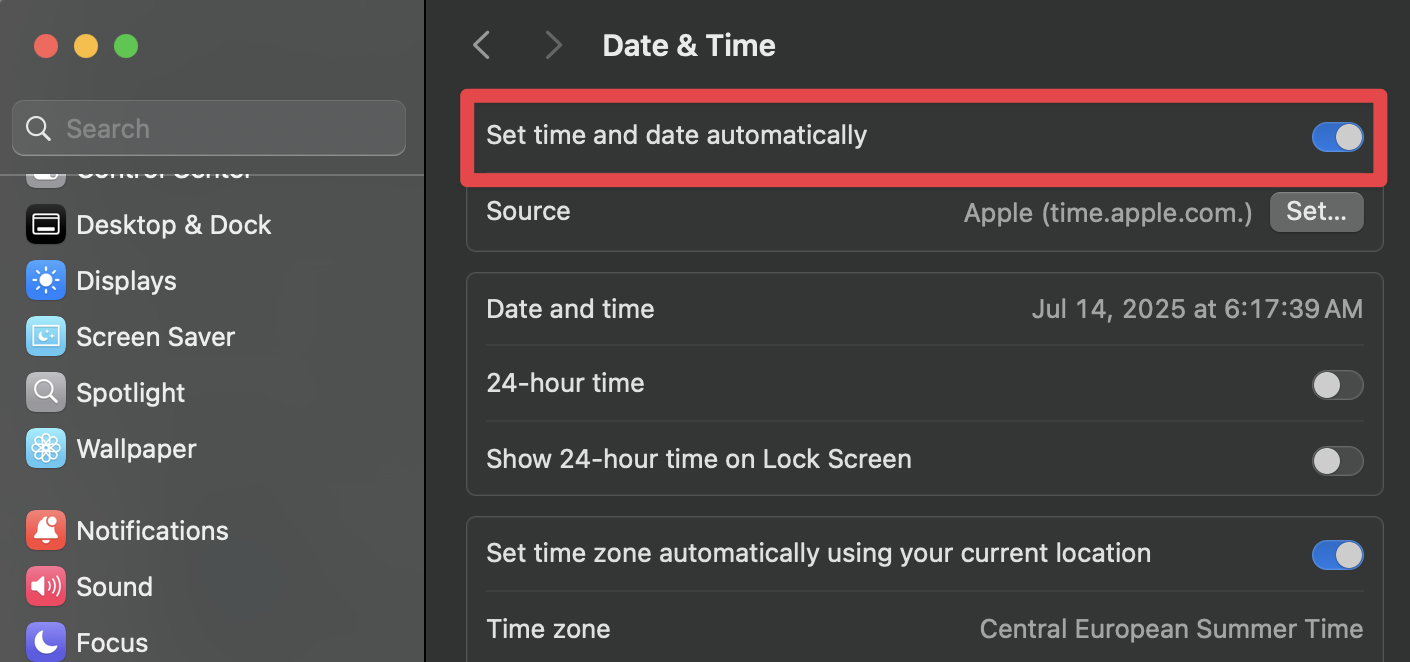
    2. Check and Correct Your System’s Date & Time

    An incorrect date or time setting on your computer or mobile device is the most frequent culprit behind this connection error. Secure browsing depends on accurate system time.

    Secure websites use SSL/TLS certificates that are only valid for a specific period, which includes a defined start date and an expiration date. If your device’s clock is set to a date and time outside this valid range, Safari will correctly determine that the website’s certificate is invalid. As a security precaution to protect your information, Safari will refuse to establish the connection.

    To resolve this, you should configure your device to automatically set its date and time using Apple’s reliable network time servers.

    How to Fix on macOS (Ventura & later):

    1. Navigate to the Apple menu in the top-left corner of your screen and select System Settings.
    1. Click General in the sidebar, then choose the Date & Time option on the right.
    1. Ensure the toggle switch next to “Set time and date automatically” is in the ‘on’ position.
    1. Make sure the server is set to time.apple.com or another reliable source.

    How to Fix on iOS / iPadOS:

    1. Open the Settings application from your Home Screen.
    2. Tap on General, and then select Date & Time.
    3. Verify that the toggle for “Set Automatically” is enabled, which allows your device to sync its time with the cellular or Wi-Fi network.

    3. Test the Issue Using a Private Window

    To determine whether the connection error is caused by your browser’s stored data or extensions, you should try opening the website in a private Window. A Private Window creates a temporary, isolated browsing session that acts as a “clean slate.” Safari doesn’t use your browsing history, cookies, or cached data in a Private Window.

    Additionally, it disables all third-party browser extensions you may have installed, such as ad blockers, security tools, or shopping assistants. Creating this clean environment allows you to test whether one of these components interferes with the secure connection process.

    To perform this test, follow these instructions:

    1. With Safari open, go to the File menu at the top of your screen and select New Private Window. Alternatively, you can use the keyboard shortcut Shift + Cmd + N.
    2. A new, dark-themed Safari window will appear, indicating you’re in Private Browsing mode.
    3. In the address bar of this new private window, type or paste the website URL that was previously failing and press Enter.

    Now, carefully observe the result, as it will tell you exactly where to look for the problem:

    • If the website loads successfully in the Private Window: This confirms the problem is within your Safari profile. It confirms that the issue lies within your regular Safari profile and is caused by corrupted website data (cache or cookies) or an interfering browser extension. You should now proceed directly to Step 4 to clean up this data.
    • If the error message appears again in the Private Window: This tells you that the problem is unrelated to your browser’s data or extensions. The cause is deeper, likely related to your device’s network settings, system-wide configurations, or an issue on the website’s server. In this case, you can skip the next step and move on to Network-Level Troubleshooting.

    4. Clear Corrupted Website Data (Cache & Cookies)

    If your test in Step 3 was successful, this step usually resolves it. Over time, the data that Safari stores to make websites load faster (the cache) and remember your login sessions (cookies) can become corrupted or “stale.” This outdated information can conflict with a website’s server when it tries to establish a new, secure connection.

    We will first try a targeted approach, which is highly recommended as it will not log you out of other websites.

    How to Clear Data for a Single Site (Recommended Method):

    This removes data just for the affected site, leaving your data for all other sites untouched.

    1. Open Safari and click on Safari in the menu bar at the top of the screen, then select Settings (or Preferences on older macOS versions).
    1. In the Settings window, navigate to the Privacy tab. This section controls how Safari handles website tracking and stored data.
    1. Click the button labeled Manage Website Data…. This will open a new window showing all the websites that have stored data on your computer.
    2. In the search bar in the corner of this window, type the name of the website causing the error (e.g., “example.com”).
    1. Select the website from the list and click the Remove button.
    2. Click Done. To ensure the changes take full effect, quit Safari (Cmd + Q) and reopen it. Now, try accessing the website again.

    How to Clear All Browser History and Data (Use if the Targeted Method Fails):

    If removing the data for the specific site did not work, you can take a more drastic step. This action will remove your browsing history and sign you out of all websites you are currently logged into.

    1. In the Safari menu bar, click History, then select Clear History… from the bottom.
    2. A small dialog box will appear. Click the dropdown menu next to “Clear” and select all history.
    1. Click the Clear History button to confirm. This action comprehensively removes all history, cookies, and cached data from Safari.
    2. After the process is complete, try visiting the website one more time.

    Network-Level Troubleshooting

    If the fixes mentioned above didn’t work, the problem may lie in your network configuration or filtering software. Follow these steps to continue the troubleshooting process

    5. Disable VPN, Antivirus, or Firewall Software

    If you are using any third-party security and network software that intercepts your network traffic to scan it. Then this “man-in-the-middle” position can sometimes interfere with the delicate TLS handshake.

    1. Temporarily disable active VPN clients, antivirus programs (like Norton, Avast, McAfee), or third-party firewalls.
    2. Quit and restart Safari completely.
    3. Try visiting the site again.

    These network security applications install their own “root certificates” to decrypt and inspect your traffic. If their software is outdated or misconfigured, it can break the connection to legitimate sites. If disabling one of them fixes the issue, you need to update that software or adjust its “SSL/TLS Inspection” settings.

    6. Change Your DNS Servers

    A Domain Name System (DNS) server is like the Internet’s phonebook. A slow, unreliable, or misconfigured DNS server can cause connection failures. These DNS issues can sometimes lead to routing problems or timeouts before the secure connection is established.

    Most ISPs use their own DNS server to analyze and predict network traffic patterns, but these servers are sometimes poorly maintained, making them unreliable. If you use a custom DNS server, consider switching to a public DNS server such as Google DNS, Cloudflare, or Quad9, which are fast, reliable, and highly secure.

    How to Change DNS on macOS:

    1. Go to Apple menu > System Settings > Wi-Fi.
    2. Click the Details… button next to your active network connection.
    3. Select the DNS tab from the sidebar.
    1. Click the + button and add the following servers:
      • 8.8.8.8 (Google)
      • 1.1.1.1 (Cloudflare)
      • 9.9.9.9 (Quad9)
    2. Click OK.

    How to Change DNS on iOS / iPadOS:

    1. Go to Settings > Wi-Fi.
    2. Tap the i (info) icon next to your network.
    1. Scroll down and tap Configure DNS.
    1. Select Manual, then Add Server to enter 8.8.8.8 and 1.1.1.1. Remove any old entries.
    2. Tap Save.

    Advanced System-Level Solutions

    Please proceed with the following steps, fully understanding that they involve changes to your core operating system.

    7. Update macOS and Safari to the Latest Version

    One of the most useful steps to resolve secure connection errors is to ensure your entire operating system is up-to-date. A modern, secure website server may refuse to communicate with a browser that uses older, deprecated security protocols (like early versions of TLS), because older protocols are now blocked for security reasons. Updating your OS is the only way to ensure Safari can “speak” this language’s latest and most secure version.

    Newer operating systems also include the latest version of the Apple Trust Store. It is a verified list of all the global organizations (Certificate Authorities) trusted to issue legitimate SSL/TLS security certificates. If a website is using a certificate from a newer authority that isn’t on your outdated list, Safari will be unable to verify its authenticity and will block the connection.

    Therefore, when you perform a software update, you not only get security patches and new features but also refresh Safari’s core components and directory of trusted entities.

    To check for and install updates on your Mac:

    1. Navigate to the Apple menu in the top-left corner of your screen and select System Settings.
    2. Click on General in the sidebar, and then choose Software Update.
    3. Your Mac will automatically check for available updates. If one is found, follow the on-screen prompts to download and install it.

    To update your iPhone or iPad:

    1. Open the Settings app, go to General, and tap on Software Update.
    2. Your device will check for and allow you to install any pending updates.

    8. Inspect Keychain Access for Problematic Certificates (For Advanced Users)

    Warning: This is a highly advanced troubleshooting step and should only be attempted if you are comfortable navigating core system utilities.

    Your Mac’s Keychain Access is a secure digital vault that stores all your passwords, private keys, and security certificates. Occasionally, a manually installed, expired, or corrupted certificate within this vault can create a conflict that blocks a secure connection to a specific website. This is particularly common if you have previously installed a “self-signed certificate” for a local development server or a corporate network, as these can sometimes interfere with public web traffic.

    Keychain Access is the heart of your Mac’s security. Deleting the wrong certificate (especially a “root” certificate) can cause widespread connection failures across multiple applications and websites. Therefore, you should only proceed if you strongly believe a specific certificate is the cause.

    To carefully inspect and remove a rogue certificate:

    1. Open Spotlight Search by pressing Cmd + Space, Keychain Access, and Enter.
    2. Once the application is open, focus on the “Keychains” panel at the top left. Select the System keychain, which contains certificates that affect all users on the Mac.
    3. In the bottom-left “Category” panel, click on Certificates to filter the main window’s view.
    4. You will now see a list of all system-level certificates. Carefully scan this list for any entries related to the website you are having trouble with. Pay close attention to any certificates marked with a red ‘X’ icon, as this is a clear visual sign that macOS considers them expired or untrusted.
    5. If, and only if, you locate a certificate that you are confident is the source of the problem (e.g., an expired certificate for that specific domain), you can attempt to remove it. Right-click on the certificate and select Delete.
    6. Enter your admin password to confirm the change. After deleting it, quit and restart Safari to see if the issue is resolved.

    Check A Different Website

    If you have tried everything above and the error persists on only one specific website, the problem is likely on the server’s end. This can be due to any of the following reasons:

    • Expired SSL Certificate: This is the most common server-side cause. The website owner forgot to renew their certificate.
    • Insecure Protocol Support: The server might be using an old, insecure version of TLS (like TLS 1.0 or 1.1), which Safari now blocks by default.
    • Certificate Name Mismatch: The certificate was issued for www.example.com, but the server is shop.example.com.
    • Incomplete Certificate Chain: The server isn’t providing the necessary intermediate certificates for Safari to establish trust.

    How to Verify a Server-Side Problem:

    You can use a third-party SSL checker tool to verify if the problem persists on the server itself. Go to a site like SSL Labs’ SSL Test or Security Headers and enter the hostname of the website you can’t access (e.g., www.example.com). The tool will run a deep analysis of the server’s configuration. It will give you a grade (A+ to F) and point out specific errors like expired certificates or weak protocol support.

    If the test reveals a problem, your only recourse is to contact the website’s administrator and inform them of the issue.

    Final Thoughts

    This guide covered the main causes behind the “Safari Can’t Establish a Secure Connection to the Server” error. By following the steps outlined above, you should be well-equipped to identify and resolve the issue from your end. For most users, these solutions will restore secure access to the websites you need.

    However, if you are a website owner or server administrator who has landed here while scratching your head over this error on your own domain, you know firsthand that hosting a secure server is no easy task. Even small mistakes can cause downtime and frustrate users, directly impacting your credibility and business. This is precisely why RunCloud has built solutions to eliminate these complexities.

    RunCloud provides a powerful server management panel that works with any cloud provider you choose, such as DigitalOcean, AWS, or Google Cloud. Its platform features a fully automatic SSL integration that deploys and renews Let’s Encrypt certificates without any manual intervention, ensuring you never have to worry about an expired certificate again.

    Additionally, its integrated DNS manager simplifies the once-complex task of pointing your domains correctly, preventing the configuration errors that often lead to secure connection failures.

    Prevent Errors Like This with RunCloud

    If you’re managing your own server or building websites for clients, errors like “Safari Can’t Establish a Secure Connection” are more than just frustrating – they’re a sign that something’s misconfigured. In many cases, these issues are caused by expired SSL certificates, DNS errors, or mismanaged server settings.

    RunCloud makes all of this easier.

    • Automatic SSL: RunCloud issues and renews Let’s Encrypt certificates automatically – no manual setup, no downtime, no security warnings.
    • Integrated DNS Manager: Configure domains properly with built-in tools that reduce errors and streamline deployment.
    • User-friendly interface: Manage everything through a clean, modern panel – no need to log in to the terminal just to tweak settings or fix issues.
    • Works with any cloud provider: Use RunCloud with DigitalOcean, AWS, Google Cloud, and more.

    If you’re tired of manually fixing preventable problems – or worried your users might be seeing connection errors without your knowledge – it’s time to take server management seriously.

    Get started with RunCloud – and keep your websites fast, secure, and always available.

  • Server Cache vs. Browser Cache vs. Site Cache: What’s the Difference?

    Server Cache vs. Browser Cache vs. Site Cache: What’s the Difference?

    Slow websites lose visitors. If your store or site takes more than a couple of seconds to load, people leave – and they don’t come back.

    That’s where caching comes in.

    In this guide, we’ll break down the three main types of website caching:

    • Server cache
    • Browser cache
    • Site (or page) cache

    You’ll learn what each one does, how they work together, and why they matter for speed and stability. We’ll also show how tools like RunCloud Hub for WordPress make it easier to manage caching without diving into server configs.

    Let’s get into it.

    What is Caching?

    When a server handles a request, it often needs to process multiple database queries and calculations before responding. This works fine for occasional access, but with repeated requests, it wastes time and server resources by doing the same work repeatedly.

    Caching speeds up performance by storing copies of frequently used data in fast-access memory. Instead of regenerating the same content on every request, the server or browser checks the cache first and serves the stored version if available.

    On websites, this cached data can include anything from images and stylesheets to entire web pages or database query results.

    📖 Suggested read: NGINX Caching for WordPress – Complete Guide & Tutorial

    What is Server Cache?

    Server cache refers to various caching mechanisms implemented directly on the web server or dedicated caching servers in front of the origin server. This type of caching reduces the server’s processing load by storing the results of computationally expensive operations or frequently requested content.

    For instance, if generating a dynamic web page requires multiple database queries and complex calculations, the server can cache the final HTML output of that page.

    When another user requests the same page, the server can deliver the pre-generated cached version almost instantly, without re-executing all the backend processes.

    Other examples of server caching include opcode caching (storing precompiled script code), object caching (storing frequently used data objects like database query results), or CDN caching (where geographically distributed servers cache static assets closer to users). This significantly improves the server’s capacity to handle more traffic and delivers content faster.

    With RunCloud, you can enable server-side caching quickly by installing RunCloud Hub, which includes powerful options like FastCGI and object caching for WordPress.

    Read more about caching in our blog post titled How to Easily Optimize Your WordPress Website With RunCloud Hub.

    📖 Suggested read: Which is Better: Redis Full-Page Cache or NGINX FastCGI Caching?

    What is Browser Cache?

    Browser caching helps speed up return visits to a site by storing common files, like logos, styles, and scripts, directly in the user’s browser. Instead of downloading them again every time, the browser loads them from local storage.

    This process dramatically speeds up page loading times for subsequent visits because fetching files from local storage is much faster than retrieving them online. It also reduces bandwidth consumption for both the user and the web server.

    Website administrators can influence browser caching behavior by setting appropriate HTTP headers (like Cache-Control and Expires) on their server responses, telling browsers how long they should keep specific files cached.

    📖 Suggested read: Everything You Need to Know About WordPress Object Caching

    What is Site Cache (Page Cache)?

    Site cache, often called page cache, is a type of server-side caching that stores fully rendered HTML pages. When a user requests a page, instead of the server dynamically generating it by querying databases, processing templates, and running scripts every single time, it can serve a static HTML copy directly from the cache. This approach is particularly beneficial for content that doesn’t change frequently for every user, such as blog posts, product pages, or informational pages.

    For example, if a popular news article is requested, the server might generate it once, store the complete HTML page in its cache, and then serve that same static file to thousands of subsequent visitors. This bypasses almost all server-side processing, leading to incredibly fast load times and significantly reducing server resource usage.

    📖 Suggested read: How to Use Redis Full-Page Caching to Speed Up WordPress

    Server Cache vs. Browser Cache vs. Site Cache: Key Differences

    Here’s how the three main types of cache compare, based on what they store, where they’re kept, and how they help your site perform better:

    Feature

    Browser Cache

    Server Cache

    Site Cache (Page Cache)

    Storage LocationOn the individual user’s computer (within their web browser)On the web server itself or on intermediary caching servers (e.g., CDNs, reverse proxies)On the web server
    What is StoredStatic assets (images, CSS, JavaScript files, fonts)Frequently requested data, database query results, pre-compiled script code, object data, page fragmentsFully rendered HTML pages (what the user sees in the browser)
    Primary BenefitSpeeds up subsequent page loads for the specific user by loading assets locally; reduces bandwidth for repeat visitsReduces the processing load on the origin server; accelerates responses by serving pre-computed or frequently accessed dataDelivers pre-built pages almost instantaneously; bypasses most server-side processing (database queries, PHP execution) for the cached page
    Who Primarily BenefitsThe individual returning userAll users accessing the siteAll users requesting a cached page

    📖 Suggested read: The Best WordPress Caching Plugins To Speed Up Your Site (2025)

    Which Cache Type is Best for WordPress?

    For WordPress sites, page caching (also called site caching) usually gives the biggest performance boost. WordPress dynamically builds each page by running PHP scripts and querying the database, even for content that doesn’t change. Page caching skips all that by storing a fully rendered HTML version of the page and serving it instantly.

    This alone can cut load times dramatically.

    Browser caching is another must-have. It stores static assets, like logos, stylesheets, and scripts, directly in the visitor’s browser. That means repeat visits feel faster, and your server uses less bandwidth.

    For high-traffic or more dynamic sites, you can go further by enabling object caching – a type of server cache that stores the results of frequent database queries in memory using tools like Redis or Memcached. This reduces the load on your database and speeds up dynamic page generation.

    When used together, these caching layers improve speed, reduce server resource use, and keep your site stable under load.

    📖 Suggested read: LiteSpeed Cache WordPress Plugin Configuration Tutorial

    When Should You Use Each Type of Cache?

    • Use browser caching on all websites to store static assets – logos, stylesheets, JavaScript, and fonts – that rarely change. This significantly speeds up page loads for returning visitors and reduces server bandwidth.
    • Server cache (in various forms) is essential for any dynamic website to reduce server load and improve user response times.
    • Use page cache (a type of site cache) for frequently accessed pages that are identical or very similar for most users, such as blog posts, informational pages, or product category pages.
    • For highly dynamic elements or user-specific content (like a shopping cart or personalized dashboard), more granular server caching, like object caching (for database query results) or fragment caching (for parts of a page), is more appropriate to avoid serving stale or incorrect personalized data.

    📖 Suggested read: 9 Redis Alternatives Worth Keeping an Eye On

    Final Thoughts

    Caching helps your site handle more traffic without increasing server resources. Each type of cache has a specific role, and together, they create a faster, more efficient user experience.

    For WordPress users, caching setup can feel complex.

    RunCloud Hub simplifies it by handling server-side caching (like FastCGI) automatically, with smart cache purging whenever content is updated.

    When a visitor requests a page, if a cached version exists at the server level, it’s served directly by NGINX before WordPress loads or processes PHP and database queries. This bypasses the most resource-intensive parts of WordPress page generation, resulting in dramatically faster load times for your visitors.

    RunCloud streamlines the setup and management of these powerful caching mechanisms and allows you to focus on creating great content while we optimize performance. Furthermore, RunCloud intelligently interacts with WordPress to know when content is updated, so it can purge the old cache and serve fresh content, ensuring accuracy.

    Caching doesn’t have to be technical. With RunCloud Hub, you can enable server, page, and object caching in just a few clicks – no manual config needed.

    If you want your site to load faster, handle more traffic, and use fewer resources, start using RunCloud today.

    FAQs on Caching

    What is the difference between caching and compression?

    Caching stores copies of frequently accessed data (e.g., web pages, images) to serve them quickly on subsequent requests, reducing server load and latency. Compression, on the other hand, reduces the file size of data before it’s transmitted, making downloads faster by using less bandwidth.

    Does caching improve SEO rankings?

    While caching isn’t a direct ranking factor, it significantly improves website speed and user experience, which are crucial for SEO. Faster load times can lead to lower bounce rates and better engagement, directly impacting search engine rankings.

    How do I know if my cache is working?

    You can use your browser’s developer tools (Network tab) to inspect HTTP response headers like Cache-Control, Expires, or X-Cache status, which tells if a resource was served from cache. Alternatively, online cache-checking tools or observing significantly faster load times on a second page visit can also confirm its operation.

    What happens if I disable caching?

    Disabling caching means every user request will fetch fresh data directly from your origin server, significantly increasing page load times and server resource consumption. Increased processing and bandwidth usage can lead to a slower user experience and potentially higher hosting costs.

  • 8 Best GTmetrix Alternatives for Website Performance Testing (Includes Free)

    8 Best GTmetrix Alternatives for Website Performance Testing (Includes Free)

    Website speed matters – if your site loads slowly, people will leave.

    GTmetrix is a common tool for checking website performance, but it’s not the only one.

    This post examines different ways to test your website’s performance, including exploring several GTmetrix alternatives we recommend considering. We’ll also cover options if you’re looking for a free website performance evaluation tool or just want to find the best website performance analyzer for your specific needs.

    Let’s get started!

    What is GTmetrix?

    GTmetrix is a powerful and widely used online performance analysis tool for websites. It is a virtual performance auditor that examines your website’s loading behavior and provides you with a detailed breakdown of its strengths and weaknesses. It goes beyond a simple page load timer and dives deep into the mechanics of how your site interacts with a user’s browser.

    Here are a few reasons why people use GTmetrix to evaluate their web performance:

    • Simulated User Experience: GTmetrix simulates a real user accessing your website from various locations and using different browser configurations (Chrome, Firefox). This allows you to understand how your site performs under different conditions and for a global audience.
    • Performance Audits: GTmetrix runs a series of performance audits based on Google PageSpeed Insights and its own recommendations. These audits identify areas that need optimization and provide clear, actionable suggestions.
    • Historical Data Tracking: You can save and track reports over time to monitor the impact of code changes and server configurations on performance. This allows you to detect regressions and fine-tune your website over time.
    • Multiple Testing Options: GTmetrix allows you to run tests from different locations, simulating various user experiences. You can also specify connection speeds and devices.
    • Integration and Automation: GTmetrix provides API access for integration with other tools and for automating performance testing as part of your CI/CD pipeline. This allows for continuous and repeatable testing.

    GTmetrix provides a rich data set to help developers understand why a website is performing the way it is and guide them to specific areas for performance optimization, but it still has a few limitations.

    Suggested read: 15 Best Performance Testing Tools to Improve Your Site in 2021

    Limitations of GTmetrix

    While GTmetrix is incredibly useful, it’s essential to understand its limitations to ensure you interpret results accurately and use the tool effectively.

    • Synthetic Tests are Not Real: GTmetrix relies on synthetic testing, which simulates a user experience through a virtual browser. This is great for controlled experiments and consistent measurements but doesn’t always perfectly represent real user behavior. Factors like network conditions, device capabilities, and user interactions affecting page load vary significantly. To get a complete picture, you should complement GTmetrix data with RUM tools (Real User Monitoring) that capture actual usage data.
    • Focus on Front-End Performance: GTmetrix is heavily focused on front-end performance, which is how the browser delivers and renders the page. While it will identify server performance issues (like slow TTFB), it won’t provide insight into server-side bottlenecks, database performance, or application-specific code.
    • Test Server Variation: While the tests are controlled, variations in test server load or network conditions may occasionally affect results. Run tests multiple times to verify consistency. Having highly variable results might indicate an external problem with the test or the tested website’s server.
    • Limited Device Emulation: GTmetrix emulates a limited set of mobile devices and browsers. For in-depth testing on a wide range of devices, you still need to rely on other tools, such as browser device emulators and real device testing.

    Suggested read: The Complete WordPress Speed Optimization Guide

    Top 8 GTmetrix Alternatives

    Here are some of the most popular alternatives to GTmetrix, which can be used to evaluate the performance of websites and web applications.

    1 – DebugBear

    DebugBear is a performance auditing suite focusing on real-user data and lab-based tests. It can pinpoint areas where a website is underperforming by providing a multi-faceted view. First, it gathers data from Google’s Chrome User Experience Report (CrUX), which tests represent actual user experiences. It shows the distribution of core web vital metrics including First Contentful Paint (FCP), Largest Contentful Paint (LCP), Cumulative Layout Shift (CLS), and Interaction to Next Paint (INP).

    DebugBear is best for projects that require ongoing, in-depth performance analysis and tracking, and is especially well suited for sites that must keep up with Core Web Vitals and performance regressions. DebugBear excels at providing a more detailed and actionable approach to performance monitoring.

    It produces real-world data, which is vital for understanding how your site performs for actual users. For example, in the above report we can see metrics are categorized as “Good”, “Needs Improvement”, and “Poor”, with a percentage breakdown to show the distribution. It also provides a 25-week trend graph for these metrics.

    Why it’s a great alternative: While GTmetrix is more of a point-in-time audit, DebugBear is useful for continuous monitoring and offers a complementary approach to the same problem. DebugBear provides historical tracking data, allowing us to analyze site performance improvements over time.

    Suggested read: How To Optimize Laravel for Performance (8 Expert Tips)

    2 – SpeedVitals

    SpeedVitals is a performance testing tool that provides a user-friendly interface with in-depth performance analysis. It takes a visual approach to analyzing metrics such as FCP, LCP, and CLS. Additionally, it provides core web vitals and page speed scores. It also includes real user monitoring and continuous monitoring.

    It is well-suited for users who want a tool that offers a very rich visual representation of page performance and an easy-to-grasp summary of common metrics. The SpeedVitals report gives a good overview of how well a website performs, using a combination of easy-to-understand grades and numbers alongside technical analysis for those who want more details.

    Why it’s a great alternative: SpeedVitals combines GTmetrix’s performance tracking features with easier visual analytics and in-depth monitoring for real users. The report provides a visual timeline showing how the website appears to the user during load, which helps identify performance bottlenecks.

    It also uses data to measure specific metrics for elements on the page to further understand how the user experiences the site. For example, we can track how long it takes for the first piece of text or image to show up, how fast the page feels like it’s loading, and how long before the user can fully interact with the page. The report also breaks down the size of different types of files, like JavaScript, images, and CSS, to show which ones take up the most space and slow down the website.

    Experts can dive even deeper to analyze which part of the page is the last to load, and it even shows animations of where page elements might shift around to help pinpoint the root of the problem. One of the best sections of the report is the “Code Coverage” area, which shows parts of the website’s code that aren’t even being used. This is helpful because eliminating unused code can make the site much faster.

    Suggested read: Website Load Testing – How To Test Website Performance At Scale

    3 – Google PageSpeed Insights

    As the name suggests, PageSpeed Insights was developed by Google, and it uses the same technology as Google crawl bots to track your website. It offers scores, audits, and specific recommendations based on Google’s web performance best practices, particularly relevant for SEO.

    Google PageSpeed Insights provides both real-world user experience data and lab-based diagnostic information. At the top of the report, it presents a clear summary of “Core Web Vitals” based on real user data from the Chrome UX Report (CrUX). It also shows some additional user metrics, such as FCP and TTFB, which are useful in measuring the quality of user experience and provide a benchmark for performance improvements. It is important to note that this data is gathered from real Chrome users and will not be available for every website.

    Why it’s a great alternative:It provides a perspective on what impacts SEO rankings and offers actionable guidance. Although GTmetrix has PageSpeed Insights data, using it directly allows for more frequent updates.

    Suggested read: How to Optimize Your Site for Google’s Core Web Vitals

    4 – Firefox Profiler

    The Firefox Profiler is a remarkably powerful yet often overlooked performance auditing tool directly integrated into the Firefox browser. Unlike many other profiling solutions that require external installations or complex setups, it’s readily accessible, making it an incredibly convenient option for developers.

    What truly sets it apart is its ability to provide a holistic view of a website’s performance from your own network on your own computer. This is different from most other tools that use virtual machines on the cloud to test your website.

    By testing the website on your own computer, you can test not just network activity but also intricate details of JavaScript execution, rendering processes, and even interactions with the browser’s internal systems. The profiler’s data is presented across multiple interactive visualizations.

    The “Call Tree” provides a hierarchical breakdown of function calls, allowing developers to pinpoint exactly where the code spends its time. The “Flame Graph” visually represents these calls as stacked bars, making it easy to identify performance bottlenecks at a glance.

    The “Stack Chart” provides insight into the call stack and functions. The “Marker Chart” provides an overall timeline with specific markers for rendering, javascript execution, and other key processes, allowing developers to visualize how these different processes interact.

    Why it’s a great alternative:The depth of information offered by the Firefox Profiler goes beyond simple performance metrics. It captures low-level browser operations, which enable developers to diagnose issues that might not be apparent through other tools. This feature is especially useful for tracking how efficiently data is handled within a web application.

    Suggested read: Uptime Monitoring Tools: Why You Need Them, and What to Look for

    5 – WebPageTest

    Catchpoint’s WebPageTest is a customizable testing tool that allows deep control over test conditions such as geographic locations, connection speeds, and device types. It is also well known for its advanced waterfall charts and visual rendering metrics.

    A clean and concise interface provides developers insights into critical metrics such as TTFB, FCP, Speed Index, LCP, CLS, and TBT. These metrics are further enriched by an “Is it Quick?” assessment, which highlights key aspects like render-blocking requests and identifies if the largest content is rendered too late.

    This allows technical users to target specific performance challenges, such as optimizing resource loading, image delivery, and JavaScript processing. The platform also generates a detailed filmstrip showing page load progression, which lets developers visualize the website’s rendering over time.

    WebPageTest is best for developers who need highly granular control over testing environments and for in-depth debugging of performance issues. It presents both synthetic test results and real-user metrics. Furthermore, users can even inspect videos of each test run to identify any visual issues during page load. By breaking down the resources by type and size, WebPageTest makes it easy for developers to identify areas that need to be optimized. This powerful set of features gives developers all the tools they need to find performance bottlenecks.

    Why it’s a great alternative:It offers advanced configuration options for more complex testing requirements. Additionally, WebPageTest provides practical recommendations categorized into “Opportunities”, “Tips”, and “Pro” experiments. The “Is it Usable?” and “Is it Resilient?” sections give performance metrics for these key web factors often missed by other tools.

    6 – Lighthouse (Chrome DevTools)

    The Lighthouse analyzer is built into Chromium browsers and provides a comprehensive website performance audit. You can open it by navigating to the desired URL in your browser and switching to the Lighthouse tab in the Developer tools menu.

    The Lighthouse report breaks down the performance analysis into four key categories: Performance, Accessibility, Best Practices, and SEO. The report begins with an overall performance and individual scores for each performance metric. It provides both numeric values and a visual grade indicating whether the metric is considered good, needs improvement, or is poor.

    It also flags issues related to initial server response time, JavaScript execution, and network payloads, giving a full look at the site’s performance. For accessibility, the report identifies issues with names and labels, ARIA attributes, contrast, tables and lists, and navigation using headings, which developers can use to ensure a website is usable to everyone.

    Why it’s a great alternative: It is integrated directly into Google Chrome and provides instant performance audits without leaving the browser. This is especially useful during development for iterative feedback loops.

    7 – Calibre

    The Calibre website audit tool offers a compelling suite of features for web developers and comes with real-user data and long-term monitoring capabilities. You can use its Chrome User Experience Report (CrUX) functionality to accurately view how real users experience a website across different devices (desktop, tablet, and phone).

    It presents this data not just as a single data point but provides a view of how the metrics change over time. This long-term perspective allows developers to detect changes in performance over the long term and make informed optimization decisions. Additionally, a clear indication of whether the site is passing the core web vitals assessment provides a quick, high-level overview of the website’s status.

    By offering a 75th percentile view, Calibre reliably represents the user experience rather than relying on averages that outliers can skew. The histogram visualization gives developers a clear idea of the metric’s distribution, highlighting the range of user experiences.

    Why it’s a great alternative: Calibre offers granular data over time and alerts you to performance regressions. It’s designed for teams that need to integrate performance testing into their CI/CD pipelines. This allows developers to observe trends, identify regressions after updates, and ensure long-term site health. This long-term trend analysis is particularly valuable because it allows you to make strategic decisions based on real user data. This continuous monitoring and integration approach complements GTmetrix’s ad-hoc analysis.

    8 – SiteSpeed.io

    Sitespeed.io is a comprehensive, open-source web performance monitoring and testing platform that prioritizes user control and data ownership. Unlike many commercial offerings, it allows users to run their own performance tests, store their own data, and customize the analysis process. This commitment to transparency and flexibility is a core differentiator.

    The platform is not just a single tool but a collection of modular components, including Browsertime (for timing metrics), Coach (for best practice analysis), PageXray (for page resource analysis), and Throttle (for network emulation), all managed and unified by the primary sitespeed.io tool. This modular design enables users to assemble a performance analysis workflow that precisely meets their needs, making it suitable for both simple tests and complex, large-scale monitoring.

    Further, it emphasizes not being a “black box” solution by allowing the end user to configure different parameters through its command-line interface. This flexibility and control extend to deployment and integration – Sitespeed.io can be easily deployed using Docker, which provides a ready-to-go environment with necessary browsers and dependencies, drastically simplifying the setup process. It also offers traditional installation using npm, which opens up usage for many developers.

    It supports visualization integrations with time-series databases such as Graphite, InfluxDB, and Grafana. These are industry-standard tools that allow the creation of custom performance dashboards and long-term trend analysis. Additionally, the ability to run tests on Android phones and through custom scripting means sitespeed.io adapts to different testing needs.

    Why it’s a great alternative: Sitespeed.io provides a developer-friendly approach to performance monitoring, which makes it ideal for those who want the flexibility of an open-source tool and the ability to customize their performance testing pipelines. This dedication to privacy and open-source principles sets it apart from many commercial solutions, making it an attractive option for developers and organizations that value data security and transparency.

    Final Thoughts

    Throughout this post, we’ve discussed various web performance analysis tools and explored the strengths and unique benefits each offers. We have compared and evaluated various tools, and whether you are looking for a one-time audit, ongoing monitoring of site speed and core web vitals, or debugging locally with browser tools, you can find something that fits your needs.

    If you are building a website, good website performance isn’t just about using the right analysis tools – it begins with a solid foundation, and having a well-configured and responsive server is essential.

    A powerful hosting environment can significantly improve TTFB and reduce the time it takes for your site to begin loading.

    This is where RunCloud comes in.

    RunCloud gives you control over server configurations and optimizes your server-side processes. This can drastically reduce your site’s load time and improve the user’s experience.

    Ready to take your site’s performance to the next level?

    Start building lightning-fast websites today with RunCloud!

    FAQs on GTmetrix Alternatives

    Is GTmetrix now paid?

    While GTmetrix offers a free version with many features, it also offers paid plans that unlock more advanced capabilities, such as increased test limits, monitoring, and detailed historical analysis. The free version is still functional but has limitations compared to the paid versions.

    What is a good website loading speed?

    Generally, a good website loading speed is under 3 seconds for the initial page load, with under 2.5 seconds being optimal; however, Core Web Vitals metrics such as LCP should be under 2.5 seconds.

    Is PageSpeed Insights reliable?

    PageSpeed Insights is a reliable tool for measuring web performance because it is based on the same methodology Google uses to assess website performance. The provided data and recommendations align with Google’s SEO ranking factors and best practices, making it a key tool for SEO optimization.

    Is GTmetrix better than PageSpeed Insights?

    GTmetrix offers more granular detail with its waterfall analysis and is generally more flexible for testing various parameters. At the same time, PageSpeed Insights provides scores and recommendations directly relevant to Google’s ranking criteria. Which is better depends on your specific needs, such as deep performance debugging or general compliance with Google’s guidelines.

    Does GTmetrix use Lighthouse?

    Yes, GTmetrix incorporates Lighthouse data into its reports. It runs a Lighthouse audit to generate its PageSpeed and other associated performance scores. GTmetrix is a wrapper around Lighthouse and other performance analysis tools, providing additional metrics and functionality.

    What is the difference between DebugBear and GTmetrix?

    DebugBear focuses more on continuous monitoring and detailed performance tracking over time, making it excellent for catching performance regressions. GTmetrix is primarily used for point-in-time performance analysis, offering detailed waterfall charts and audits.

  • How to Restrict WordPress Admin Access by IP Address (Easy Guide)

    How to Restrict WordPress Admin Access by IP Address (Easy Guide)

    Open access to your wp-admin directory and wp-login.php makes it a prime target for brute-force attacks and unauthorized access.

    By whitelisting specific IP addresses and implementing WordPress admin access control, you can effectively stop hackers, block automated bots, and significantly reduce failed login attempts.

    This WordPress tutorial will show you how to restrict WordPress admin access by IP address by either editing the .htaccess file directly, applying NGINX configurations, or using a security plugin.

    Whether you use NGINX, Apache, or rely on a managed server provider, this guide will teach you how to whitelist (and blacklist) specific IP addresses.

    Let’s get started!

    What is IP Address Restriction?

    IP Address Restriction, also known as IP whitelisting, is a security measure that limits access to a specific resource, such as your WordPress admin area (/wp-admin), to only a pre-approved list of IP addresses.

    Simply put, it is like a digital security guard that allows only those with the correct “address” to enter. It says, “Only connections from these specific IP addresses are allowed to access this website area”.

    Why Restrict Admin Access by IP Address?

    Restricting admin access by IP address adds another layer of security to your WordPress site. By default, the admin login page is accessible to anyone on the internet, which makes it a prime target for malicious actors.

    IP restriction makes it exponentially more difficult for attackers to access the WordPress backend. Even if an attacker obtains valid login credentials (through phishing, malware, or other means), they will still be blocked if their IP address is not on the approved list. This is especially useful if you and your team work from fixed locations with static IPs.

    Additionally, brute force attacks involve repeatedly attempting to guess login credentials. Limiting access to only trusted IP addresses reduces the possibility of brute-force attacks originating from other locations. Although you can also use security plugins to stop brute force attempts, IP restriction stops them before they even start. If rate limiting is in place, this significantly reduces the load on your server and prevents potential account lockouts for legitimate users.

    Suggested Read: How to Unban IP Address in Fail2Ban? (Step-By-Step Guide)

    How To Restrict WordPress Admin Access by IP Address

    There are several ways to restrict access to your WordPress admin area, each with advantages and disadvantages. Here are three common methods:

    Method 1: Using .htaccess File

    The .htaccess file is a configuration file used by Apache web servers. You can directly edit it to restrict access based on IP addresses. Follow the steps below to do this:

    1. Access the .htaccess file: The .htaccess file is usually located in the root directory of your WordPress installation (the same directory where wp-config.php resides). RunCloud provides convenient access to your server’s filesystem. Log in to your RunCloud dashboard, select your server, and then the web application you want to modify. Here, you’ll find a “File Manager” in the left menu that you can use to edit files.
    1. Edit the .htaccess file:

    Important: Before making any changes, always download a copy of your .htaccess file to your computer and make a backup.

    • In the RunCloud File Manager, click on the .htaccess file to open the file in a text editor.
    • Add the following code block to the beginning of the file but after the “# BEGIN WordPress” section (if it exists). If there is no WordPress section, place it at the beginning:
    <Files wp-login.php>
        order deny,allow
        deny from all
        allow from YOUR_IP_ADDRESS
        allow from ANOTHER_IP_ADDRESS
    </Files>
    <Directory /wp-admin>
        order deny,allow
        deny from all
        allow from YOUR_IP_ADDRESS
        allow from ANOTHER_IP_ADDRESS
    </Directory>

    Replace YOUR_IP_ADDRESS and ANOTHER_IP_ADDRESS with the actual IP addresses from which you want to allow access. You can add as many ‘allow from‘ lines as needed. Place the <Files …> section above the <Directory> section if you have no WordPress section.

    1. Save and Upload: Save the changes to the .htaccess file by clicking the Save button on the top right.
    2. Test: Try accessing /wp-admin or /wp-login.php from an IP address on the allowed list. You should be able to log in. After that, try accessing it from an IP address not on the list. You should be denied access.

    Suggested Read: How to Block IP Address Using WordPress .htaccess File to Stop Bad Visitors

    Method 2: Using NGINX Config

    If you use an NGINX web server, you’ll need to modify the NGINX configuration file instead of using .htaccess. RunCloud significantly simplifies this process.

    1. Access the NGINX Configuration: Log in to your RunCloud dashboard, select your server, and then the web application you want to modify. You should see “NGINX Config” in the left menu on this screen.
    2. Edit the NGINX Configuration: RunCloud provides a user-friendly interface for editing NGINX configurations, eliminating the need for SSH access and manual configuration. On the next screen, click “Create a New Configuration”, and select “Block XML-RPC” from the dropdown menu. This predefined configuration isn’t necessary, but it is recommended as it automatically fills most fields and makes it harder for novice users to make mistakes.
    1. Add configuration: Copy the code snippet below and paste it into the text field in your RunCloud dashboard. Replace YOUR_IP_ADDRESS and ANOTHER_IP_ADDRESS with the actual IP addresses you want to allow. You can add multiple allow lines as needed. The deny all line ensures that any IP address not explicitly allowed is blocked.
    location /wp-admin/ {
        allow YOUR_IP_ADDRESS;
        allow ANOTHER_IP_ADDRESS;
        deny all;
    }
    location /wp-login.php {
        allow YOUR_IP_ADDRESS;
        allow ANOTHER_IP_ADDRESS;
        deny all;
    }
    1. Save and Apply: In RunCloud, simply save the changes you’ve made to the NGINX configuration within the editor. RunCloud automatically checks the configuration for errors before applying it, preventing common mistakes that could break your website.
    2. Test: As with the .htaccess method, test access from both allowed and disallowed IP addresses to ensure it works correctly. Any attempt to access the website from a disallowed IP address should result in the following message being displayed:

    Suggested Read: What is DNS & How Does It Work? Everything you need to know.

    Method 3: Using a WordPress Security Plugin

    Several WordPress security plugins offer IP address restriction features. This is often the easiest method for those less comfortable with server configuration files. In this tutorial, we will explain how to block IP addresses using Patchstack.

    1. Install and Activate Patchstack: Install and activate the Patchstack security plugin from the WordPress plugin repository. You can do this directly through your WordPress dashboard by navigating to “Plugins” > “Add New“, searching for “Patchstack“, and clicking “Install Now“, followed by “Activate“.
    2. Access Patchstack Options: Once activated, you must integrate your WordPress website with your Patchstack account. In your Patchstack dashboard you can access the Patchstack configuration options by navigating to “Hardening” > “Login Protection” within your Patchstack dashboard. This section provides various settings related to login security, including the IP whitelisting feature.
    1. Add IP Addresses to Whitelist: Within the “Login Protection” settings, locate the section dedicated to whitelisting IP addresses. Here, you can enter the IP addresses you wish to allow access to your WordPress admin area, ensuring they are never blocked due to failed login attempts or other security measures. Each IP address must be entered on its own line, and Patchstack supports several formats for defining IP ranges.
      The following formats are accepted:
      • 127.0.0.1: A specific IP address.
      • 127.0.0.*: A wildcard, allowing all IP addresses within the 127.0.0 range.
      • 127.0.0.0/24: CIDR notation specifies a range of IP addresses (in this case, 127.0.0.1 to 127.0.0.255).
      • 127.0.0.0-127.0.0.19: An IP range using a hyphen to define the start and end of the range.
    2. Save Changes: After adding the desired IP addresses to the whitelist, click the “Save Changes” button at the bottom of the page. This action will save your configurations and activate the IP whitelisting, ensuring that only the specified IP addresses can access your WordPress admin area without being subject to blocking rules.

    Suggested Read: How to Set or Change System Hostname in Linux

    Wrapping Up: Who Should Restrict Admin Access by IP Address?

    The short answer: nearly everyone running a WordPress site should strongly consider restricting admin access by IP address. While it might seem like an advanced security measure, the risk of leaving your admin area wide open to brute-force attacks and unauthorized logins far outweighs the perceived complexity.

    Protecting your WordPress backend is very important whether you’re a small business owner, a blogger, or a large enterprise.

    RunCloud’s intuitive interface significantly simplifies blocking unwanted IPs and managing server configurations. Editing your .htaccess file (for Apache servers) or your NGINX configuration becomes a breeze within the RunCloud panel.

    Compared to restrictive hosting panels, RunCloud offers limitless flexibility. You have complete control over your server environment, and RunCloud allows you to optimize your WordPress site for maximum security and performance.

    Speaking of performance, RunCloud’s optimized server configurations, combined with the added security of IP restriction, can lead to a faster, more responsive website. By blocking malicious traffic before it even reaches your server, you reduce the load on your resources, which improves page load times and enhances the overall user experience.

    Sign up for RunCloud today.

    FAQs on Restricting WordPress Admin Access by IP Address

    Can I restrict access to multiple IP addresses?

    You can restrict access to the WordPress admin area (/wp-admin) to multiple specific IP addresses by adding multiple Allow from lines in your .htaccess file. This allows trusted team members or developers from different locations to access the backend. RunCloud’s robust server management features and built-in web firewalls can complement this by providing additional layers of security beyond IP restrictions.

    What happens if my IP address changes?

    If your IP address changes, you will be locked out of your WordPress admin area. You’ll need to update the .htaccess file with your new IP address. Consider using a static IP address or a dynamic DNS service if your IP changes frequently to avoid constant updates.

    Is it safe to edit the .htaccess file?

    Editing the .htaccess file can be risky if done incorrectly, as it can potentially cause website errors or make it inaccessible entirely.

    What security plugins work best for IP restriction?

    Patchstack provides a user-friendly interface and additional security features beyond simple IP restrictions. These features work well with RunCloud’s server-level security and built-in firewalls.

    How do I know if my site is secure after making changes?

    After implementing IP restrictions, test the configuration by attempting to access the WordPress admin area from an IP address that is not allowed. If you are blocked, the restriction is working correctly.

    What are the risks of not restricting admin access?

    Failing to restrict access to your WordPress admin area significantly increases the risk of brute-force attacks, unauthorized access, and potential website compromise. Hackers can exploit vulnerabilities or use stolen credentials to gain control of your site, leading to data breaches, malware injection, and reputational damage. RunCloud’s web application firewall helps mitigate some of these risks, but IP restriction adds a crucial layer of defense.

    How can I temporarily allow access from another location?

    To temporarily allow access from another location, you can add appropriate rules to whitelist the new IP address in the .htaccess file. Remember to remove it when access is no longer needed to maintain security.

  • How To Use Fail2ban With WordPress And Cloudflare Proxy

    How To Use Fail2ban With WordPress And Cloudflare Proxy

    According to financesonline.com, more than 80% of website breaches through hacking involved either brute force, or the use of lost or stolen credentials.

    If you’re running a website, it’s an almost certainty that your website is constantly being bombarded with login attempts. Unauthorized access is a matter of when, not if.

    To ensure your website is secure, and fully protected from this kind of attempted hack, it’s vital to start using a solution such as Fail2ban.

    Fail2ban is a software tool that automatically blocks suspicious IP addresses and prevents them from connecting to your server.

    In this article, we will explain exactly how to make sure that your website is fully protected the right way by showing you how to install and configure IP blocking for your WordPress website using Fail2ban.

    What Is Fail2ban?

    Fail2ban is an open-source software product that monitors log files for suspicious activity. It can be configured to take the action needed to prevent further attacks. This method is widely used to protect web servers, applications, and other network services from brute-force attacks and DDOS attacks.

    Fail2ban is configured by default on RunCloud for SSH logins. If you try to log in to your server via SSH with incorrect credentials, your own IP address will be temporarily banned and you will get the following error:

    ssh: connect to host example.com port 22: Connection timed out

    By configuring a few settings, this protection can also be applied to your WordPress login form.

    Configuring Fail2ban for WordPress

    Start by logging in to your server via SSH – make sure that you have superuser access.

    Locate Log Files

    On NGINX servers, RunCloud stores the log files in /home/runcloud/logs/apache2/ and /home/runcloud/logs/nginx/ – along with the name of each web application. Use the following command to see all available log files of Apache2:

    ll /home/runcloud/logs/apache2/

    In the above example we can see that there are two web applications running on the server, and each of those applications generate both an access log and an error log.

    If you are using RunCloud Docker servers, then you should note that the log processing for RunCloud Docker server is slightly different, even though it uses the RunCloud NGINX environment under the hood. On RunCloud Docker, you can find the NGINX log files in the /home/runcloud/logs/nginx/ directory.

    On OpenLiteSpeed servers, these logs are stored at /home/runcloud/logs. Use the following command to view the logs stored on your server:

    ls -lah /home/runcloud/logs

    Let’s say we want to configure the Fail2ban for the “app-schulist” application.

    We will begin by verifying whether the /home/runcloud/logs/apache2/app-schulist_access.log file is the correct log file to watch for failed login attempts. To do this, run the following command in your terminal to get notified about failed login attempts, (don’t forget to replace “app-schulist” with the name of your application):

    tail -f /home/runcloud/logs/apache2/app-schulist_access.log | grep "POST /wp-login.php"   

    After running the command, go to your WordPress dashboard and try logging in with invalid credentials. You should see a log message in your terminal for each failed login attempt.

    terminal screenshot of logs

    Similarly, on RunCloud Docker, you can execute the following command to see recent login requests on your website, (don’t forget to replace “app-lut-gye” with the name of your application):

    tail /home/runcloud/logs/nginx/app-lut-gye_access.log | grep "POST /wp-login.php"

    In the above example, we can see that logs show one POST request was made to the /wp-login.php endpoint of the given website.

    If you are using OpenLiteSpeed servers, just change the path of the log file in the above command. It should look something like following example:

    tail -f /home/runcloud/logs/app-keeling_access.log | grep "POST /wp-login.php"

    Once you have verified the log file, press Ctrl + C in your terminal to stop monitoring for new log entries. Make sure to take a note of the location of this log file.

    Configuring Fail2ban Jail for NGINX and OpenLiteSpeed

    Fail2ban comes with a default configuration file that comes with sensible defaults. It is recommended to leave the default configuration files untouched. If you want to make any changes, you should create another configuration file that overrides the default configuration.

    Run the following command with root privileges in your terminal to create a new file and open it in a text editor:

    cp /etc/fail2ban/jail.{conf,local}
    nano /etc/fail2ban/jail.local

    Once you have opened the file, scroll down to the “jails” section using the arrow keys on your keyboard, and then paste the following code to create a new entry. (Once again, make sure to replace the name of the log file with the name that you noted in the last step.)

    [wordpress-auths]
    enabled = true
    port = http,https
    filter = wordpress-auth
    logpath = /home/runcloud/logs/apache2/app-schulist_access.log

    If you have more than one WordPress website on your server, you can append more entries to the logpath variable (as shown above). This will ensure that all of the specified log files will be monitored for the given criteria.

    If you don’t want to constantly add or remove the log path in the configuration file, you can replace the name of the application with * as shown below. This will ensure that all the log files in the given folder (and hence all the application on your server) are being monitored.

    However, you will need to reload Fail2ban after you deploy a new application on your server. You can do this easily, directly from the RunCloud dashboard, by creating a cron job with the appropriate command and running it manually when required.

    If you want to have different settings for each web app, you can create a separate jail for each web application as shown below. Just make sure to specify the correct log files – and give each entry its own unique name (written in green).

    Fail2ban Config file

    After adding the necessary content, press Ctrl + O to save the file and press “Enter” to confirm it. Then press Ctrl + X to exit the text editor.

    Configuring Fail2ban Jail on Docker

    A standard Fail2Ban configuration is insufficient when you deploy Fail2Ban to protect services running inside Docker containers. You will discover that Fail2Ban doesn’t effectively block malicious traffic, even if your jail settings appear correct. That’s because Docker’s networking architecture requires a specific configuration tweak within Fail2Ban.

    By default, Fail2Ban inserts its blocking rules into the INPUT chain of iptables. However, Docker maintains its own set of iptables rules, and the traffic destined for containers bypasses the standard INPUT chain. Therefore, Fail2Ban’s rules, placed in the INPUT chain, are ignored when protecting Dockerized applications.

    To solve this issue, modify your settings to use the DOCKER-USER chain.

    This special chain allows for user-defined rules to be applied before Docker’s internal rules take effect. You can do this by adding chain = DOCKER-USER to your jail configuration.

    The above settings work for default RunCloud servers, but some servers might require you to explicitly define the banaction and backend directives to avoid unforeseen edge cases. To fix this, you should add the snippet banaction = iptables-multiport into your configuration file. This configuration allows you to block multiple ports with a single iptables rule.

    Next, you should add the backend = polling code snippet to configure how Fail2ban periodically polls the log files (i.e., check them at regular intervals) to see if new lines have been added. This is the simplest and most broadly compatible backend. After modifying the configuration, your jail configuration should look something like this:

    [wordpress-auths]
    enabled = true
    filter = wordpress-auth
    logpath = /home/runcloud/logs/nginx/*_access.log
    chain = DOCKER-USER
    backend = polling
    banaction = iptables-multiport
    maxretry = 3

    Creating a Fail2ban Filter

    Once you have created a jail, you’ll need to create the corresponding filter that tells Fail2ban which clients to ban in case of a malicious login attempt. Run the following command to create a new filter named wordpress-auth:

    nano /etc/fail2ban/filter.d/wordpress-auth.conf

    Then paste the following text snippet to filter the failed login attempts on NGINX and Docker servers:

    [Definition]
    failregex = ^<HOST> .* "POST /wp-login.php HTTP.* 200
    fail2ban jail file

    For OpenLiteSpeed servers, the regex pattern is slightly different due to a difference in the log format.

    [Definition]
    failregex = .+ <HOST> .+POST \/wp-login\.php .*200

    Once again, press Ctrl + O to save the file and press “Enter” to confirm it. Then press Ctrl + X to exit the text editor.

    Testing The Fail2ban Filter (Optional)

    If you are making changes to the production environment, it’s advisable to test out the settings before applying the new ones. You can use the following command to check if a filter is working correctly:

    fail2ban-regex <path to log file> <path to filter>

    For example, the full command would look something like this:

    fail2ban-regex /home/runcloud/logs/apache2/app-schulist_access.log /etc/fail2ban/filter.d/wordpress-auth.conf

    In the above message, “Failregex: 8 total” shows that 8 entries in our log file matched with the filter that we provided. This means that our Regex filter is working correctly. If you want to see which log entries are being matched, you can include --print-all-matched flag before the path of the log file. For example:

    fail2ban-regex --print-all-matched ./app-keeling_access.log /etc/fail2ban/filter.d/wordpress-auth.conf

    In the above example, we can see that our regex pattern matched 22 entries in the given log file, and then listed out each entry which would have triggered a violation.

    Apply the Changes to Fail2ban

    To apply the new changes, you’ll need to restart the Fail2ban service. You can restart the service and check its status by running the following commands:

    systemctl restart fail2ban
    systemctl status fail2ban

    In the above example, we didn’t encounter any errors, and Fail2ban was able to restart successfully. If you do face any errors, run the following command to troubleshoot the issue:

    fail2ban-client -x start

    Check Running Jails

    Once you have restarted the service, you can check if your changes were applied correctly. Run the following command to see all of the jails currently configured on your server:

    fail2ban-client status

    Check Banned IPs

    To check where the malicious IP addresses are being banned, try repeatedly logging in to your WordPress dashboard with incorrect credentials.

    By default, if you make five unsuccessful login attempts within ten minutes, your IP address will be blocked for ten minutes. This setting can be configured in the /etc/fail2ban/jail.local file.

    To get detailed information about a particular jail, use the following command, (make sure to replace “wordpress-auths” with the name of your jail):

    fail2ban-client status wordpress-auths

    If you have multiple websites running on your server, the malicious actor will not be able to access any of them due to being listed as a banned IP address. This includes even those sites that are not being monitored by Fail2ban.

    However, if you are using the Cloudflare proxy, this won’t work. Let’s see why.

    Using Fail2ban With Cloudflare

    When you are using Cloudflare proxy to serve your web requests, the IP address used to connect to your server belongs to Cloudflare. Therefore, when you block the IP address after repeated failed login attempts, it blocks Cloudflare’s own IP address – which results in the following error:

    Blocking Cloudflare’s IP address makes it think that the website has crashed – and all visitors from the blocked region will get a 520 error.

    This is obviously unacceptable as blocking one IP address can make your website inaccessible to all users in a country. To fix this we will need to block the malicious traffic before it reaches Cloudflare.

    Restoring Real Visitor IP Addresses with Cloudflare and RunCloud

    Without the real IP, Fail2ban would end up blocking Cloudflare, effectively taking your site offline! To fix this, we need to configure NGINX (your web server) to “restore” the original visitor’s IP address from the information Cloudflare sends. RunCloud makes this incredibly easy with a pre-defined configuration:

    1. Navigate to NGINX Settings: Within your RunCloud dashboard, go to the “Web Application” page for the specific website you’re configuring. Then, find the “NGINX Config” section.
    2. Create a New Configuration: Click on “Create NGINX Configuration”.
    3. Choose the Pre-defined Config: From the “Predefined Config (Optional)” dropdown menu, select “Cloudflare – Restore visitor IP“. This option is specifically designed for this purpose.
    4. Configuration Details (No Changes Needed): RunCloud will automatically fetch the list of IPv4 and IPv6 addresses from Cloudflare’s website and populate the necessary settings.
    5. Save. Save the NGINX configuration.

    Important: You do not need to modify the configuration file itself. The pre-defined configuration is already set up to correctly extract the real IP address from the relevant headers that Cloudflare includes in its requests.

    By following these steps, NGINX will now correctly identify the visitor’s real IP address. Now you can use this information with Fail2ban (and other IP-based security tools) to block offending IP addresses, even behind Cloudflare’s proxy.

    Using Cloudflare Actions to Ban IPs

    To do this we will create a list of bad users who have too many failed login attempts, and then give this list to Cloudflare so that it can block the traffic.

    Go to your Cloudflare Dashboard and generate your API token.

    Once you have opened the API token menu, scroll down to the “Global API Key” menu and view the token. Run the following command in your terminal to open the configuration file:

    nano /etc/fail2ban/action.d/cloudflare.conf

    Scroll down to the bottom of the file using your keyboard arrows, and paste your API key as shown above.

    Next, enter the email address you used to register your Cloudflare account, and then save and exit the file.

    Having done that, you’ll need to edit the /etc/fail2ban/jail.local file to make sure that it uses our newly created action. Scroll down to the jail corresponding to the website that uses the Cloudflare proxy to serve traffic, and add the following line to it:

    action = cloudflare
    iptables-allports

    Save and exit the file. After saving, restart the Fail2ban client to apply the changes. You can run the following command to restart the service, ban a dummy IP address, and check its status. Just make sure to replace “wordpress-auths” with the name of your jail:

    systemctl restart fail2ban
    fail2ban-client -v set wordpress-auths banip 22.22.22.22
    fail2ban-client status wordpress-auths

    Suggested read: How to Unban IP address in Fail2ban

    Conclusion

    Using Fail2ban with WordPress can greatly enhance the security of your website by protecting it against brute force attacks and other malicious activity. By following the steps outlined in this article, you can easily set up Fail2ban on your WordPress site and start enjoying the benefits of increased security.

    If you’re tired of managing your own servers – you might want to check out RunCloud (yep, that’s us!). RunCloud is built for developers that want to focus on shipping great work, not on managing their infrastructure.

    Discover what a painless server configuration feels like, allowing you to avoid having to spend hours figuring it out. Get started with RunCloud today, and get up and running in minutes.