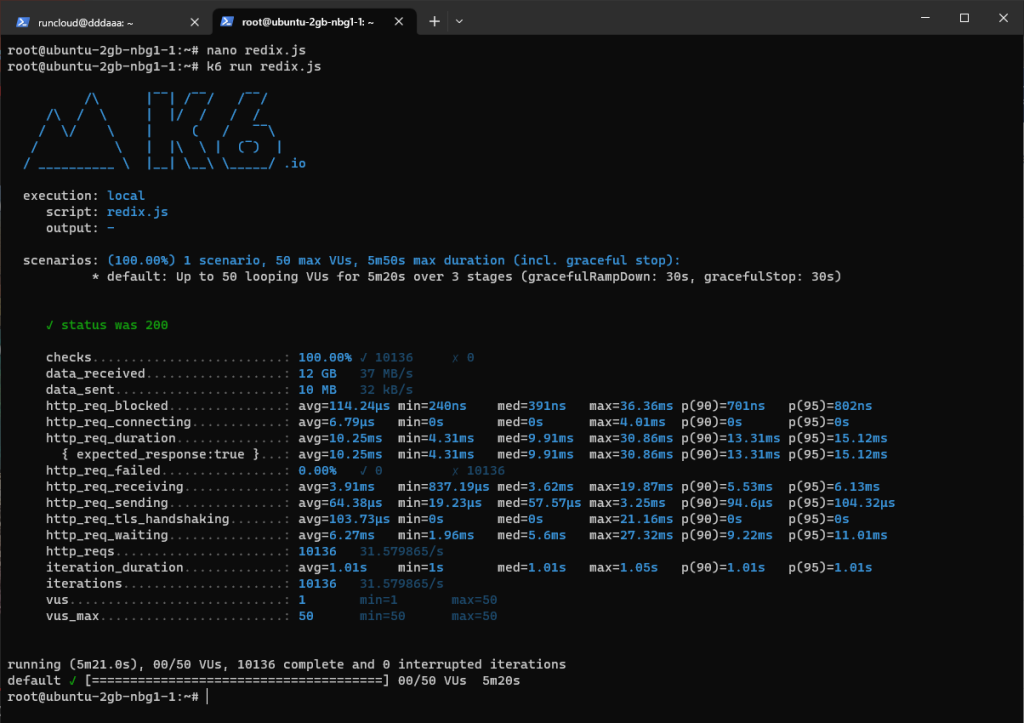
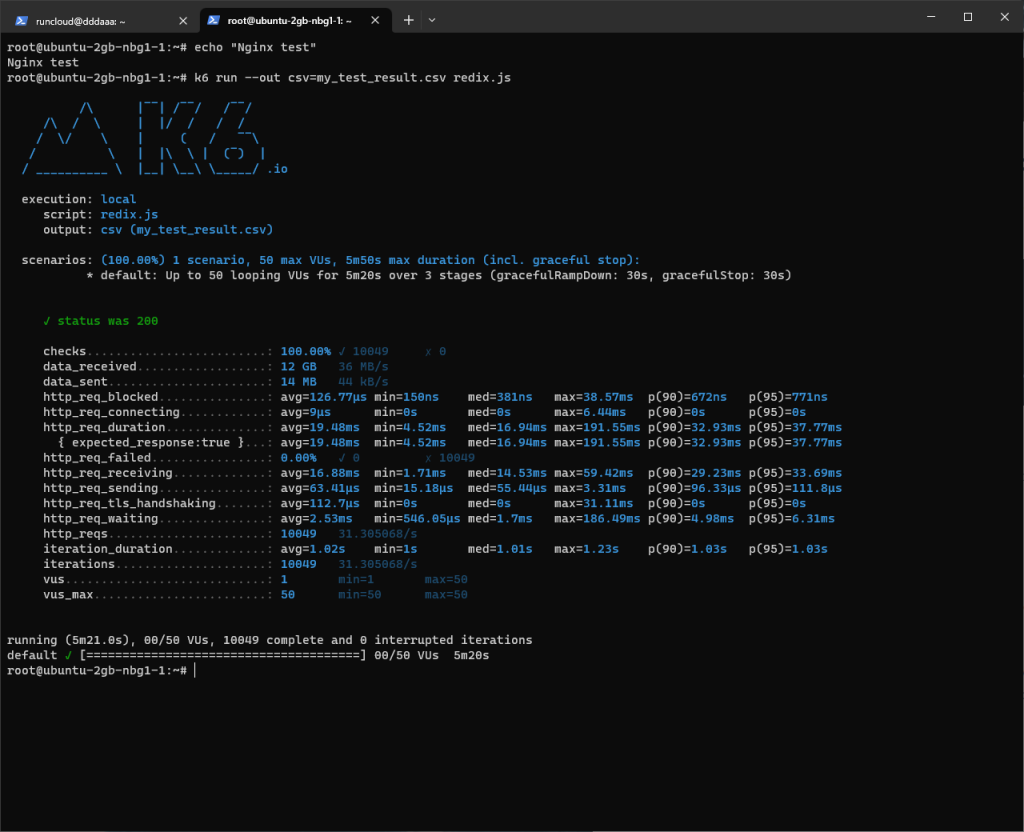
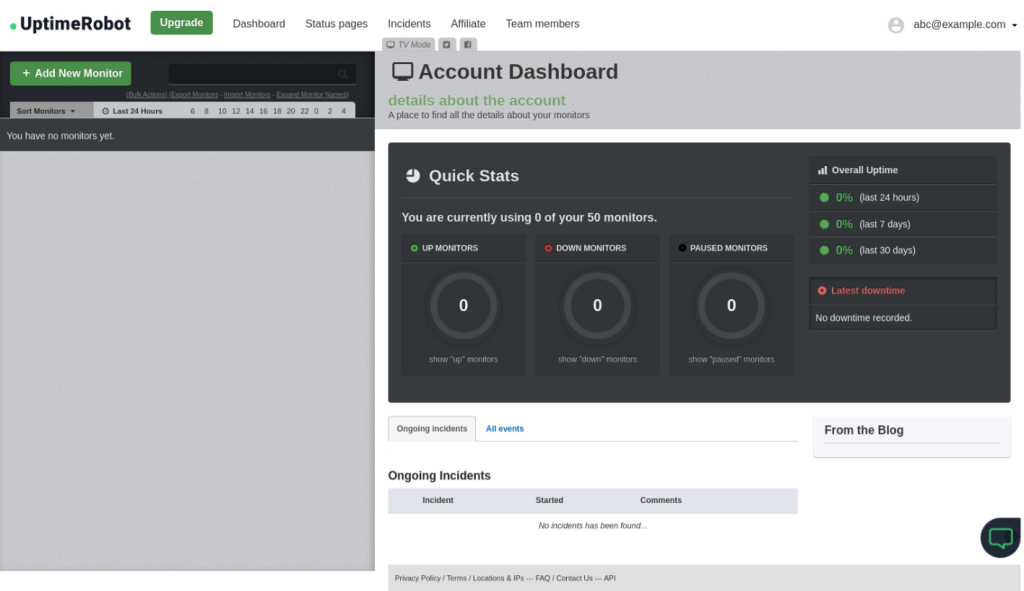
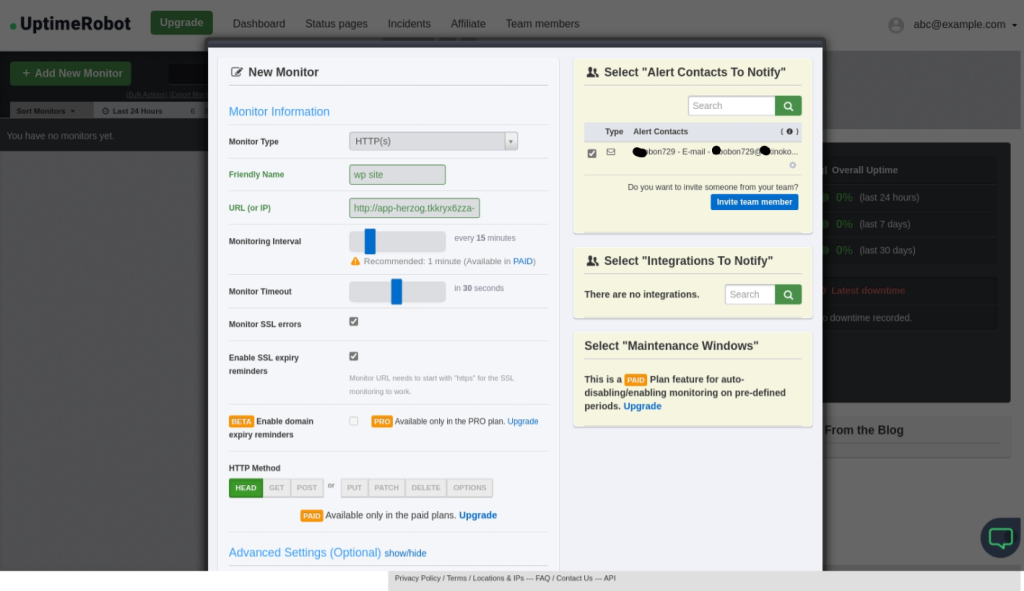
Choosing a hosting plan for your website or application can be a daunting task. There are so many options and factors to consider, such as cost, performance, security, scalability, support, etc.
How do you know which one is the best for your needs and budget?
In this article, we will explain the pros and cons of two common types of hosting: self-managed and managed hosting.
We will also introduce you to a better solution that combines the advantages of both: RunCloud.
Read on to find out more about self-managed vs managed hosting and how RunCloud can help you with your web hosting needs.
Self-Managed Hosting
Self-Managed Hosting, sometimes also known as self-hosted WordPress, is a setup whereby a website runs on a web server that the user chooses and pays for. A self-hosted WordPress website gives the user more control and flexibility over their website, but also more responsibility for managing and maintaining it.
To create a self-hosted WordPress website, you will need to:
Buy a domain name from a domain registrar
Get a hosting account from a suitable cloud provider
Configure DNS records
Manage SSL certificates
Periodically check for new updates or vulnerabilities in plugins or themes.
These are the basic steps to create a self-hosted WordPress website.
Pros of Self-Managed Hosting
Lower cost: Self-managed hosting is usually cheaper than managed hosting because the customer doesn’t have to pay for the additional services and features that the hosting provider offers.
More control: Managing hosting often gives the customer more control over the server and its configuration. The customer can customize the server according to their needs and preferences. They can also install any software or application that they want on the server.
Flexibility: This hosting allows the customer to change or upgrade the server as they wish. They can also scale the server resources up or down, depending on the demand and traffic of their website or application.
Customization: Customers can tailor the server to their specific requirements and goals. They can optimize the server for either performance, security, or functionality.
Challenges of Self-Managed Hosting
Technical skills: Self-managed hosting requires you to have technical skills and knowledge to manage and maintain the server. You will have to deal with complex tasks such as installation, monitoring, and troubleshooting. You also have to be familiar with the underlying operating system and the software that you use on the server.
Security: When choosing this option, you might be faced with more security risks because you are responsible for securing the server and its data. You must implement security measures such as firewalls, antivirus software, encryption, authentication, etc., and then continually monitor the server for any potential threats or attacks.
Maintenance: Self-managed hosting demands more time and effort to keep the server running smoothly and efficiently. You need to perform regular maintenance tasks such as backups, updates, patches, etc.
Support: If you host your website yourself, you won’t get any support from the hosting provider. You must rely on your own skills and resources to solve any problems or challenges that you might face on the server. The hosting provider may only offer basic support, or charge extra fees for advanced support.
Managed Hosting
Managed hosting is a type of hosting where the hosting provider takes care of most of the server management and maintenance tasks, such as installation, updates, security, backups, monitoring, and support. The customer only has to focus on their website or application and its content.
The hosting provider also provides additional features and services, such as performance optimization, scalability, load balancing, caching, etc. The customer has less control over the server and its configuration, but also less hassle and risk.
Benefits of Managed Hosting
Higher performance: Managed hosting providers work with thousands of websites, and often optimize servers for speed and efficiency. The hosting provider also uses advanced technologies such as caching, load balancing, CDN, etc. to improve the loading time and responsiveness of the websites or applications.
Reliability: Managed hosting provides more reliability than self-managed hosting because the hosting provider monitors the server for any issues or errors – and fixes them promptly.
Security: The hosting providers often work with a team of security experts that implements security measures such as firewalls, antivirus software, encryption, authentication, etc.
Support: You can easily get 24/7 technical support by contacting the hosting provider via phone, email, chat, ticket system, etc. Good hosting providers also provide documentation and tutorials to help the customer with their website or application.
Drawbacks of Managed Hosting
Higher cost: Managed hosting is more expensive than self-managed hosting because the customer has to pay for the additional services and features that the hosting provider offers. The customer may also have to pay extra fees for exceeding limits or using additional resources on their plan.
Less control: You will get less control over the server and its configuration than self-managed hosting. You must also follow the rules and restrictions that the hosting provider sets for their plan.
Vendor lock-in: This is one of the major problems with managed hosting. A lot of hosting providers try to “vendor lock-in” the customer by forcing them to use a proprietary solution for their website.
This is concerning because you may face difficulties in the future should the company remove a certain feature or change the pricing plans. Increase in hosting costs might tempt you to switch to another hosting provider but then you will lose some features or functionality that are specific to their current hosting provider or plan.
Compatibility issues: Managed hosting may cause compatibility issues for the customer because they have to use the software or applications that are compatible with their hosting provider or plan. The customer may not be able to use some software or applications that they want on their website or application.
For example, If you rely on a legacy version of PHP for a certain application and the vendor chooses to phase that out, then your options are limited. You may have to update your plugin or find an alternative one that works with the newer version of PHP. In either case, you will need to solve a problem that was created by your hosting company.
RunCloud: The Best of Both Worlds
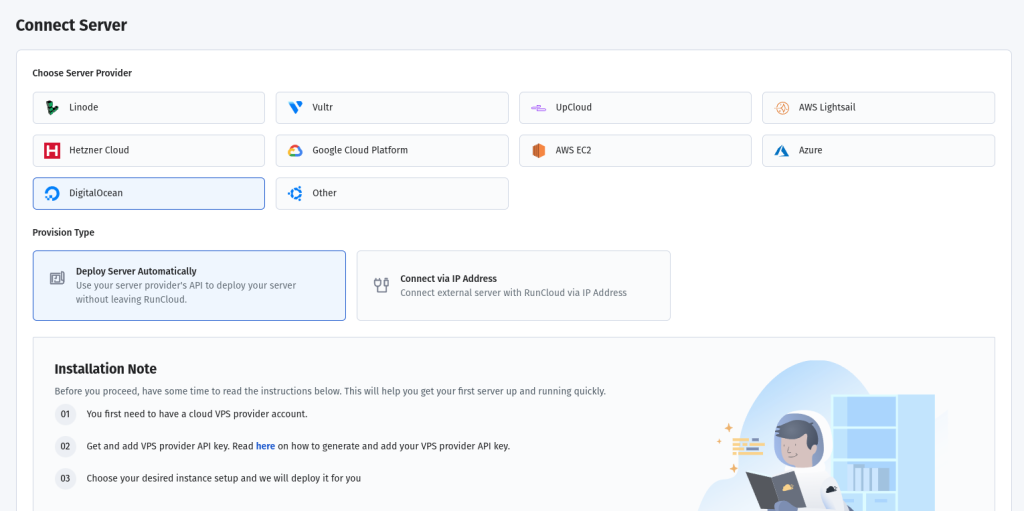
If you are fretting over which hosting option to choose, then worry not – RunCloud brings you the best of both worlds.
RunCloud is a platform that lets you host any web application on your own server, whether it’s on a cloud provider or a private datacenter.RunCloud gives you the benefits of a managed service without the drawbacks of vendor dependency.
With RunCloud, you can instantly deploy new WordPress websites with a few clicks, update DNS records with Cloudflare integration, and enable page caching with the RunCloud Hub plugin.
You can also choose from different server types, such as Nginx+Apache, OpenLiteSpeed, or Docker. Furthermore, you can use the HTTP/3 protocol on your websites for faster loading.
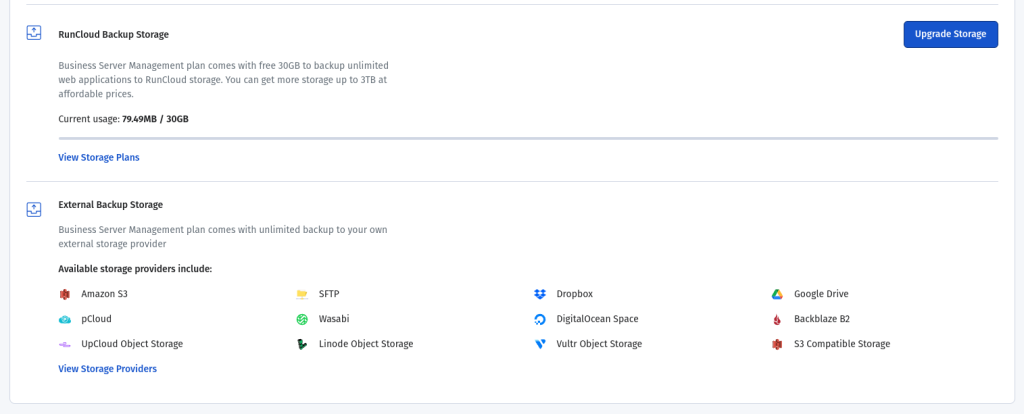
RunCloud provides you complete access to your server, application, database, and even underlying operating system at all times – there is no vendor lock-in. You can also back up your applications to any storage location you prefer, such as AWS S3, DigitalOcean Spaces, SFTP storage, etc.
RunCloud is user-friendly: you can manage your servers from a dashboard without needing Linux skills. But you also have the option to log in to your server via SSH as the root user to customize your server settings if you want. You can also use the Developer API to control your servers programmatically.
RunCloud ensures that your server and web application are secure and protected from any threats or attacks. We automatically update your server and apply security patches to keep it up to date and safe.
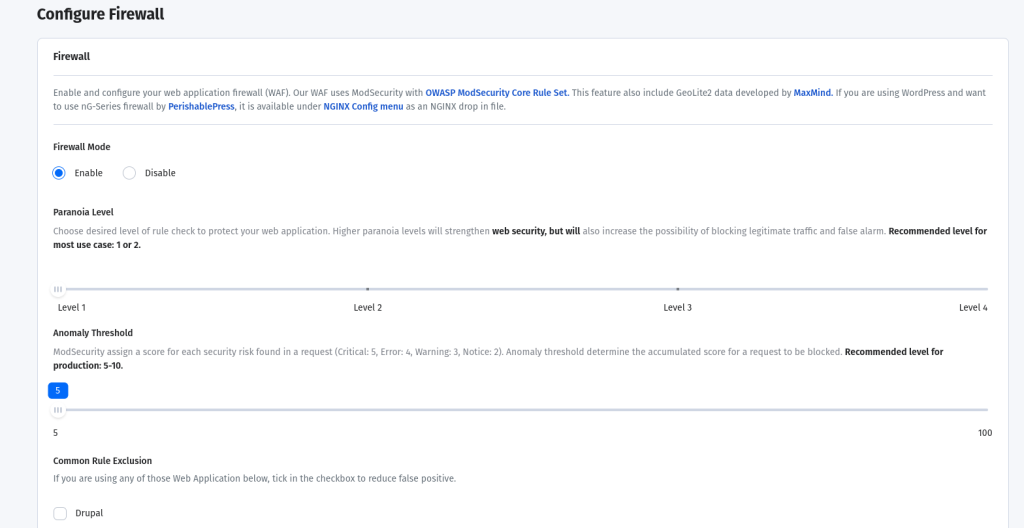
RunCloud also has a built-in firewall and configures Fail2Ban on your server to block automated attacks. Best of all, you can configure Slack, email, and Telegram notifications for key actions on your server – such as ssh login, backup failure, etc., ensuring you stay informed and alert.
Final Thoughts
In this article, we have explained the pros and cons of self-managed and managed hosting for your website or application. Here are some recommendations or tips for choosing a hosting plan that suits your needs and budget:
Consider the type and size of your website or application, the traffic volume and growth rate, and the features and functionality required. These factors will determine the amount of server resources and services that you need.
Compare the cost of different hosting plans based on the criteria such as storage space, bandwidth, CPU cores, RAM, backups, SSL certificates, domains, etc.
Weigh the benefits and drawbacks of each hosting option in terms of performance, reliability, security, scalability, and support. You can use lists or bullet points to summarize the pros and cons of each option.
Givе RunCloud a tеst drivе and discovеr its capabilities in meeting your web hosting requirements. RunCloud lets you to еffortlеssly host any wеb application on your sеlf-ownеd sеrvеr, whеthеr it’s hostеd by a cloud providеr or within a private datacenter.With RunCloud, you gain the advantages of a managed sеrvicе while avoiding the limitations of vendor rеliancе. Sign up for RunCloud today!
The echo command is one of the most basic and frequently used commands in Linux. It’s used to print text, variables, and special characters to the standard output, which is usually the terminal.
However, the echo command can do much more than just printing text.
It can also be used to create files and directories, test and debug scripts and commands, format and display messages, and generate output for other commands or programs.
In this article we’ll show you how to use the echo command in Linux with some practical examples. We will cover the basic syntax of the echo command, as well as some of its options and features.
By the end of this article, you will have a better understanding of how to use the echo command in Linux effectively and efficiently.
Table of Contents
What is the echo Command?
The echo command is a way to communicate with your Linux terminal. It allows you to send text, variables, and special characters to the standard output, which is usually the terminal screen.
The echo command is like a messenger that delivers your words to the terminal. It’s a simple but powerful tool that can be used for various purposes, such as:
Printing text, variables, and special characters to the standard output (e.g., terminal, file, or pipe).
Creating files and directories with specific content.
Testing and debugging scripts and commands.
Formatting and displaying messages, prompts, and menus.
Generating output for other commands or programs.
How to Use the echo Command
Here are some ways of using the echo command in Linux.
Hello World!
To send a text message to the standard output stream, use the echo command with a string argument enclosed in double quotes.
For example, echo “Hello, world!” will write the string “Hello, world!” followed by a newline character to the standard output.
Display Variable
The command echo “$variable” is used to print the value of a variable to the standard output. A variable is a name that represents some data stored in the memory. The $ symbol is used to access the value of a variable.
For example, $USER is a predefined variable that holds the name of the current user. To print the value of $USER, use echo “$USER”. This will display the current user name on the terminal screen.
Print Special Characters
The command echo “\n” is used to print a special character to the standard output. A special character is a non-printable character that has some effect on the output, such as moving the cursor, clearing the screen, or making a sound.
The \ symbol is used to escape the special character, which means to treat it as a literal character instead of its usual meaning. For example, \n is a special character that represents a newline, which moves the cursor to the next line. To print a newline character, use echo “\n”. This will output a blank line on the terminal screen.
There are many other special characters that can be printed with the echo command, such as:
\t: A horizontal tab, which moves the cursor to the next tab stop.
\v: A vertical tab, which moves the cursor down one line and to the same column.
\a: An alert, which makes a beep sound.
\b: A backspace, which moves the cursor back one space.
\r: A carriage return, which moves the cursor to the beginning of the line.
\c: A control character, which suppresses any further output.
You can see the full list of special characters by running man echo on your terminal.
Writing to a File
One of the lesser known functionalities of the echo command is redirecting the output from terminal into files. You can use the echo “content” > file command to create a file with some content to the standard output.
The > symbol is used to redirect the output of the echo command to a file instead of the terminal screen. The file is the name of the file to be created or overwritten. The content is the text to be written to the file.
For example, echo “This is a test file” > test.txt will create a file named “test.txt” with the text “This is a test file”. If the file already exists, it will be replaced by the new content. If the file does not exist, it will be created.
If you want to append content to the end of an existing file, you can use the >> symbol instead of the > symbol. The >> symbol will redirect the output of the echo command to the end of the file without deleting the previous content.
For example, echo “This is another line” >> test.txt will add the text “This is another line” to the end of the test.txt file, without erasing the text “This is a test file”. This way, you can add more content to a file without losing the original content.
Writing to Both Terminal and File
You might encounter cases where you need to display content in the terminal and store it in a file as well. In this case, you can use the echo “content” | tee file command to create a file with some content to the standard output.
The | symbol is used to pipe the output of the echo command to another command, which is tee in this case. The tee command is used to write the input to both the standard output and a file or files. The file is the path of the file to be created or overwritten. The content is the text to be written to the file and displayed on the terminal screen.
Debug Dynamic Commands
If you are executing dangerous commands in the terminal, then it can go very bad, very quickly.
The rm -rf * command will delete all files and directories in the current working directory recursively and forcefully with a single key press. This is a very dangerous command that can cause irreversible data loss.
By using echo before the command, you can see what files and directories will be deleted without actually deleting them.
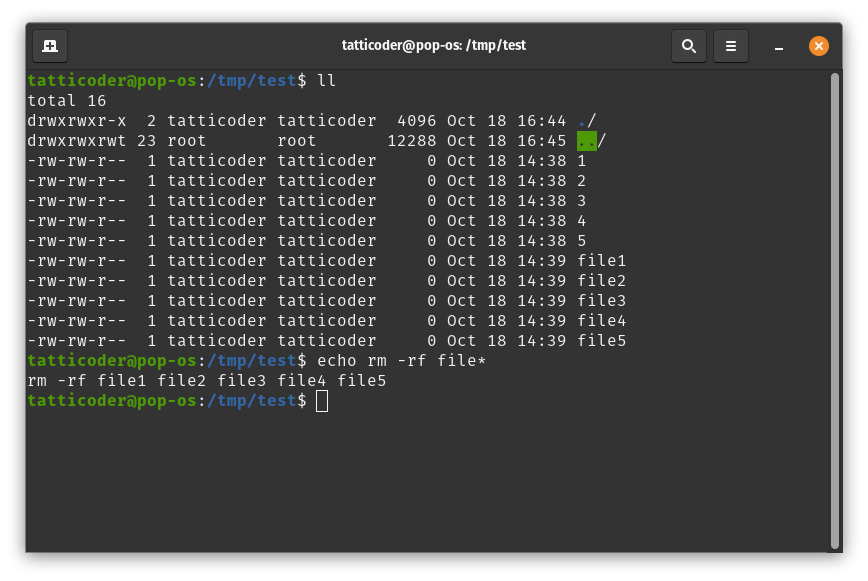
The command echo rm -rf * is a way to check how the command rm -rf * will be composed without actually executing it. The echo command will print the command or script to the standard output, which is usually the terminal screen. This can help you avoid mistakes and errors.
For example, if you want to delete all the files in the current directory that start with a certain prefix, you can do so using the following command.
echo rm -rf <prefix>*
In the above example we can see that our current directory has a total of 10 files, but since we used a prefix, only the files which matched the pattern were listed in the output. Once you are sure that this is the command that you want to execute, you can remove the echo from the beginning of the command and execute it as you normally would.
Show Formatted Text
The echo command is often considered a boring and simple command that only prints plain text to the terminal. However, this is not true. You can jazz up your output with a dash of color and style by using some special characters and options.
Let’s see how to make your terminal more colorful and attractive with the echo command with the help of an example:
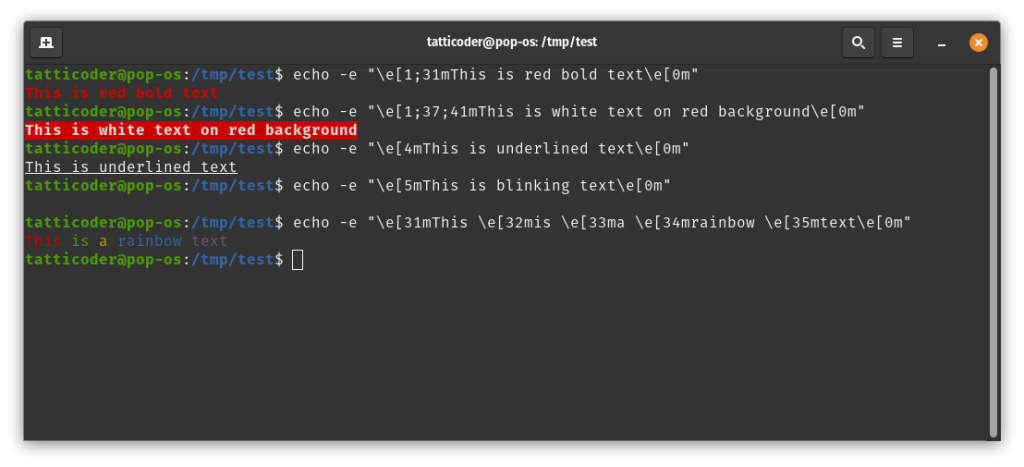
The -e flag in echo is used to enable the interpretation of special characters, such as \e, which are used to create colors and effects.
The \e[1;37;41m part is used to set the style, color, and background of the text. The \e symbol indicates the start of an escape sequence, which is a way to control the terminal behavior. The [ symbol indicates the start of a parameter list, which consists of numbers separated by semicolons. The m symbol indicates the end of the escape sequence. The numbers in the parameter list have different meanings, such as:
1: This means to make the text bold.
37: This means to set the foreground color (the color of the text) to white. The color codes range from 30 to 37 for standard colors, and from 90 to 97 for bright colors.
41: This means to set the background color (the color behind the text) to red. The background color codes range from 40 to 47 for standard colors, and from 100 to 107 for bright colors.
After this, you can enter the text to be printed with the specified style, color, and background.
The \e[0m part is used to reset the style, color, and background of the text to the default values. The \e symbol indicates the start of an escape sequence, and the [0m part indicates the end of the escape sequence with a parameter of zero, which means to reset all attributes.
Therefore, the command echo -e "\e[1;37;41mThis is white text on red background\e[0m" will print “This is white text on red background” in bold white letters on a red background, and then reset the terminal settings to normal.
Some more ideas of displaying pretty output in terminal with the echo command are:
To display a message with an underline, use \e[4m. For example, echo -e "\e[4mThis is underlined text\e[0m" will print “This is underlined text” with an underline.
To display a message with a blinking effect, use \e[5m. For example, echo -e "\e[5mThis is blinking text\e[0m" will print “This is blinking text” with a blinking effect.
To display a message with different colors on each word, use \e[colorm before each word. For example, echo -e "\e[31mThis \e[32mis \e[33ma \e[34mrainbow \e[35mtext\e[0m" will print “This is a rainbow text” with different colors for each word.
You can combine different styles and colors to create more interesting and attractive output in your terminal. However, you should also be aware that not all terminals support these features, and some may display them differently.
You can see the list of available colors and styles by running man console_codes on your terminal.
Execute Other Commands
In a previous section, we discussed how echo can be used to debug commands without executing them. Now let’s see how it can be used to execute commands in bash.
We know that the date command is a Linux utility that displays the current date and time. We can use it along with the echo command to print the output of the date command as a string, and format it accordingly.
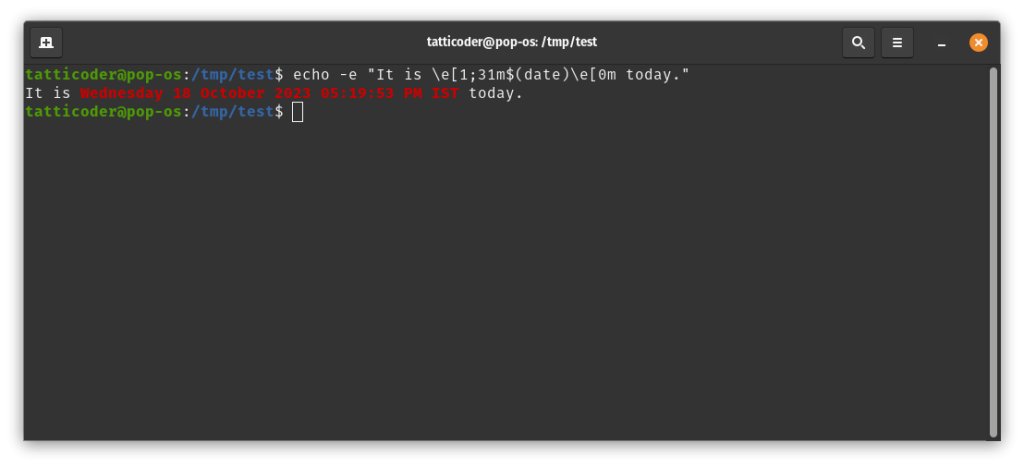
The command echo $(date) will print the current date and time to the standard output. The $(date) part is an example of command substitution, which is a way to execute a command and replace it with its output. For example, if you run echo -e "It is \e[1;31m$(date)\e[0m today.", you might see something like this:
We already briefly mentioned in one of the previous sections that the | operator can be used to redirect output from the first command to the other.
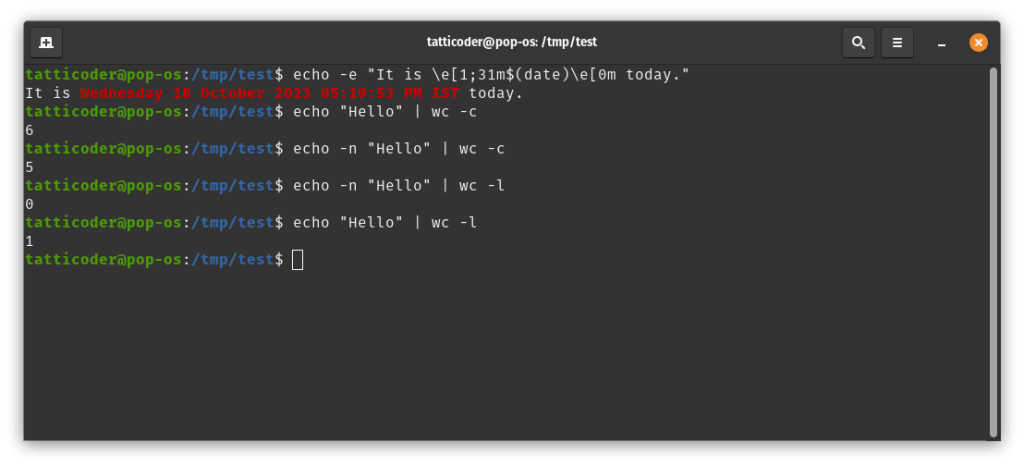
For example, the echo "Hello" | wc -c command can be used to print the number of characters in “Hello” to the standard output. The “Hello” part is a string argument for the echo command. The | symbol is used to pipe the output of the echo command to another command, which is wc -c in this case.
The wc -c command is used to count the number of bytes in the input. The echo command will send the string “Hello” to the standard input of the wc -c command, which will count the number of bytes in “Hello” and print it as a number. Note that the number 6 includes the newline character that the echo command adds by default. If you want to exclude the newline character, you can use the -n option for the echo command, which will suppress the newline. For example, if you run echo -n "Hello" | wc -c, you will see something like this:
As you can see, using the echo command with command substitution or pipes can help you generate output for other commands or programs that can process or display it. You can use this technique to create dynamic and interactive output in your terminal.
When Not to Use the echo Command
The echo command is a great tool for printing simple text messages to the terminal, but it has its limitations. Sometimes, you may need to print data that is more complex, structured, binary, or more sensitive than plain text. In these cases, the echo command may not be suitable, and you may want to use other tools that are more specialized and secure.
Here are some examples of such cases, and the tools you can use instead of the echo command:
If you need to print complex or structured data, such as JSON, XML, or tables, the echo command may not be able to preserve the formatting and indentation of the data. You may want to use tools such as jq, xmllint, or column, which can parse and pretty-print JSON, XML, or tabular data respectively.
If you need to print binary data, such as images, audio, or video, the echo command may not be able to display them properly in the terminal. You may want to use tools such as cat, hexdump, or base64, which can output binary data as raw bytes, hexadecimal numbers, or base64-encoded strings respectively.
If you need to print sensitive or confidential information, such as passwords, keys, or tokens, the echo command may not be able to protect them from being exposed or intercepted. You may want to use tools such as gpg or openssl, which can encrypt and decrypt data using various algorithms and keys.
As you can see, there are many alternatives to the echo command that can handle different types of data more effectively and securely. You can choose the best tool for your needs depending on the nature and format of your data.
After Action Report
We hope you enjoyed this article and learned something new about the echo command in Linux. The echo command is a versatile and useful tool that can help you create and communicate with your Linux environment. Feel free to experiment with it and discover its potential!
We would love to hear from you about your own use cases of the echo command. How do you use it in your daily tasks? What are some of the creative and fun ways you have used it? Please share your thoughts and experiences in the comment section below. We appreciate your feedback and suggestions!
We understand that Linux can be intimidating for some people, especially if they are not familiar with the terminal. That’s why we recommend RunCloud as the best platform to manage your Linux servers. RunCloud provides a helpful dashboard that lets you easily deploy and manage your servers, applications, and websites without messing with the terminal.
However, if you want to tinker under the hood, RunCloud also gives you the freedom and flexibility to access and customize your server settings via SSH or SFTP. RunCloud is the perfect solution for both beginners and experts who want to get the most out of their Linux servers.
If you want to experience RunCloud for yourself, you can sign up for RunCloud and enjoy a 14-day, risk-free trial.
If you’re new to the command line and Linux, fear not! You don’t need to be a Linux expert to start using the power of the terminal.
In this article, we’ll demystify the ‘for’ loop in Bash scripting. Whether you’re a developer, sysadmin, or just curious about the command line, understanding ‘for’ loops is essential.
Why Are ‘For’ Loops Necessary?
The ‘for’ loop is a fundamental construct that allows you to repeat a set of commands or actions multiple times. It’s like having a trusty assistant who diligently performs a task for you over and over again. Whether you’re processing files, managing directories, or automating tasks, there are many scenarios when loops are useful:
File Processing and Batch Operations:
Loop through files in a directory to perform batch operations, such as renaming, moving, or compressing them.
Process log files, extract relevant information, and generate reports.
System Administration and Configuration:
Iterate over a list of user accounts to apply changes (e.g., setting permissions, updating passwords).
Configure network interfaces, firewall rules, or services on multiple servers.
Backup and Archiving:
Create backup scripts that loop through directories and files to archive or synchronize data.
Rotate log files by compressing older logs and keeping a specified number of recent ones.
Automating Repetitive Tasks:
Run commands on multiple remote servers via SSH.
Schedule regular tasks (e.g., backups, database maintenance) using cron jobs.
Data Processing and Transformation:
Parse CSV files or other structured data formats.
Transform data (e.g., converting file formats, extracting specific fields).
Loops in general are versatile and can be adapted to various scenarios. They allow you to iterate over lists, directories, or any other collection of items in your scripts.
In this post, we’ll explore the basic syntax of ‘for’ loops, and demonstrate their versatility with practical examples. By the end, you’ll be ready to wield this powerful tool in your Linux journey.
Basic Syntax of Bash ‘For’ Loop
A 'for' loop is a control structure in programming that allows you to repeat a set of commands for each item in a list. It’s like a conveyor belt that processes each item one by one.
Syntax:
for variable in list: This line initializes a loop. The variable represents the current item from the list.
do: This marks the beginning of the loop body.
# Commands to execute for each item in the list: Here, you can put any commands or actions you want to perform on each item.
done: This marks the end of the loop.
for variable in list
do
    # Commands to execute for each item in the list
done
Explanation:
You define a variable (usually a single letter) to keep track of the current item.
The list contains multiple items (e.g., filenames, numbers, or strings).
For each item in the list, the commands inside the loop are executed.
Once all items are processed, the loop ends.
Execution Frequency:
The for loop executes once for each item in the specified list.
If there are n items in the list, the loop will run n times.
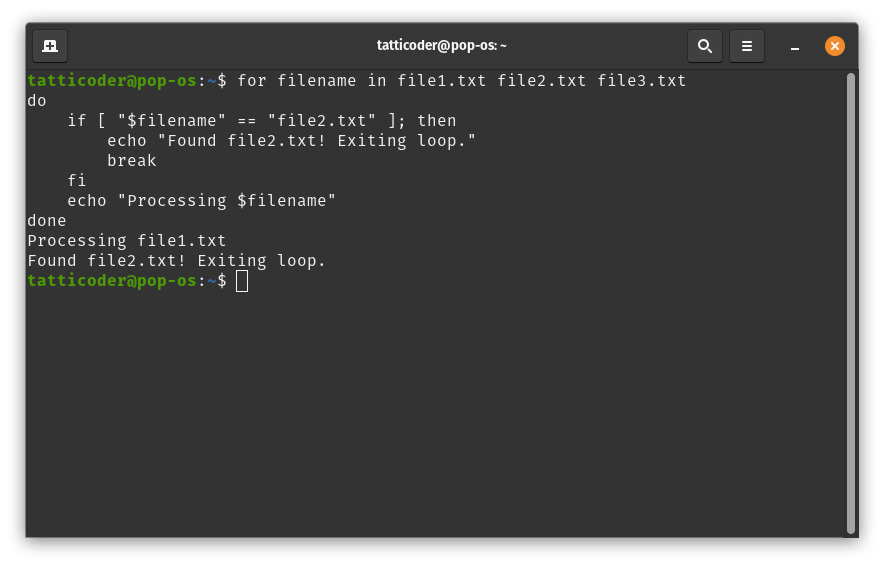
For example, if you have a list of three filenames (file1.txt, file2.txt, and file3.txt), the loop will execute three times, once for each filename.
for filename in file1.txt file2.txt file3.txt
do
    if [ "$filename" == "file2.txt" ]; then
        echo "Found file2.txt! Exiting loop."
        break
    fi
    echo "Processing $filename"
done
Using Bash ‘For’ Loop
Looping through Files and Directories
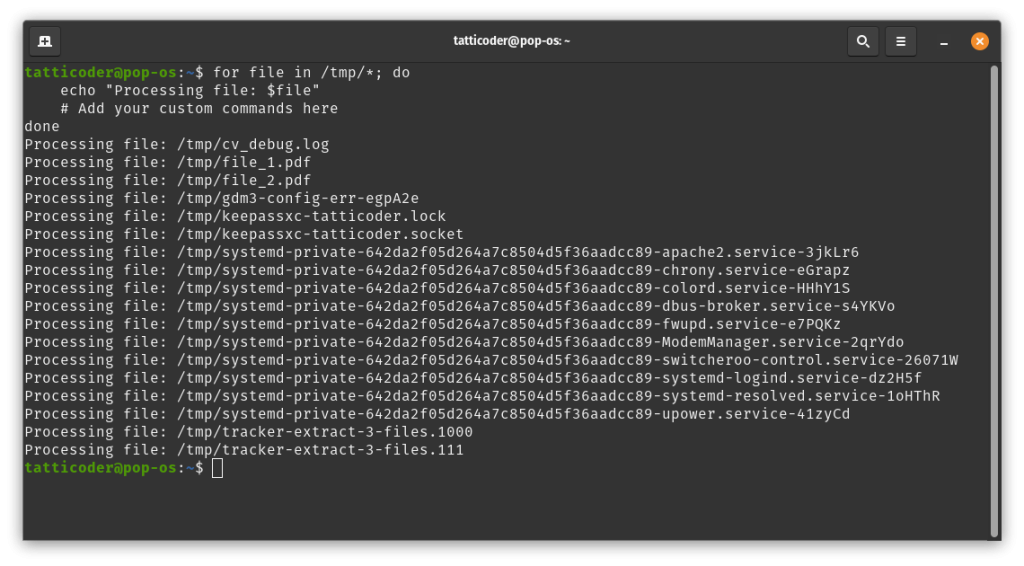
You can use a 'for' loop to process files or directories. This is ideal if you want to traverse through a directory which has a large number of files, or if the number of files keep changing.
#!/bin/bash
for file in /path/to/files/*; do
    echo "Processing file: $file"
    # Add your custom commands here
done
Iterating over a Range of Numbers
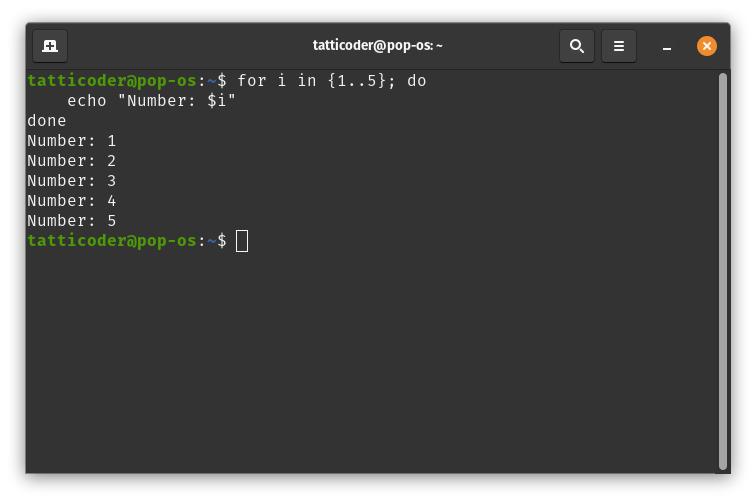
To loop through a range of numbers, use the {start..end} notation. If you want to run the loop a fixed number of times, you can create a list of numbers using this format.
#!/bin/bash
for i in {1..5}; do
    echo "Number: $i"
done
Using ‘for’ with Command Substitution
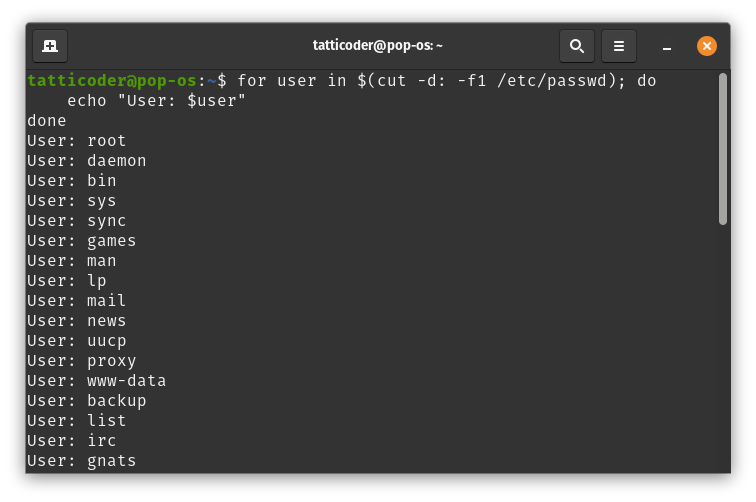
The ‘for’ loop is flexible and powerful. You can redirect the output of other commands in the loop, and then process each item in the list.
#!/bin/bash
for user in $(cut -d: -f1 /etc/passwd); do
    echo "User: $user"
done
Nested ‘for’ Loops
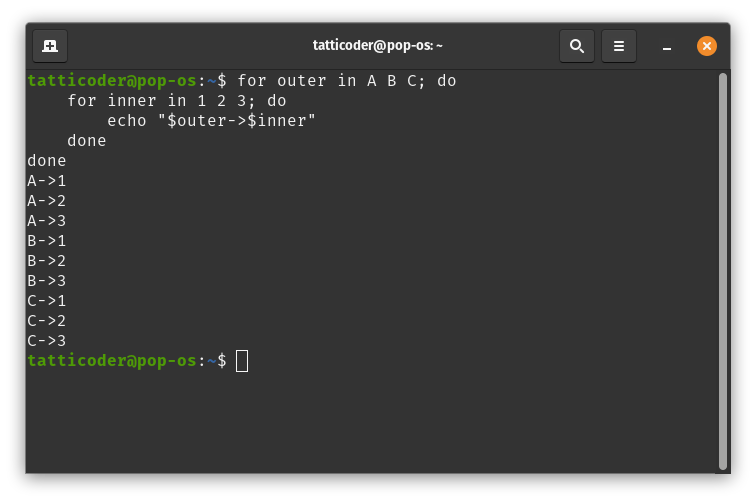
If a simple ‘for’ loop isn’t enough, you can use multiple ‘for’ loops together to achieve more complex functionality.
#!/bin/bash
for outer in A B C; do
    for inner in 1 2 3; do
        echo "$outer->$inner"
    done
done
Final Thoughts
You’ve now unlocked the potential of Bash for loops. It is like a Swiss Army knife for your command line adventures. Mastering the ‘for’ loop opens up endless possibilities for automating tasks and managing data efficiently in your Linux environment.
Remember, the command line need not be intimidating, but if you do find it a bit daunting then you should check out RunCloud, a web platform to manage your servers that works with any cloud provider. Sign up for RunCloud and experience the best of both worlds:
Web-Friendly Dashboard: Get started quickly without diving into complex Linux commands. RunCloud provides an intuitive interface for managing your servers.
Command Line Freedom: If you’re a terminal enthusiast, RunCloud gives you the flexibility to tinker with the command line whenever you wish.
Cloud storage is a vital service for developers who need to store and access large amounts of data on the cloud. However, choosing the right cloud storage provider can be challenging, as there are many factors to consider, such as pricing, performance, reliability, compatibility, and features.
In this article, we will compare two popular cloud storage services: Cloudflare R2 and AWS S3. We will look at the similarities and differences between these two services in terms of their pricing, performance, reliability, compatibility, and features. Let’s get started!
What Is AWS S3?
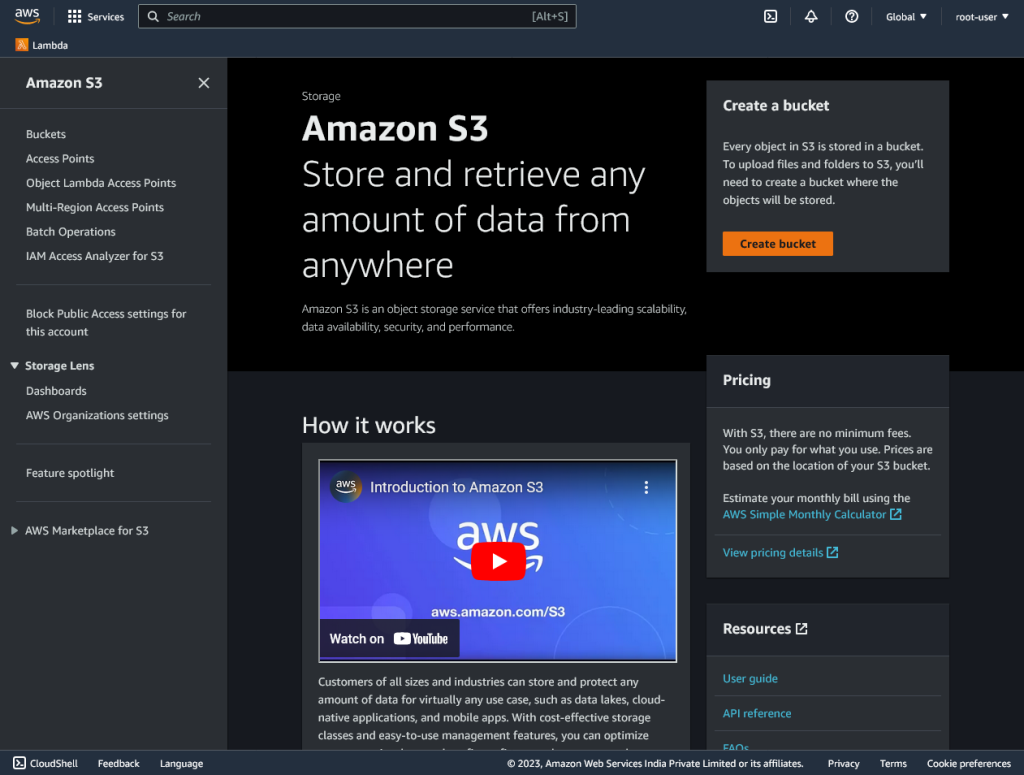
AWS S3 is short for a simple storage solution, it is a cloud-based service that stores data. It lets you store and access any amount of data over the internet. Data is stored in buckets, you can create buckets to organize your data and control who can access it. Customers are charged a monthly fee for storing their data and a network fee for each time it is requested over the internet.
S3 can be used to host static websites, backup files, archive data, and integrate with other AWS services. S3 is highly scalable, reliable, and secure – and above all, has a thriving ecosystem and community.
What is Cloudflare R2?
Cloudflare R2 is a cloud storage service that lets you store and access data over the internet. The most attractive feature of this service is the absence of network egress fees. However, customers are still charged a monthly fee for storing their data, changing it, and reading it. It is compatible with the S3 API, which means you can use existing tools and libraries to work with your data.
R2 can be integrated with Cloudflare Workers, a serverless platform that lets you run code at the edge. R2 is globally distributed and integrated with Cloudflare’s CDN, which makes it fast and reliable.
Cloudflare R2 vs AWS S3: Features Comparison
Storage Options
Both Cloudflare R2 and AWS S3 do not have a limit on the amount of data that can be stored in a bucket. You can store as much data as you like. However, there is a limit on the size of individual objects. A single object can be a maximum of 5 TB, and to upload files larger than 5GB, you have to use the multipart upload process.
AWS S3 offers a range of storage options for different use cases and performance requirements. The main storage options are:
S3 Standard: This is the default storage option for frequently accessed data. It is suitable for cloud applications, dynamic websites, content distribution, and big data analytics. The first 50 TB of data costs $0.023 per GB every month.
S3 Intelligent-Tiering: This is a storage option that automatically moves data to the most cost-effective access tier based on access frequency without performance impact or operational overhead. It is ideal for data with unknown or changing access patterns, such as long-lived data sets that are accessed infrequently but require rapid access when needed.
It has a complex pricing structure – Frequent, Infrequent, and Archive Instant Access Tier are all priced differently, starting at $0.023, $0.0125, and $0.004 per GB per month. In addition to this, customers are also charged a monitoring and automation fee for objects greater than 128 KB which costs $0.0025 per 1,000 objects.
S3 Standard-Infrequent Access: This storage option is for less frequently accessed data that still needs to be available quickly when accessed. It is suitable for backups and disaster recovery. It costs $0.0125 per GB per month.
S3 One Zone-Infrequent Access: This is similar to the above option except that S3 Standard-IA stores data across multiple Availability Zones, while S3 One Zone-IA stores data in a single Availability Zone and has a lower cost. It is more suitable for re-creatable data that is not important. This storage class is priced at $0.01 per GB.
S3 Glacier Instant Retrieval, S3 Glacier Flexible Retrieval (formerly S3 Glacier), and S3 Glacier Deep Archive: These are storage options for archiving data that is rarely accessed and does not require immediate access. They offer different retrieval times and costs depending on the urgency of the data access. They are suitable for long-term archiving and digital preservation of data. For example, if you need to store a large number of logs for regulatory purposes, this is the right choice for it. Data stored in Instant Retrieval ($0.004/GB), Flexible Retrieval ($0.0036/GB), and Deep Archive ($0.00099/GB) can be accessed within a couple of milliseconds, or it can take up to 12 hours.
S3 Outposts: This is a storage option for storing S3 data on-premises using AWS infrastructure. This service extends AWS infrastructure and services to customer sites. It is suitable for data residency requirements that cannot be met by an existing AWS Region and costs tens of thousands of dollars per month.
You can also use S3 Lifecycle policies to automatically transition objects between storage options. All the prices mentioned above are for the North Virginia region of AWS, the exact prices vary from region to region.
Cloudflare R2 provides only one storage class and does not change prices based on location. The first ten GB of storage, ten million read operations and one million write operations are free every month. Beyond the free limit, you can pay $0.015/GB for storage, $0.36, and $4.50 for a million write and read operations, respectively.
The buckets are created automatically in a region closest to you, you can suggest a suitable location for your bucket, but it is not guaranteed. The object life cycle feature (currently in beta) from Cloudflare can automatically delete objects that are older than a certain time period – this is great for reducing billing costs.
Security
Cloudflare R2 encrypts your data at rest – all objects stored in R2, including their metadata, are encrypted at rest using AES-256. The encryption keys are stored and managed by Cloudflare internally. In addition to this, Cloudflare adheres to industry-standard security compliance certifications, such as SOC 2 Type II, PCI DSS Level 1, ISO 27001/27002, GDPR, and CCPA.
AWS S3 on the other hand offers far more flexibility. AWS S3 supports server-side encryption with three key management options: SSE-KMS, SSE-C, and SSE-S3, as well as client-side encryption. SSE-KMS allows you to use AWS Key Management Service (KMS) or your own customer master keys (CMKs) to encrypt your data. SSE-C allows you to provide your own encryption keys. SSE-S3 uses keys that are managed by S3 and protected by AWS KMS1. These options are not available in Cloudflare R2.
Although both Cloudflare and AWS use TLS to encrypt your data in transit, AWS takes it one step further by offering AWS PrivateLink, a service to establish a private connection between your VPC and S3 – this transfers your data without exposing it to the internet.
AWS S3 maintains compliance programs, such as PCI-DSS, HIPAA/HITECH, FedRAMP, EU Data Protection Directive, and FISMA, to help you meet regulatory requirements. AWS S3 also provides various mechanisms to control access to your data, such as AWS Identity and Access Management (IAM), Access Control Lists (ACLs), bucket policies, query string authentication, and pre-signed URLs.
Cloudflare R2 on the other hand has a much less mature ecosystem. The only option to transfer data is by either using its Super Slurper service for one time migrations or Sippy for incremental data migration.
Other Features
Cloudflare R2 is still evolving and growing, it has a limited number of features that work well in certain environments. You can use it with Cloudflare Workers, a serverless runtime, to bind a bucket to a Worker and change objects on the fly as they go in or out of R2 storage buckets.
AWS S3, on the other hand, offers a solution for all your requirements and offers many features that are not available on Cloudflare R2.
AWS Marketplace
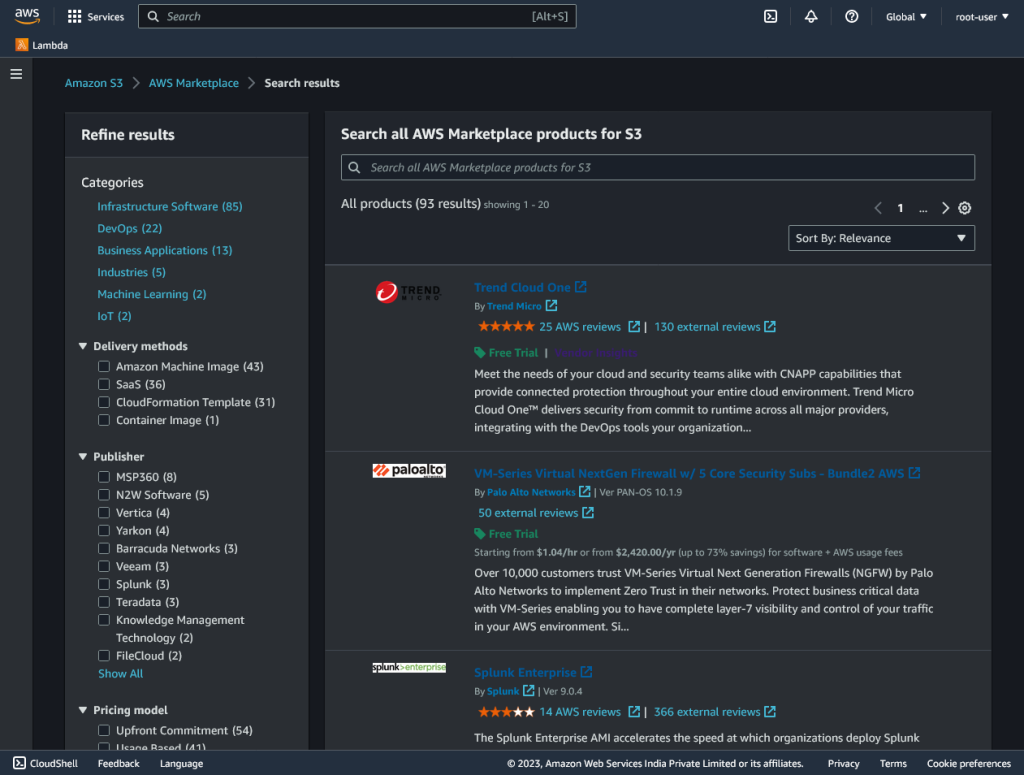
AWS Marketplace for S3 allows you to explore and subscribe to third-party software products that are built for Amazon S3 from within the S3 Management Console. You can choose from various product types, such as SaaS, AMI, CFT, and containers.
There are solutions available for many categories, such as Storage, backup and Recovery, Data Integration and Analytics, Observability and Monitoring, Threat Detection, and Permissions. The marketplace helps streamline the process of deploying software solutions that run on AWS.
Bucket Versioning
AWS S3 bucket versioning is a feature that allows you to keep multiple versions of an object in the same bucket. You can use bucket versioning to preserve and restore every version of an object stored in your bucket. This can help you recover objects from accidental deletion or overwriting.
By default, your bucket is unversioned, which means that there is only one version of each object in the bucket. If you enable versioning for a bucket, AWS S3 automatically generates a unique version ID for each object that is stored or modified in the bucket.
If you overwrite an object in a versioned bucket, AWS S3 adds a new version of the object in the bucket. The previous version remains in the bucket, you can still access and restore the previous version of the object if you need to.
Object Locking
Object locking in AWS S3 is a feature of versioned buckets that allows you to store objects using a write-once-read-many (WORM) model. This can help prevent objects from being deleted or overwritten for a fixed amount of time or indefinitely. It is useful if you need to meet regulatory requirements that require WORM storage or add an extra layer of protection against object changes and deletion.
Object locking provides two retention modes: governance mode and compliance mode. These retention modes apply different levels of protection to your objects. In governance mode, users can’t overwrite or delete an object version or alter its lock settings unless they have special permissions. In compliance mode, a protected object version can’t be overwritten or deleted by any user, including the root user in your AWS account. When an object is locked in compliance mode, its retention mode can’t be changed, and its retention period can’t be shortened.
Performance and Reliability
Both Cloudflare and AWS are the titans of the cloud industry and boast 99.999999999% (eleven 9’s) of annual durability. This is very hard to interpret, let’s understand this with the help of an example. Imagine you have a big bucket of rice with one billion grains, if your bucket offered similar reliability then you will lose a maximum of one grain every year.
Both cloud services are globally distributed, have redundancy built into their infrastructure, and offer a similar level of performance and reliability.
Cost
Cloudflare takes pride in its simple pricing plans. It offers a generous free tier, beyond which customers are charged $0.015 per GB of storage, $4.50 for million operations that change the state of the object, and $0.36 per million object reads every month. Cloudflare R2 does not charge any network egress fee.
AWS, on the other hand, is infamous for its complex pricing structure. Even for experienced professionals, calculating your AWS bill is an arduous ordeal. You are charged separately for each storage class, you pay a fee for requests made against your buckets, and you pay for all bandwidth into and out of Amazon S3 (except in a few cases). There is an additional data retrieval fee for reading data from certain storage classes. Moreover, if you are using storage management features such as Amazon S3 Inventory, S3 Storage Class Analysis, etc. then you will be billed for them separately.
You can use R2 Calculator and Amazon S3 calculator to calculate an estimate of your monthly bill. Let’s compare both services with the help of a few examples.
Example 1
Let us assume you store 10000 GB of data in a cloud bucket that is frequently accessed from North Virginia. You perform 5000000 write operations and 25000000 read operations every month. The above scenario will cost you $265 ($230 for storage, $25 for PUT requests, and $10 for GET requests) every month when using AWS S3 Standard. A similar solution will cost $173.25 per month on Cloudflare.
If you are serving traffic to the internet, then AWS will also levy an outbound data transfer fee. If you transfer 10TB of data, you will be charged $921 per month. Cloudflare does not charge any network egress fee.
In this scenario, if you use AWS S3, you will end up paying $1,186.60 ($265+$921) every month whereas if you use Cloudflare R2, you will only need to pay $174 per month.
Example 2
In this scenario, let’s assume you need to store 100000 GB of data that is seldom accessed. On AWS, there is a special storage class for such objects, S3 Glacier Deep Archive. If you perform 5000 write operations every month and a negligible amount of read requests and outbound data transfer, then your AWS bill will be approximately $100 whereas Cloudflare will charge you nearly $1500.
Cloudflare R2 is a new and upcoming service. It has not fully matured yet and still has some room for improvement. It has lower prices than AWS S3 and can be a good option for delivering data on the web. However, it does not have all the features and flexibility offered by S3.
In short: It’s a good option for some use cases – in fact, in some cases, even a great solution – but not to be considered a drop-in substitute for S3 and what it’s capable for (especially if you already use AWS for various other parts of your architecture.
If you’re tired of managing your own servers – you might want to check out RunCloud (yep, that’s us!). RunCloud is built for developers that want to focus on shipping great work, not on managing their infrastructure. Painless server configuration, so you don’t need to spend hours figuring it out – get started with RunCloud today & get up and running in minutes.
LSCache is a built-in page caching feature of the OpenLiteSpeed web server that can significantly improve the speed and performance of your website by storing frequently accessed data in a cache.
In this article, we’ll show you exactly how to use LSCache on RunCloud servers in web applications that don’t already have built-in LSCache support.
Prerequisites
Before you start, you’ll need to have the following:
A RunCloud account, and a connected server with the OpenLiteSpeed stack.
A web application installed on your server.
How to Choose Between Public and Private Caching
Caching is a technique that allows the web server to store frequently accessed data in a temporary storage area, called a cache. This can improve the speed and performance of the website by reducing the amount of time it takes for the server to process and retrieve the data when a user requests a page.
What is Public Caching?
Public caching, also known as shared caching, is when the cache is used by more than one client. For example, a reverse proxy or a gateway cache can act as a public cache for multiple users.
Public caching can offer a greater performance gain and a much greater scalability gain, as a user may receive cached copies of web pages without ever having obtained a copy directly from the origin server themselves.
For example, if you have a website that sells books, you might want to use public cache for the pages that show the book details, reviews, or categories. These pages are the same for all users, and so can be served from a public cache.
What is Private Caching?
A private cache, however, is only accessible to an individual visitor. It usually contains information that is only relevant to that particular user, such as the WordPress admin bar, the shopping cart, or their profile page. When a page is privately-cached, there is a separate, personalized copy stored for each user that requests it.
For example, if you have a website that sells books, you might want to use a private cache for the pages that show the user’s order history, wishlist, or recommendations. These pages are different for each user, and so should not be served from a public cache.
When to Use Public Caching, Private Caching, or No Caching
Each particular URL of a website can be set up to be publicly cached, privately cached, or not cached at all, but cannot be both publicly and privatly cached at the same time. That is to say, you can only set up one cache type for a particular URL. Depending on the situation, you might want to set different URLs to be cached differently. The following outlines a few scenarios helpful in determining which type of caching should be used for a URL or a set of URLs.
Use public caching for web pages that:
Do not change frequently.
Have high demand (requested frequently).
Are not sensitive or confidential.
Do not depend on who is looking at them.
Use private caching for web pages that:
Can only be used by one user/client, such as personal information on a website (for authorized users).
Use resources such as documents that are only available for one particular user or authorized users.
Generates responses with cookies.
Use no caching for web pages that:
Use a POST request.
Have dynamic content (such as time sensitive info).
Change frequently.
Should not be stored, such as the user’s payment details.
How Cache Settings are Inherited and Overridden in LiteSpeed Servers
Cache settings can be configured at different levels, such as server, virtual host, context, and script handler. The settings at each level affect how the cache works for the web pages under that level.
Cache settings follow a general-to-specific hierarchy, and specific settings override general settings. This means that:
Cache settings at the server level apply to all web pages on the server, unless they are overridden by lower-level settings.
Cache settings at the virtual host levelapply to all web pages under that virtual host (web application), unless they are overridden by lower-level settings.
Cache settings at the context level apply to all web pages under that context (location), unless they are overridden by lower-level settings.
For example, if you enable public cache at the server level, but disable it at the virtual host level, then public cache will be disabled for all web pages under that virtual host.
Enabling Caching
To use LSCache on RunCloud servers, you need to do the following steps:
1. Enable the LSCache Module at Server Level
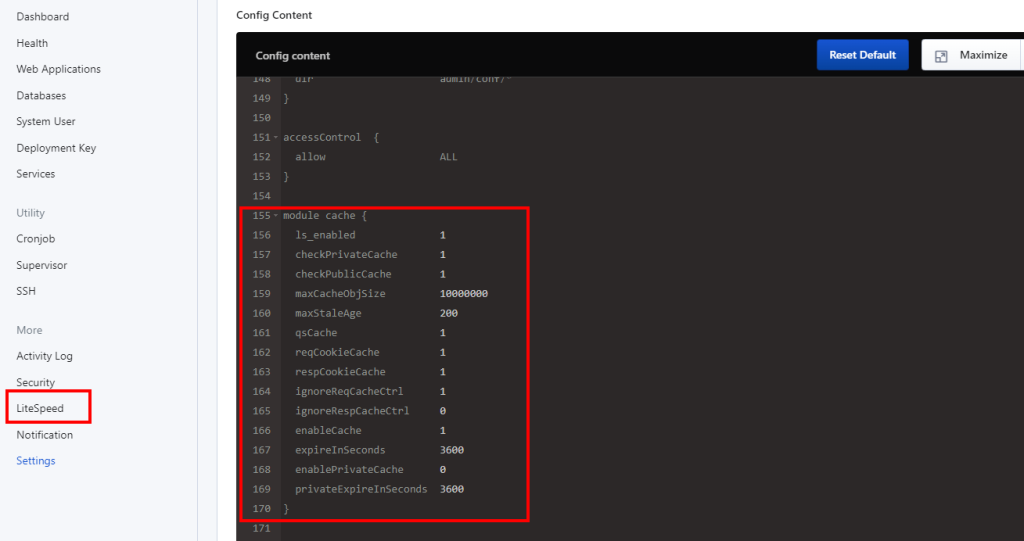
The first step is to enable the LSCache module on your OpenLiteSpeed server. You can do this by logging into the RunCloud dashboard, navigating to the server dashboard, and clicking on the “LiteSPeed” button in the left menu.
Here, you can edit the module cache block and set the following settings at the server level:
module cache {
  ls_enabled              1 # Enable LSCache module
  storagePath $VH_ROOT/lscache # Set the cache storage path
  checkPrivateCache   1 # Enable checking private cache
  checkPublicCache    1 # Enable checking public cache
  maxCacheObjSize     10000000 # Set the maximum cache object size in bytes
  maxStaleAge         200 # Set the maximum stale age in seconds
  qsCache             1 # Enable caching URIs with query strings
  reqCookieCache      1 # Enable caching requests with cookies
  respCookieCache     0 # Disable caching responses with Set-Cookie header
  ignoreReqCacheCtrl  0 # Respect the cache control settings in the request
  ignoreRespCacheCtrl 0 # Respect the cache control settings in the response
  enableCache         1 # Enable public cache
  expireInSeconds     3600 # expiration time for public cache in seconds
  enablePrivateCache  0 # Disable private cache
  privateExpireInSeconds 3600 # expiration time for private cache in seconds
}
You can also adjust other settings according to your preferences and needs, such as expireInSeconds, maxStaleAge, qsCache, etc. You can find more information about these settings in the OpenLiteSpeed documentation.
After editing the module cache block, save the changes and restart the OpenLiteSpeed server.
2. Configure Virtual Host-Level Cache Settings
If you have more than one web application on your server, you may want to customize the cache settings for each virtual host. If you do not configure any cache settings at the virtual host level, then the cache settings at the server level will be inherited.
To configure cache settings at the virtual host level, you need to add the cache module under each virtual host, and edit the OpenLiteSpeed config file to configure settings in the same way that you did at the server level.
Using the .htaccess File
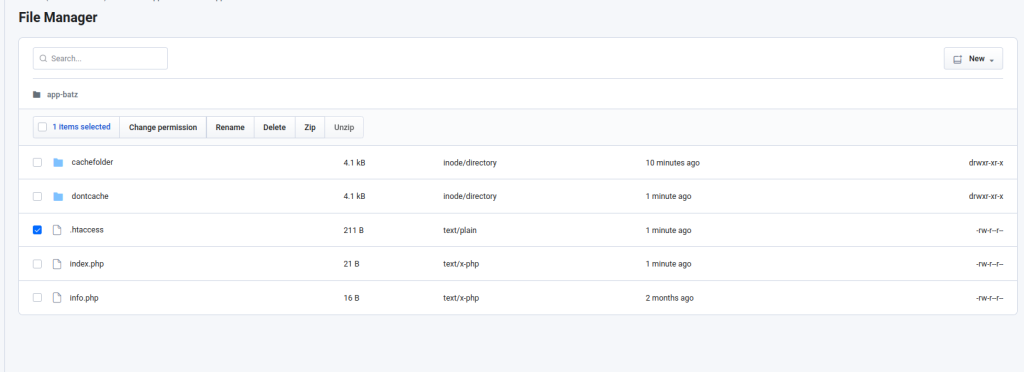
An .htaccess file is a configuration file that allows you to override the server settings for a specific directory or web application. You can use our file manager tool on our panel to create and edit .htaccess files.
Log in to the RunCloud panel and navigate to the file manager tool
The next step is to locate the web app root folder of your web application. The web app root folder is the directory where your web application files are stored. For example, if your web application serves content from /public, then that is your web app root folder.
Click the New File button and enter ‘.htaccess’ as the file name (including the full stop/period at the start of the filename).
Finally, open the .htaccess file with the file manager tool and add rewrite rules. Rewrite rules are instructions that tell OpenLiteSpeed how to handle requests for certain URLs or conditions. You can use rewrite rules to enable or disable caching for specific URLs or web pages.
To enable cache via .htaccess, you can add this script to the .htaccess file:
<IfModule LiteSpeed>
RewriteEngine On
RewriteRule (.*\.php)?$ - [E=cache-control:max-age=120]
</IfModule>
This will cache all .php files on your web application for 120 seconds.
To enable cache for your entire website except /private URL, you can try something like this:
<IfModule LiteSpeed>
RewriteEngine On
## cache should be available for HEAD or GET requests
RewriteCond %{REQUEST_METHOD} ^HEAD|GET$
# excluding certain URLs
RewriteCond %{REQUEST_URI} !/(private)/$
# cache for 2 mins for php pages only
RewriteRule /(.*\.php)?$ - [E=Cache-Control:max-age=120]
</IfModule>
This will exclude /private URL from caching. You can use this to prevent caching of your admin panel.
To enable private cache for sessions with cookies, you can write the config like this:
<IfModule LiteSpeed>
# for those not met above condition, enable private cache.
RewriteCond %{REQUEST_METHOD} ^HEAD|GET$
# excluding certain URLs
RewriteCond %{REQUEST_URI} !/(private)/$
## select which pages to serve from private cache
RewriteCond %{HTTP_COOKIE} !my-cookie=yes
# private cache for however long set in cache policy for php pages only
RewriteRule (.*\.php)?$ - [E=Cache-Control:max-age=120]
RewriteRule (.*\.php)?$ - [E=Cache-Control:private]
</IfModule>
This will enable private cache for users who have a cookie named my-cookie stored on their computer, such as logged-in users or commenters.
You can also use other rewrite conditions and flags to fine-tune your caching rules, such as checking for query strings, headers, etc. You can find more information about rewrite rules on the OpenLiteSpeed Knowledgebase.
3. Test LSCache
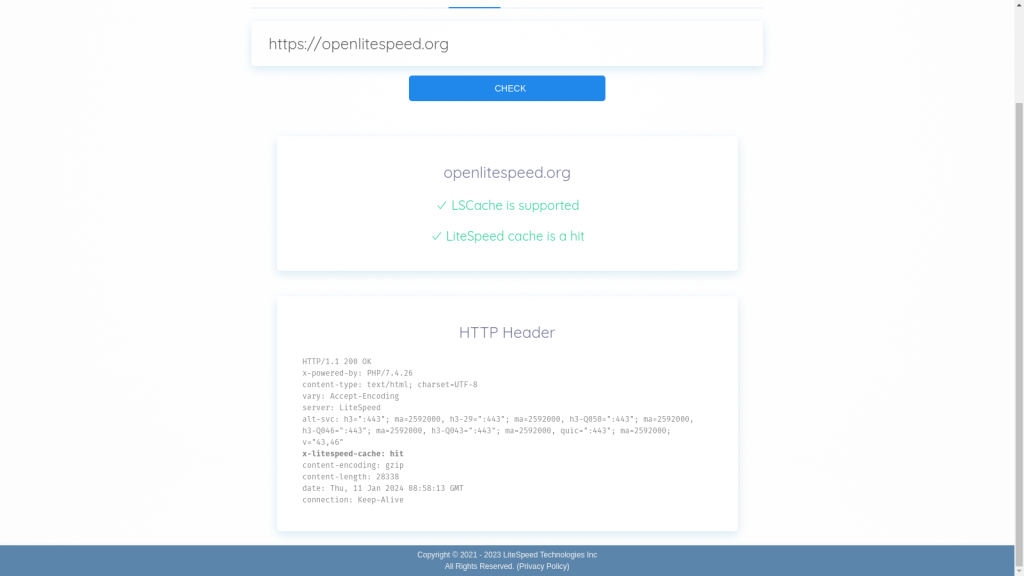
The final step is to test if LSCache is working properly on your web application. You can do this by using online tools such as LSCache Check or browser developer tools to check the response headers of your web pages.
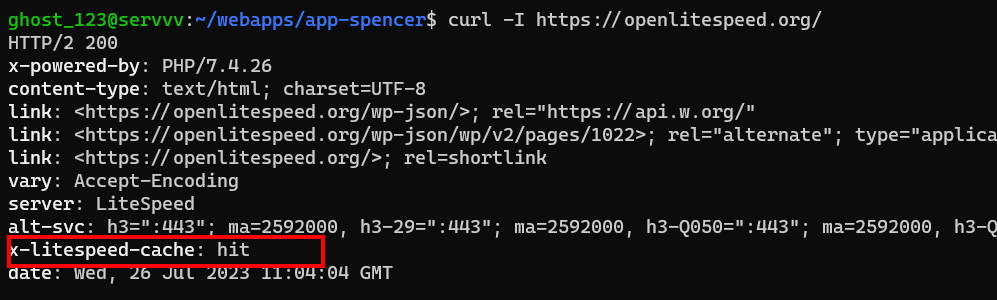
You can also use the following curl command to check the headers of a page.
curl -I https://example.com/
Executing the above command should give an output similar to the following screenshot:
This means that OpenLiteSpeed has served a cached page from LSCache and has added a x-litespeed-cache header with a value of ‘hit’.
Conclusion
In this article, we have covered how to customize the LS Cache settings for each virtual host on OpenLiteSpeed, and how to use directives or rewrite rules in the .htaccess file of your virtual host. You can find more information about OpenLiteSPeed cache configuration on the official site.
We hope this article was helpful and informative. If you have any questions or feedback, please feel free to leave a comment below.
If you are looking for an easy and convenient way to manage your server, you may want to check out RunCloud. RunCloud is a cloud-based server management platform that allows you to deploy, configure, and monitor your web applications on any cloud provider.With RunCloud, you can easily install and update OpenLiteSpeed, LS Cache, and other web server components with just a few clicks. You can also enjoy features such as SSL certificates, backups, firewall, cron jobs, and more. Start using RunCloud today!
According to StatCounter, Google dominates the search engine market with an overwhelming 93.37% share, leaving its closest competitor, Bing, with just 2.81%. This market dominance highlights the critical importance for developers to optimize their sites for Google’s ranking algorithms.
To rank websites Google employs a variety of methods, including the most recent and crucial method – Core Web Vitals, which began rolling out in June 2021.
It is therefore vital for any website developer to understand how these web vitals are measured, and what they can do to optimize their site to boost both their performance, and their position in the SERPs. In this article, we will identify exactly what Google’s Web Vitals are, how they impact your site, and how you can improve your site’s score.
Let’s get started!
Table of Contents
Understanding Google’s Core Web Vitals
Google’s Core Web Vitals consists of a set of specific website performance metrics that are used to determine the overall user experience of a website.
It is a combination of three main parameters that measure specific aspects of page speed and responsiveness. These metrics include:
Visual load, measured by largest contentful paint (LCP)
Visual stability of web pages, measured by Cumulative Layout Shift (CLS)
Interactivity, which is measured by First Input Delay (FID)
The Core Web Vitals are part of Google’s Page Experience Ranking Signals, which also include factors such as mobile friendliness, browsing safety, HTTPS, and Intrusive Interstitials (or popups).
A study from Google found that when a site meets the optimal thresholds for the three Core Web Vitals metrics, users were 24% less likely to abandon page loads. On top of that, they found a 22% decrease in news site abandonments and 24% fewer abandonments of shopping sites.
The Two Types Of Data Used For Core Web Vitals
Before we get into the optimization of sites, it is necessary to understand the kinds of data processed for measuring Core Web Vitals metrics. The two main types of data are:
Field Data
Field Data is generated from the Chrome User Experience Report (CrUX) and includes real user metrics. Google collects information from Chrome users who have opted to share information, such as browsing history, and uses the data to compute the three Core Web Vitals metrics. The aim is to understand how real-world Chrome users experience the web.
You can see a summarized view of your site’s Core Web Vitals under the Google Search Console, and your page-level metrics in PageSpeed Insights under the Field Data category. However, you should note that this data is based on a rolling 28-day average, which means that any change in your site won’t be reflected in your Field Data report for around 28 days. This is where Lab Test Data comes to the rescue.
Lab Test Data
Lab Test Data is generated by tools that are designed to run tests consistently under the same conditions. Because of factors such as internet speed and geographical location this data does not reflect real-world data. You can view your site’s Lab data with the Lighthouse Chrome extension.
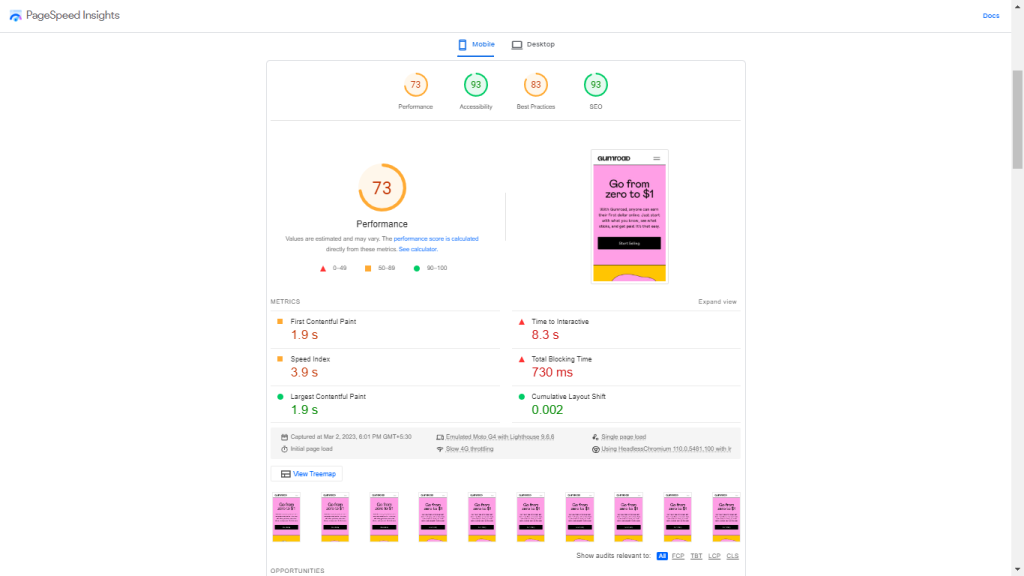
The metrics are assessed at the 75th percentile of users. For example, if we look at the Page Speed Insights for the Gumroad site we will see that all Core Web Vitals metrics have greater than 75% results, so the site passes the Core Web Vitals assessment. If one or more metrics have less than 75% positive loads, it does not pass the Core Web Vitals assessment.
Another thing to note is that metrics are measured by device type, meaning that mobile Core Web Vitals will be assessed separately from desktop ones.
Before analyzing and optimizing the Core Web Vitals, it’s essential to assess the other basics of Google’s page experience signals, such as mobile friendliness and the use of HTTPS. We must remember that the Core Web Vitals are just a part of Google’s page experience signals.
You need to take care of basic optimizations for page speed, such as having good hosting, compressing your images, caching your content, and setting up a Content Delivery Network (CDN). All of these things will inevitably contribute to improving your site’s Core Web Vitals.
Core Web Vitals Metrics
Largest Contentful Paint (LCP)
Largest Contentful Paint tells us about the visual loading performance of a website. It measures the time it takes for the web page’s main content to load. LCP is simply the single largest visible element loaded in the viewport, which is the area of a web page visible to a user. You should aim to minimize this metric as much as possible – the recommended target is to have your LCP under 2.5 seconds.
Cumulative Layout Shift (CLS)
Cumulative Layout Shift measures the visual stability of a web page. CLS looks at how much visible elements have shifted in the viewport as remaining elements are loaded, and measures the distance the affected elements were shifted. In some web pages pop-up ads and videos appear out of nowhere and shift the content, which is annoying and results in a bad user experience.
Previously, CLS was recorded continually to measure stability even after the page had loaded. But recently Google has revised the way CLS is measured; it is now calculated in terms of 5-second sessions. The metric that is reported is the 5-second timeframe in which the most shifting occurred. The recommended threshold by Google is to have a score of less than 0.1.
First Input Delay (FID)
First Input Delay measures interactivity. The purpose of this metric is to gain an understanding of a user’s first impression of a site’s interactivity and responsiveness. It measures the time from when a user first interacts with a page to the time when the browser is able to respond to that interaction.
Different types of interaction will include clicking a link or a button, inputting text into a blank Field, selecting a drop-down menu, etc. The recommended speed for First Input Delay is anything under 100 milliseconds.
Measuring Your Website’s Core Web Vitals
A variety of browser extensions, tests, and reports are avaiLable that will help you analyze your site’s Core Web Vitals. Here are some of the most important ones.
Core Web Vitals Assessment in Google’s PageSpeed Insights
PageSpeed Insights is a tool developed by Google that reports on the user experience of a page on both mobile and desktop devices, and provides suggestions on how that page may be improved. It has two sections:
Core Web Vitals assessment lets you discover what your real-world users are experiencing
PageSpeed Insights score helps you diagnose performance issues with the help of Lab data
This Core Web Vitals assessment is part of the Field Data report. The Diagnostics section in PageSpeed Insights also provides useful information about elements that affect each of the three Core Web Vitals metrics.
PageSpeed Insights uses Lab data in addition to real user metrics to calculate the overall optimization score, and also provides suggestions for improvements.
You should note that in some cases PageSpeed Insights doesn’t provide a Field summary. This usually happens for small websites because the Chrome User Experience Report cannot collect enough Field data. Fortunately there are other sources that will provide you with Field data.
Core Web Vitals Report In Google’s Search Console
Google’s Search Console Tools is a web service by Google that allows users to measure a site’s traffic and performance, fix common issues, and make the page perform better in Google search results.
Google Search Console has two Core Web Vitals reports, tailored for both mobile and desktop versions. Each of these reports provides you with the Field data for a group of URLs, and offers insight into their performance. These reports are beneficial for finding common issues and similar errors across a group of URLs. This ensures you get information about the entire site – instead of just information on one page at a time.
For example, if you have many product pages where the largest element is an image or a banner, the Largest Contentful Paint (LCP) metric will be similar for all of them. In such a case, Google Search Console finds LCP issues across all of these identical product pages.
In the console you can alert Google after resolving any Core Web Vitals problem by clicking on Validate Fix.
Using the Core Web Vitals Chrome Extension
Chrome’s Core Web Vitals extension offers a quick way to check your Core Web Vitals. This extension automatically gives you a brief audit of Largest Contentful Paint, Cumulative Layout Shift, and First Input Delay. It can audit the website’s performance for other users compared with its performance on your own device.
Using Chrome User Experience Report For Extracting Field Data
Gaining access to the Chrome User Experience Report (CrUX) requires more time and effort than simply running your site through PageSpeed Insights or Google Search Console. However, going through this report also provides more ways to organize and visualize your site’s Field data.
There are two main ways to directly access the CrUX dataset:
BigQuery: This method requires a Google Cloud project and SQL expertise
The Chrome UX Report API: This method requires some developer experience with both JavaScript and JSON
If you can afford the time and possess the technical expertise, it is worth experimenting with both methods above.
Optimizing Your Site For Core Web Vitals
After measuring your site’s Core Web Vitals, the next step is to optimize it for them. You need to keep in mind that every website is built differently, and we can’t possibly fix every potential problem. Below we’ll discuss several tried and tested techniques for improving web performance.
It is important to keep in mind that your site’s performance can also be affected by factors that aren’t discussed here. You always need to examine your specific problems before implementing any optimizations.
Analyzing and Optimizing Largest Contentful Paint (LCP)
As discussed above, Largest Contentful Paint (LCP) measures the time it takes for the largest element in the viewport to load. Anything below 2.5s is considered to be a good LCP score. If the largest viewport element loads faster than that for 75% of all recorded page loads, the web page passes the LCP assessment.
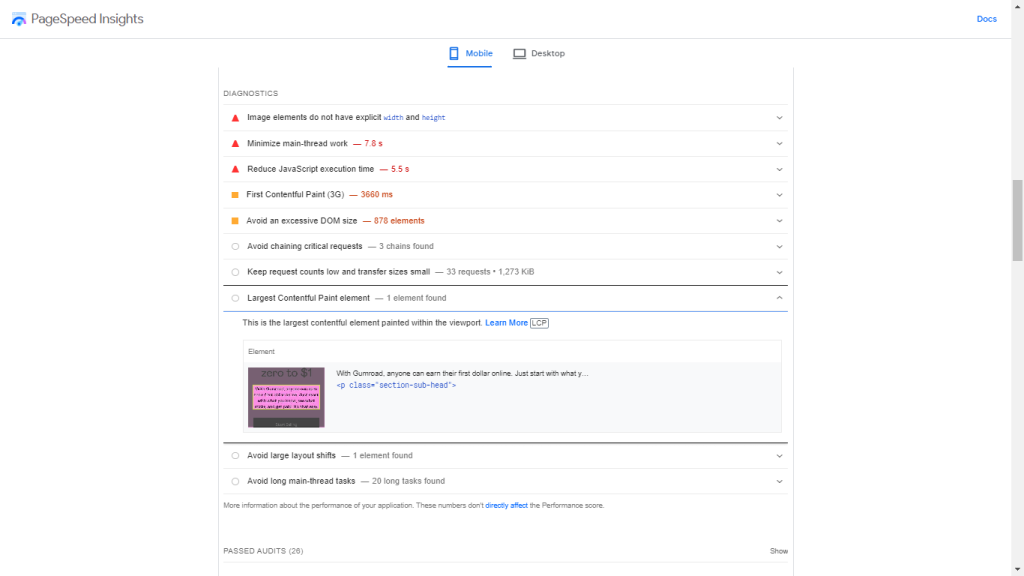
A quick and easy way to check which element triggers the LCP metric is to run the page through PageSpeed Insights. In the dashboard, scroll down to the Diagnostics section and click on the Largest Contentful Paint element.
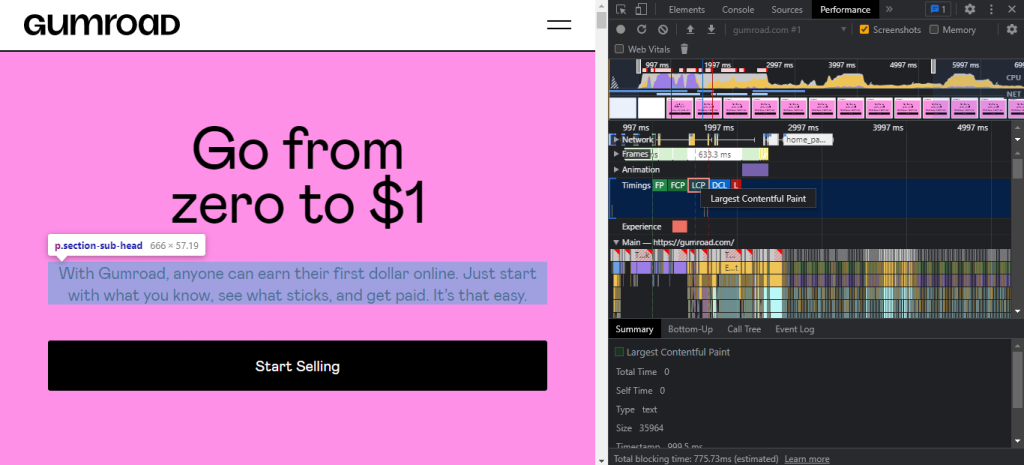
The same can be done with Chrome’s DevTools. For this, open the page you want to inspect in Chrome, right-click and select Inspect, then go to Performance. Now, click on the Reload button, and wait for the browser to examine the page.
You’ll be able to locate a small LCP icon in the Timings section. When you hover your cursor over it, the largest element of the page will be highlighted with a blue shade.
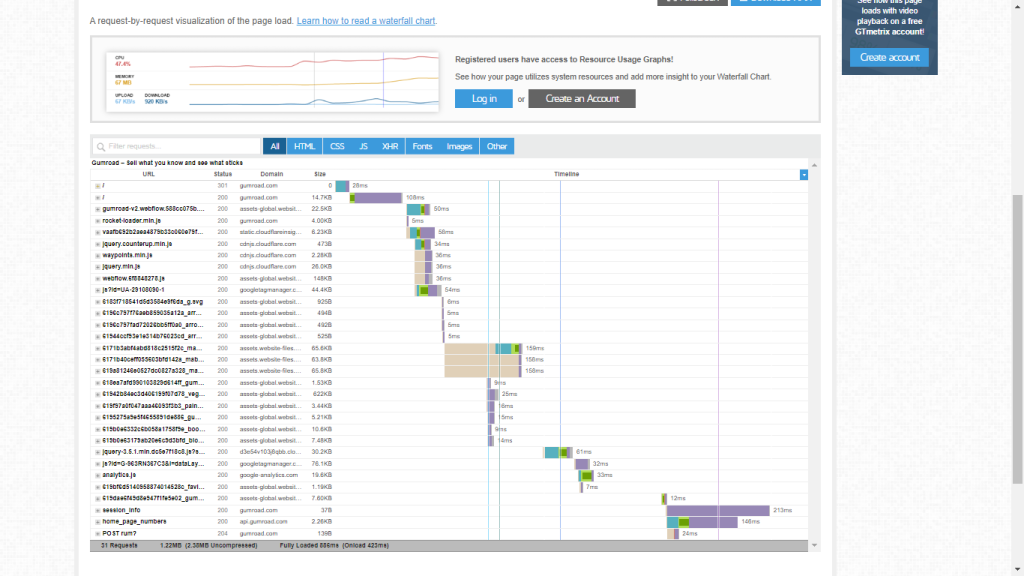
For additional insight you can use a waterfall chart to see how many resources were loaded before the LCP. Here’s how the waterfall chart looks for our example website, Gumroad, created using GTmetrix:
Tips To Improve LCP Time
Here are a few measures you can take to improve your LCP load time:
Optimize your images: Inefficiently formatted and very large images are often the biggest reason for slow websites. For faster loading, images must be properly converted to the right format, compressed, and resized. Lossless compression maintains roughly the same image quality while reducing the size of the image file.
Preload hero images: Hero images are usually the most prominent above-the-fold elements, so loading them quicker is crucial for a fast and responsive user experience. This tells the browser to prioritize the specific hero images when rendering the web page.
Preloading significantly improves LCP, especially on pages where hero images are loaded with JavaScript and the background-image property in CSS. Browsers usually discover these images later, so using link rel=preload helps improve both actual and perceived performance.
Find a better hosting plan: Using a cheap, shared hosting plan will always lead to slow execution times because of the slow host server. Upgrade your hosting plan to have a fast server response time, and both stabilize and speed up your site.
If you are looking for a new hosting solution, consider using RunCloud for managing your servers.
Implement Critical CSS:Critical CSS is a technique that extracts the viewport content in order to render content to the user as quickly as possible. Critical CSS finds the CSS necessary to load above-the-fold content and inline it in the <head> tag. Doing so improves both actual and perceived performance.
Use a Content Delivery Network (CDN): Using a CDN splits the load by hosting assets on servers that are geographically closer to the users, thus greatly improving a site’s performance.
Analyzing And Optimizing Cumulative Layout Shift (CLS)
We already know that Cumulative Layout Shift measures the effect of unexpected layout alterations in a web page that occurs when content moves around the page without user input. A visually stable page maintains a CLS score of 0.1, and if that’s true for the 75th percentile of recorded page loads, the web page passes the CLS assessment.
Google computes the CLS score by measuring how much of the viewport the layout shift affected, and how far the elements moved from their original position during the shift. The final CLS score is calculated as the total of all individual unexpected layout shift scores.
Chrome’s DevTools can help detect unexpected layout shifts. You need to right-click on the page you want to analyze and select Inspect. Navigate to More Tools and click on Rendering. At the bottom of the Inspect console you’ll see a Layout Shift Regions option with a checkbox on the left. Click on the checkbox to ensure it’s selected.
Now every time the layout of the page shifts, the shifted area will be highlighted in blue.
This CLS generator tool is also great for discovering layout shifts. it computes your overall CLS score and shows shifting areas.
Fixing Common CLS Issues
Here are a few tips for improving your layout shifts.
Add width and height attributes to images and videos: Adding attributes of height and width in the HTML markup enables the browser to allocate the correct amount of space for each element in advance. This renders a blank element in place of the image, and replaces the element with the actual image when it is loaded. This drastically reduces layout shift issues.
Optimize Font Delivery: Unoptimized web font delivery can cause huge layout shifts. Using font-display: optional in combination with link rel: “preload” for the site’s most prominent fonts is typically considered the best practice. The optional value avoids causing a re-layout when the web font is ready, and this ensures a layout shift does not happen.
Don’t insert ads and pop-ups on top of other content: Adding intrusive ads and pop-ups are the most common ways to ruin your CLS score. Many elements can cause this issue, including ads, promotional banners, search bars, etc. If you must place such elements on your page, implement them in a way such that it does not negatively impact the user experience.
Reserve space for iFrames, ads, and dynamic content: These elements can cause significant layout shifts if they don’t have reserved space, just like images and videos. You need to use containers with proper dimensions and use the overflow: hidden property to make sure larger content doesn’t overflow its container.
Make interactions faster: Make sure user interactions are completely executed within 500 milliseconds of the input trigger. Lightening up page loads by using OS fonts, compressing and preloading visual content, and using proper containers all prove to be helpful in making interactions faster.
Analyzing and Optimizing First Input Delay (FID)
We have already discussed that First Input Delay measures the time it takes for the browser to begin processing the first user interaction on a web page. However, scrolls and zooms don’t affect FID; this metric only keeps track of distinct actions such as clicks or taps. A low FID is crucial because first impressions leave a mark on the users, and most users instantly leave and, in most cases, never return if a website irritates them on their first visit.
A web page’s FID should be less than 100 milliseconds for 75% of all recorded page loads for it to pass the FID test.
The main culprit of FID issues is usually JavaScript. Excessive usage of JavaScript leads to Long Tasks. These are periods of time when the UI is unresponsive to user interaction. If the main thread is blocked for more than 50 milliseconds it is considered a Long Task.
To find Long Tasks on your web page, open the page, right-click, and select Inspect. From the Inspect console, open the Performance panel and reload the web page. Now, you must click Main and select the Bottom-up analysis button.
You will find the Long Tasks in the Main section. These tasks are usually painted in gray with a red overlay. The Bottom-Up analysis also lets you group files by URL, and helps you pinpoint what causes delays. In the above example, the first script alone takes more than 400 milliseconds, which is far too long.
As you dive deeper into the Bottom-Up analysis, you’ll find that a few longer functions contribute to most of the delay. In some other cases, functions might be running quickly – but adding too many of them together in a single task converts into a Long Task.
WebPageTest is another useful tool that provides an in-depth processing breakdown, helping you to find problem areas. It provides a detailed page summary which provides insight into the site’s performance, and helps you by providing information that allows you to tweak your site for a better Core Web VItals ranking.
Fixing Common FID Issues
There are multiple ways to minimize your First Input Delay. Some of the most popular ones include:
Compress or minify code files: Removing unnecessary parts from the code such as whitespaces and line breaks (minification), and modifying and compressing code files to make them smaller helps significantly reduce FID.
Minimizing third-party JavaScript requests for analytics, social media widgets, discussion forums, etc., that quickly mount up to several megabytes of JavaScript also helps with FID issues. There are some hosting services and CDN providers that implement these features by default, making the process easier for users.
Break up Long Tasks: This is arguably the most effective way to reduce FID, as Long Tasks block the main thread from responding to user interactions quickly. By dividing them into smaller parts you can significantly improve the performance of your website. You can take advantage of JavaScript features such as requestCallback, setTimeout, and requestAnimationFrame to break long-running JavaScript tasks into a series of smaller tasks.
Use web workers:Web workers enable web content to run scripts in background threads without affecting the main thread. It is generally considered a good practice to move non-UI operations to a background thread. Additionally, you can use asynchronous, deferred, or ESS module JavaScript to run some scripts later.
Remove or delay non-critical third-party scripts: Sometimes third-party scripts can prevent your own scripts from executing on time. You need to prioritize the scripts according to their importance and rearrange their execution pattern. For example, if you are showing ads on your website, or if you are tracking user interactions, you should defer executing those scripts until the website is loaded.
Optimize CSS: While JavaScript is the root cause of most FID issues, CSS is also render-blocking by default. Excessive CSS hurts the user experience, and you need to make sure you avoid expensive CSS properties such as box-shadow and filter. Besides implementing Critical CSS and minifying and compressing CSS files, it is also important to get rid of all unnecessary CSS on your site.
After Action Report
Google’s introduction of the Core Web Vitals was a major step in the right direction toward making the web better for everyone. The Core Web Vitals are important for all websites as part of Google’s page ranking algorithm.
That is why it has become necessary to continuously monitor these metrics, even if you don’t notice any major issues right now.
Going forward, here is a quick checklist of things that you need to remember:
You should run a test at least once a month.
Prioritize Field data over Lab test data, as the former accurately represents how actual users experience your site.
Make use of Google’s Search Console to find issues across a set of web pages.
Use PageSpeed Insights to understand and monitor how your site performs.
For a deeper understanding of your site’s performance and for further customization, extract data from the CrUX and gain additional control over your Field data.
If you are looking for an easy and painless way to manage your web servers then you should start using RunCloud. RunCloud makes it easy to deploy new servers, update DNS records, deploy new WordPress sites, manage database users, monitor NGINX logs, and more. Start using RunCloud today!
There is one simple solution to drastically improve the performance of your website…
…caching!
In this article, we will discuss what is caching, and compare two powerful caching solutions – Redis Full-Page Cache and NGINX FastCGI Caching.
Let’s get started!
A Primer on WordPress Caching
Before we dive deep into the comparison, let’s quickly recap what caching is and how it works.
In layman’s terms, caching is the process of storing frequently accessed information in a quickly accessible location, such as RAM or a disk.
Storing this information allows the server to retrieve the data faster when someone requests it. This greatly reduces the page load times as the server needs to do fewer computations to generate all of the content from scratch.
Redis is an open-source database that can store key-value pairs in memory – this design makes Redis a great choice for caching data.
Redis Full-Page Caching is a technique for caching WordPress data in such a way that it stores the entire HTML output of a web page in Redis cache memory. This means that when a user requests the web page, the cached HTML is retrieved from Redis memory instead of generating it from scratch, resulting in a faster response time.
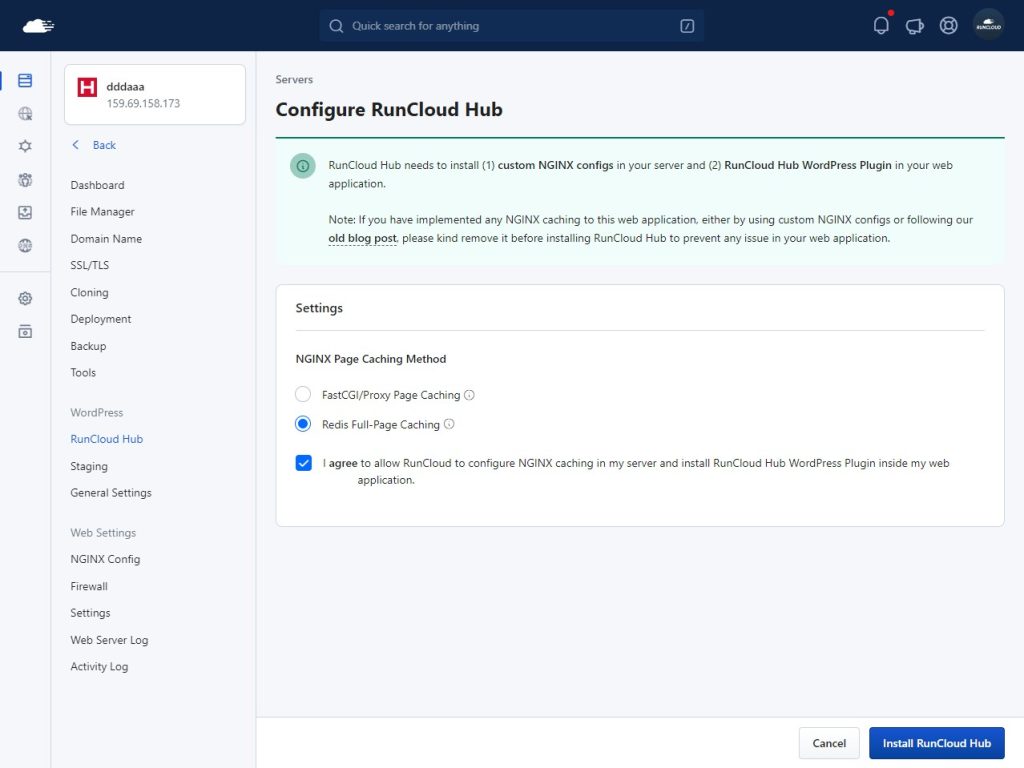
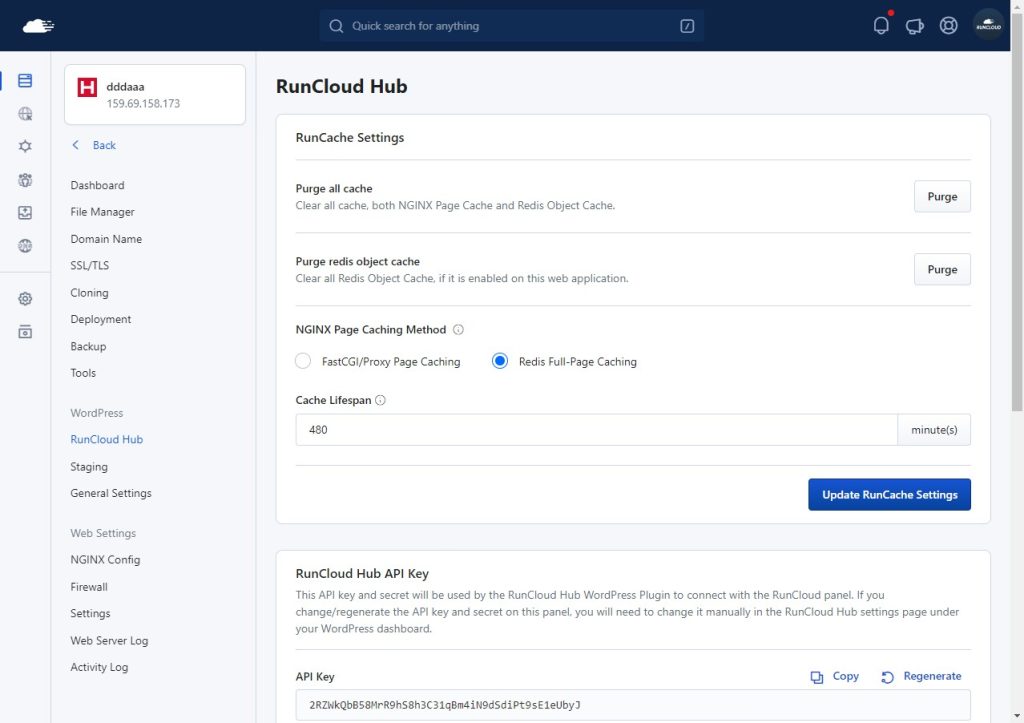
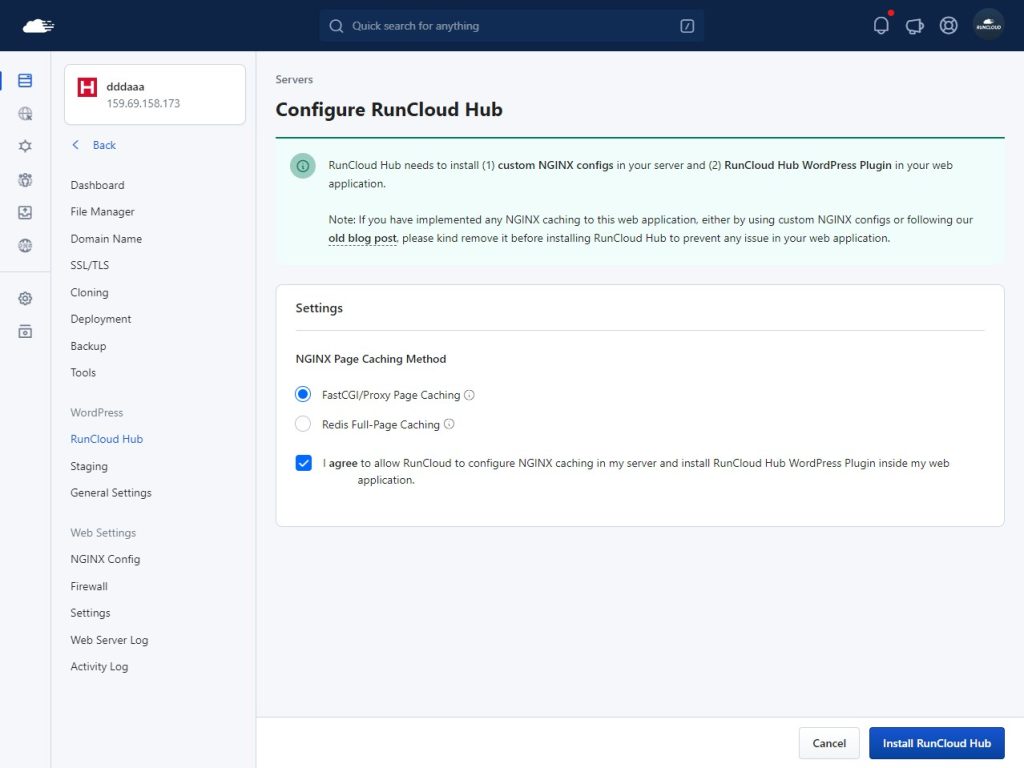
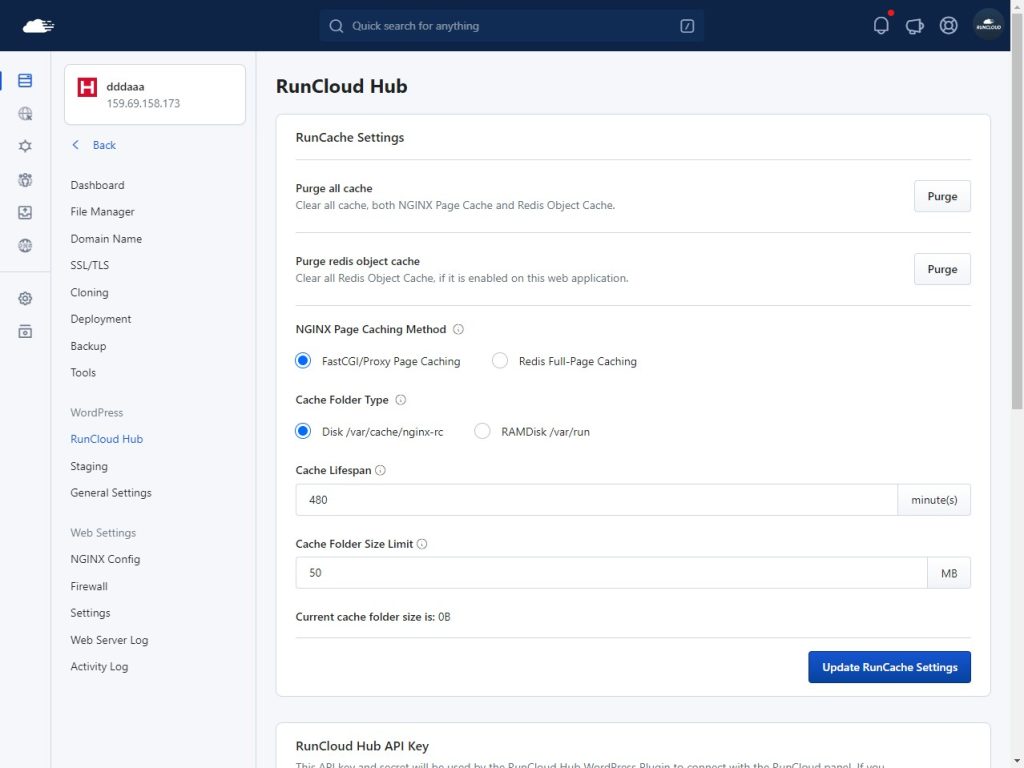
Redis full page caching can be enabled easily in the RunCloud dashboard. Just go to your web application dashboard and look for the RunCloud Hub setting. Install the RunCloud Hub plugin to automatically configure the settings.
NGINX is a popular web server that is known for its high-performance and stability. NGINX FastCGI caching is a way to store the entire HTML documents to disk for easier access. When a user requests the web page, the cached HTML is retrieved from disk storage, resulting in a faster response time.
NGINX FastCGI caching works by proxying requests from clients to an application server that uses a FastCGI protocol, such as PHP-FPM. It then serves all subsequent requests directly, without contacting the backend again for a specified amount of time.
You can quickly start using this caching method – just go to your RunCloud dashboard and open the web application that you want to optimize. In the dashboard, look for the RunCloud Hub plugin and enable it.
Once you have enabled caching, you can configure additional settings such as the lifespan of cached content, or see how much content has been cached already.To get a deeper understanding of the topic, we recommend you to read our tutorial on NGINX caching and How To Use NGINX FastCGI Cache.
The Benchmarks – What The Data Shows
Having a consistent test environment was our utmost priority to ensure we generated reproducible results.
We deployed three identical WordPress websites running on PHP 8.2 on Ubuntu 22 LTS server to compare the performance differences between Redis Full-Page caching and NGINX FastCGI caching.
On each website, we created a new webpage with 20 paragraphs of text and 2 images. All of the websites had SSL enabled and used identical themes without any additional plugins.
Finally, all of the websites were tested with a sustained load, one at a time, under identical network conditions using Grafana k6.
During testing, we paid close attention to the number of iterations, which told us how many web requests were completed successfully. We also checked 95 percentile scores of the iteration_duration metric – which told us how long it generally took to open the webpage. For instance, if the p95 score was 1.2 seconds, then it meant that 95% of all requests were completed in under 1.2 seconds.
Let’s see the results!
Unoptimized WordPress
In our tests, we found out that our native WordPress instance could serve approximately 4.77K web requests, with an average request taking nearly 2.15 seconds. Upon closer inspection, we found that some requests were completed fairly quickly (1.1 seconds) while others took much longer (3.41 seconds).
That’s not good. Let’s see if using a caching service helps.
Using Redis Full-Page Caching
Using Redis greatly increases the number of web requests served. In addition to a 2x increase in the number of requests, we also see an improvement in 95 percentile scores. The difference between minimum and maximum time taken to complete the web requests was almost 0. This would provide a much more consistent user experience while browsing.
Using NGINX FastCGI Caching
While using NGINX’s FastCGI caching, we saw a similar improvement in the number of requests, and 95 percentile scores. Once again, the response times are lower and much closer to each other.
Final Results – Which One To Use
There is no clear winner. Our benchmark results showed that Redis Full-Page Caching outperformed NGINX FastCGI caching in terms of response time and the number of requests served per second – but only by the width of a hair. Both of these options are a significant improvement over native WordPress – our advice is that you can use either of them.
It’s a no-brainer that using any type of caching is better than not using anything. Not only will it improve the performance of your website, but it will also reduce the load on your web server, allowing you to serve more customers without any additional increase in hosting costs.
Both Redis Full-Page Caching and NGINX FastCGI caching are excellent caching solutions that can significantly improve website speed and performance. However, if you’re using OpenLiteSpeed server, you should also check out our article on LiteSpeed Cache WordPress Plugin.
Transform your server management experience with RunCloud – the ultimate platform for simplifying website maintenance. RunCloud provides out of the box solutions for implementing caching, issuing SSL certificates, and streamlining your workflow. Sign up to RunCloud today to enjoy more control over your servers, automated backups, and robust security features.
Website monitoring is the process of checking the availability, performance, and functionality of a website.
It’s an essential, and on-going task for web developers and owners to ensure that their websites are always online, fast, and user-friendly.
Effective website monitoring can help detect and resolve issues, prevent downtime, improve user experience, and optimize website performance.
UptimeRobot is a service that monitors your website’s uptime and alerts you when it goes down. By integrating UptimeRobot with RunCloud, you can monitor all of your websites hosted on RunCloud servers, and access a number of features and benefits from both.
In this article, we will show you how to use UptimeRobot and RunCloud together for website monitoring. We’ll cover the following topics:
UptimeRobot is a service that monitors your website’s uptime and alerts you when it goes down.
It achieves this by sending requests to your website at regular intervals and checking the response status code, response time, and keyword presence. If the response is not satisfactory, UptimeRobot will notify you via email, SMS, webhook, or other method of your choice.
UptimeRobot has several features and benefits that make it a popular choice for website monitoring. Some of them are:
Free and paid plans: UptimeRobot offers a free plan that allows you to monitor up to 50 websites with 5-minute intervals, and 2 alert contacts. You can also upgrade to a paid plan that gives you more websites, shorter intervals, more alert contacts, advanced settings, and premium support.
Multiple types of checks: UptimeRobot supports different types of checks for your websites, such as HTTP(S), ping, port, keyword, and heartbeat. You can choose the type of check that suits your website’s needs – and customize the settings accordingly.
Various notification methods: UptimeRobot can alert you via various methods should your website go down or come back up. You can choose from email, SMS, voice call, webhook, Telegram, Slack, Discord, Pushbullet, Pushover, and more. You can also set different alert contacts for different websites and scenarios.
Status pages: UptimeRobot allows you to create public or private status pages for your websites. You can display the uptime and performance data of your websites on these pages, and share them with your visitors or clients if you wish. You can also customize the look and feel of your status pages with your own logo, domain name, colors, etc.
Different Monitor Types
UptimeRobot supports different types of monitors to check the availability, performance, and functionality of websites or web services. Here is a brief explanation of each type of monitor:
HTTP: This type of monitor sends an HTTP or HTTPS request to a website, and checks the response status code and response time. If the status code is not 2xx (success) or 3xx (redirection), or if the response time exceeds a certain threshold, the monitor will alert you that the website is either down, or slow.
Keyword: This monitor also sends an HTTP or HTTPS request to a website, but it checks the presence or absence of a specific word or phrase in the response body (typically HTML or JSON). You can choose to be alerted if the keyword is either found or not found on the website. This can help you verify the content or functionality of your website.
Ping: This type of monitor sends an ICMP ping packet to an IP address or a domain name, and checks both the response time and packet loss. If the response time is too high, or if there is no response at all, the monitor will alert you that the device is unreachable or slow. This can help you check the network connectivity and availability of your servers or devices.
Port: This type of monitor sends a TCP or UDP packet to a specific port on an IP address or a domain name, and checks if the port is open and listening. If the port is closed or filtered, the monitor will alert you that the service is down or inaccessible. This can help you check the status and performance of various services running on your servers or devices, such as email, database, FTP, SSH, etc.
Heartbeat: This type of monitor requires you to send an HTTP request to a specific URL provided by UptimeRobot at regular intervals from your own server or device. If UptimeRobot does not receive a request within a certain time frame, the monitor will alert you that the server or device is down or malfunctioning. This can help you monitor recurring background jobs or intranet devices connected to the internet.
You can choose the type of monitor that suits your website’s needs, and customize the settings accordingly.
Setting-up UptimeRobot
To use UptimeRobot to monitor your websites, you’ll need to follow these steps:
Sign up for a free or paid account on UptimeRobot, and log in to your dashboard. On the top left corner, click on “Add New Monitor” to create your first monitor.
Provide a suitable name for your monitor, and enter the URL of your website that needs to be monitored. Here you can also specify the frequency of your tests and other basic configuration.
Next, configure the alert settings by selecting the notification methods and contacts for each monitor. If your website experience crashes, these notification channels will be used to notify the specified contact(s).
Optionally, you can create status pages for your monitors by choosing the template and options. Status pages are public pages that you can display to your customers or other stakeholders to track the health of your service.
After you have performed the above steps, you can enjoy peace of mind – UptimeRobot will now keep an eye on your websites, and notify you if anything goes wrong.
Understanding UptimeRobot Teams
Team member functionality on UptimeRobot is a feature that allows you to add your team members to your UptimeRobot account, and assign them different levels of access and notification.
You can use this feature to collaborate with your team members on website monitoring, and keep them informed of any issues or updates.
There are two types of team members that you can add on UptimeRobot:
Read or write access: These are team members who can log in to your UptimeRobot account with their own credentials and perform actions such as adding, editing, or deleting monitors, alert contacts, or status pages. You can choose to give them read-only or read-write access depending on their role and responsibility. You can also choose which monitors, alert contacts, or status pages they can access or manage.
Notify-only: These are team members who cannot log in to your UptimeRobot account but can receive notifications via email, SMS, or voice call when your monitors go down or come back up. You can add them as alert contacts and assign them to specific monitors. You can also customize the notification frequency and content for them.
Dos and Don’ts For Using UptimeRobot
Here are some tips and best practices for website monitoring with UptimeRobot and RunCloud:
Choose the right type of check and interval for your website
Depending on the nature and purpose of your website, you may want to use different types of checks and intervals to monitor its uptime and performance.
For example, if your website is a static HTML page, you may use a simple HTTP(S) check with a 5-minute interval. But if your website is a dynamic web application that relies on a database or an API, you may use a keyword or a heartbeat check with a 1-minute interval.
Use multiple alert contacts and methods for different scenarios
You may want to notify different people or teams when your website goes down or comes back online. For example, you may want to alert your web developer via email and SMS when your website goes down, but only alert your marketing manager via email when your website comes back up.
You can also use different notification methods for different urgency levels. For example, you may want to use a voice call for critical issues, but only use a webhook for minor issues.
Create status pages for your websites and share them with your clients
Status pages are a great way to communicate the uptime and performance of your websites to your visitors or clients. These pages can help you build trust and transparency with your audience, and reduce the number of support requests.
You can create public or private status pages for your websites using UptimeRobot, and customize them with your own logo, domain name, colors, etc.
Don’t rely on a single type of monitor, or a single alert method.
You may miss some issues or receive false positives if you only use one type of monitor or one alert method. You should use multiple types of monitors and alert methods to cover different scenarios, and ensure that you receive timely and accurate notifications.
Don’t set unrealistic expectations for your website uptime
You should understand that no website can achieve 100% uptime or perfect performance all the time. There are many factors that can affect your website’s availability and speed, such as network issues, server issues, code issues, traffic spikes, etc.
You should set realistic and reasonable goals for your website uptime and performance, and measure them against industry standards and best practices.
Final Thoughts
Website monitoring is a vital part of your web development and maintenance strategy. It can help you ensure that your websites are always online, fast, and user-friendly. By using website monitoring tools such as UptimeRobot, you can detect and resolve issues, prevent downtime, improve user experience, and optimize website performance.
But wait, there’s more! If you are looking for the best cloud hosting service provider for your websites, look no further than RunCloud.
RunCloud is a platform that allows you to easily manage your web servers and web applications on any cloud provider.
RunCloud lets you choose from a variety of cloud providers such as AWS, Google Cloud, DigitalOcean, Vultr, Linode, etc. and connect them to RunCloud with just a few clicks. You can then enjoy the benefits of RunCloud’s optimized web stack, backup, deployment, team collaboration, analytics, optimizer, and much more.
What are you waiting for? Join RunCloud today and take your website hosting to the next level!
Is your website suffering from frequent outages and unexpected downtime? If yes, then you should look into Synthetic monitoring.
Synthetic monitoring is a proactive way to monitor the performance and availability of your web applications and services by simulating user requests and actions from different locations. Synthetic monitoring helps you to:
Detect issues before they affect your real users
Ensure consistent user experience across devices and browsers
Measure service level agreements (SLAs) and objectives (SLOs)
Optimize your web performance and reliability.
RunCloud allows you to manage your cloud servers with ease, and you can also integrate RunCloud with Datadog to monitor your server metrics, logs, and events.
Datadog is a cloud-based platform that provides synthetic monitoring solutions for API, browser, and mobile tests. You can create and manage different types of synthetic tests with Datadog, such as API tests, multistep API tests, browser tests, or private locations.
In this post, you will learn how to use Datadog and RunCloud together to monitor your web applications and servers with synthetic monitoring. You will also see how to create and manage synthetic tests with Datadog, analyze and troubleshoot synthetic test results with Datadog, and set up alerts, dashboards, and reports for your synthetic tests with Datadog.
Let’s get started!
Setting up Datadog and RunCloud
Before you can use Datadog and RunCloud for synthetic monitoring, you’ll need to create an account on both platforms, and install the Datadog agent on your RunCloud server. Here are the steps to do that:
Creating an account on Datadog: Go to the Datadog website and click on the “Get Started” button.
Logging in to your server via SSH: You need to connect to your server with superuser privileges to install the monitoring agent. Read our guide on configuring SSH to learn more.
Install the Datadog agent on your RunCloud server: The Datadog agent is a tool that collects and sends metrics, logs, and events from your server to Datadog. To install the Datadog agent, follow these steps:
Go to the Datadog dashboard and click on the “Integrations” button.
Select “Datadog Agent” from the list and click on the “Ubuntu” tab to view the installation command.
Copy the Installation Script and paste it in your terminal. This will start the installation process – wait for the installation to complete.
You have successfully set up Datadog and RunCloud for synthetic monitoring. After installation, the agent will start sending data within a few minutes. Once you get the message “Your first Datadog Agent is reporting. Congrats!”, you can click on the “Finish →” button to complete the installation.
In the next section, you will learn how to create and manage synthetic tests with Datadog.
Creating and managing synthetic tests with Datadog
Synthetic tests are simulated user requests and actions that you can create and run with Datadog to monitor the performance and availability of your web applications and services. Datadog supports three types of synthetic tests: API tests, multistep API tests, and browser tests.
API tests: API tests are HTTP requests that you can send to your API endpoints and verify the response status code, body, headers, or latency. You can use API tests to check the functionality, performance, and reliability of your API endpoints. You can also chain multiple API tests together to create multi step API tests.
Multistep API tests: Multistep API tests are sequences of API tests that you can use to simulate complex user journeys or workflows involving multiple API calls. You can use multistep API tests to check the end-to-end functionality, performance, and reliability of your web applications and services. You can also extract variables from one API test and use them in another API test within the same multi step test.
Browser tests: Browser tests are user interactions that you can record and replay with a headless browser to monitor the performance and availability of your web pages. You can use browser tests to check the functionality, performance, and reliability of your web pages. You can also add assertions, variables, screenshots, or video recordings to your browser tests.
In addition to this, you can also run tests from private locations. Private locations are dedicated machines that you can use to run synthetic tests from your own network or infrastructure. You can use private locations to monitor internal or private web applications and services that are not accessible from the public internet.
To create tests with Datadog, follow these steps:
On your Datadog dashboard, click on “UX Monitoring” tab and go to the “Synthetics” page.
Click on the “New Test” button and choose the type of synthetic test you want to create: API test, multistep API test, or browser test.
Follow the instructions on the screen to configure your synthetic test settings, such as the test name, URL, frequency, locations, assertions, variables, screenshots, video recordings, etc.
Click on the “Save Test” button to save your synthetic test. After you have created a synthetic test with Datadog, it will be executed automatically according to the specified interval.
Analyzing and Troubleshooting Synthetic Monitoring Results
You can use synthetic test results to identify and resolve issues that affect your web performance and reliability. To access and interpret synthetic test results with Datadog, follow these steps:
Click on the synthetic test that you want to analyze. You will see the Test Details page, which shows the latest test result, and the historical test results for that synthetic test.
On the Test Details page, you can see various information about your synthetic test result, such as the test status, duration, response time, latency, errors, screenshots, video recordings, APM traces, etc. You can use this information to evaluate the performance and availability of your web applications and services. You can also compare different test results over time or across locations to identify trends or anomalies.
If your synthetic test result shows an error or a failure, you can use the Error Panel to see the details of the error or failure, such as the error message, stack trace, screenshot, video recording, APM trace, etc. You can use this information to troubleshoot and fix the issue that caused the error or failure. You can also click on the “Share” button to share the error details with your team or stakeholders via email or Slack.
Summary
Synthetic monitoring is a proactive way to monitor the performance and availability of your web applications and services by simulating user requests and actions from different locations. In this post, you have learned how to use Datadog and RunCloud for synthetic monitoring.
By using Datadog and RunCloud together, you can monitor your web applications and servers with synthetic monitoring in a simple and efficient way. You can also benefit from the features and capabilities of both platforms to improve your web performance and reliability.
If you want to start using RunCloud for your web hosting needs, you can sign up for a free trial. RunCloud makes server management easy by providing you with a user-friendly interface, a powerful script installer, a robust security system, and a flexible backup system.
In today’s digital landscape, the smooth operation of web applications is crucial to business success, and the performance and reliability of your server infrastructure cannot be overstated.
Server monitoring protects your applications against unexpected downtimes and performance bottlenecks, as well as valuable insights into the health, performance, and security of your infrastructure.
Dynatrace is a cutting-edge observability platform designed to provide real-time insights into the performance of your web applications and the underlying server infrastructure.
In this article, we’ll explore how to use Dynatrace to monitor your RunCloud servers, maximize uptime, and supercharge your web application’s performance.
Let’s get started!
Setting Up Dynatrace for RunCloud Servers
Prerequisites
Before you can start using Dynatrace to monitor your RunCloud servers, you’ll need to ensure you meet the following prerequisites:
SSH Access: Open your preferred SSH client or terminal. Use the SSH credentials associated with your RunCloud server to establish an SSH connection. Ensure that you have the required SSH access to execute commands on the server where you intend to install Dynatrace, and integrate it with your RunCloud-managed infrastructure. This access is essential for a successful Dynatrace installation and integration.
Once you have these prerequisites in place, you’re ready to move on to the installation process.
Dynatrace Installation
Access the Dynatrace Dashboard: Log in to your Dynatrace account and to view the Dynatrace dashboard. In the dashboard, look for the “Start collecting data” option. Click on it to begin the setup process.
Choose One Agent: On the next screen, you’ll have the option to choose the type of agent you want to install. Select “One Agent“. On the next screen, click “Set up“.
Generate PaaS Token: Since we’re working with a RunCloud server, choose the “Linux” option for the type of environment. After selecting the Linux option, you’ll be presented with instructions on how to generate a PaaS token. This token is essential for establishing the connection between Dynatrace and your RunCloud server. Click on the “Create Token” button to generate the PaaS token.
Execute Commands: Once you’ve generated the PaaS token, a set of commands will be provided. These commands need to be executed in your SSH terminal on your RunCloud server. These commands will install and configure the Dynatrace agent on your server.
Ensure that you follow each step carefully to complete the installation process successfully. Once the installation is complete, the Dynatrace agent will start collecting data from your server, and you will see your server in the Dynatrace dashboard.
Monitoring Real-time Server Health
After successfully installing the Dynatrace agent, you’ll need to wait for a few minutes to allow the data to populate in your Dynatrace dashboard. Once the data from your RunCloud server is connected and visible in Dynatrace, you can start taking advantage of the powerful features that Dynatrace offers.
Creating Custom Dashboards:
Custom dashboards in Dynatrace allow you to tailor the monitoring experience to your specific needs, helping you keep an eye on the most important metrics for your application. Follow these steps to create a custom dashboard:
Create a New Dashboard: In your Dynatrace account, navigate to the Dashboard section. Click on the “+ Dashboard” button on the top left corner. Give your dashboard a meaningful name that reflects its purpose.
Add Tiles: Within your dashboard, you can add tiles representing various metrics such as response times, error rates, CPU usage, memory utilization, and more. Click the “+” button on the top right part of the dashboard and select the metrics you want to monitor.
Configure Tiles: Customize each tile by selecting the specific metric, filtering options, and visualization preferences. You can resize, move, and arrange the tiles to create an intuitive layout.
Save Your Dashboard: Once you’re satisfied with your custom dashboard, save it. You can access this dashboard anytime to get a quick overview of the metrics that matter most to you.
Setting Up Service-Level Objectives (SLOs)
SLOs in Dynatrace help you define performance goals for your applications, and measure how well they meet those goals. To set up SLOs:
Navigate to SLO Management: In the Dynatrace menu, find the “SLO” section (sometimes under “Settings” or a similar category).
Create a New SLO: Click on “Create SLO” or a similar button to start creating a new Service-Level Objective.
Define the SLO: Name your SLO, specify the application or service it applies to, set the target performance threshold (e.g., response time under 500ms), and choose the evaluation window (e.g., last 7 days).
Save the SLO: Once you’ve configured your SLO, save it. Dynatrace will continuously monitor your application’s performance against the defined objectives.
Review and Optimize: Regularly review the SLO performance data. If an SLO is frequently breached, consider optimizing your application or infrastructure to meet the defined objectives.
Key Metrics to Monitor
CPU Utilization
Monitoring the CPU utilization of your servers is essential to understand their processing capacity and identify potential bottlenecks. This enables you to spot any spikes or consistently high usage that might indicate performance issues. By integrating Dynatrace with RunCloud, you can seamlessly access this critical metric, allowing you to make informed decisions about resource allocation – and ensure optimal server performance.
Memory Usage
Memory is a finite resource, and efficient management is crucial to maintain stable server operation. Having real-time insights into memory consumption trends allows you to identify potential memory leaks or unusually high usage patterns. This ensures that you can proactively address memory-related issues before they impact application stability.
Network Performance
Network connectivity is the lifeline of any web server. Monitoring network performance is vital to ensure smooth data transfer between servers and clients. Comprehensively tracking network performance metrics, such as latency, packet loss, and network throughput, allows you to detect network anomalies, troubleshoot connectivity issues, and optimize your application’s responsiveness to deliver a seamless user experience.
Final Thoughts
The old adage “prevention is better than cure” couldn’t be more applicable to server management. Dynatrace equips you with the ability to detect anomalies before they impact users, allowing you to resolve issues before they become critical.
The proactive monitoring approach ensures that you stay one step ahead, maintaining a smooth user experience and reducing downtime to an absolute minimum.
While Dynatrace supercharges your monitoring capabilities, RunCloud serves as an exceptional cloud management platform that simplifies server management, saving you time and effort. With RunCloud, you can effortlessly manage your servers, deploy applications, and enjoy a user-friendly interface that streamlines tasks. Start using RunCloud today!