Blog

  • The 7 Best Node.js Hosting Platforms for 2026 (Free + Paid)

    The 7 Best Node.js Hosting Platforms for 2026 (Free + Paid)

    Choosing where to host your Node.js application can be tough. Should you use a free platform for quick tests, or invest in a scalable setup that supports complex APIs and MySQL databases? This guide breaks down the best options in 2026 – so you can find the right balance of cost, control, and performance.

    In this comprehensive guide, we’ll cover the best Node.js cloud hosting options available in 2026. We’ll explore everything from free Node.js hosting platforms perfect for testing and development to enterprise-grade solutions for scaling production applications.

    Whether you’re looking to host a simple Node.js website, deploy a complex API, or set up a full-stack application with MySQL integration, we’ll help you understand the trade-offs between managed platforms such as Heroku, Railway, and Vercel versus the flexibility of running your own VPS.

    A Quick Comparison of the Best Node.js Hosting Platforms

    To simplify your decision, we’ve created a comparison table that breaks down the key features of our top picks. Use this as a starting point to identify which platforms best align with your project’s needs. Then, jump to the section below to read a detailed analysis.

    PlatformPricing ModelFree Tier DetailsBest ForKey Features
    RunCloudSubscription5-day free trialDevelopers want full server control with a simple management panel.Atomic Git Deployments, Server Health Monitoring, Multi-server support, Backup/Restore.
    RenderPay-as-you-goYes (for services with usage limits)Startups and developers looking for a modern, autoscaling Heroku alternative.Zero-downtime deploys, Managed PostgreSQL, Private Networking, Docker support.
    Fly.ioPay-as-you-goYes (Generous “free allowance” on resources)Globally distributed applications that need low-latency performance.Global Edge Deployment, Docker-based, Built-in Postgres, Custom Domains w/ SSL.
    VercelPer-user SubscriptionYes (For hobby/personal projects)Front-end developers using frameworks like Next.js and Jamstack sites.Git integration, Serverless Functions, Global CDN, Analytics.
    NetlifyPer-user SubscriptionYes (Generous tier for personal projects)Jamstack and static-first websites that use serverless functions for backend tasks.Git-based workflow, Serverless Functions, Form & Identity Management.
    HerokuUsage-based (“Dynos”)No longer offers a viable free tier for apps.Beginners and teams who need a simple PaaS with a massive add-on ecosystem.Simple git push deploys, Extensive Add-on Marketplace, Managed Databases.
    DigitalOcean App PlatformTiered / Pay-as-you-goYes (For static sites)Developers who have already invested in the DigitalOcean ecosystem.Fully managed platform, Scales from source code, Integrates with other DO products.

    Top Node.js Hosting Platforms

    Here are some of the best cloud hosting platforms where you can host your Node.js application with minimal effort.

    RunCloud

    RunCloud turns your VPS into a powerful, easy-to-manage hosting platform for Node.js applications. It removes the hassle of manual server setup while adding enterprise-grade features.

    Most platforms on this list lock you into their ecosystem. RunCloud doesn’t.

    It gives you full control over your servers – on any cloud provider – while still offering the same modern deployment tools and monitoring features developers expect. RunCloud works seamlessly with every major cloud provider:

    • Deploy on DigitalOcean’s affordable droplets
    • Leverage AWS’s global infrastructure
    • Use Google Cloud’s cutting-edge network
    • Host on Vultr’s high-performance instances
    • Run on Linode’s developer-friendly platform
    • Or even manage your self-hosted servers

    Benefits of Using RunCloud

    • Git Integration: Supports direct deployment from Git repositories 
    • SSL Management: Free SSL certificates and automatic renewal
    • Security Features:
      • Web Application Firewall (WAF)
      • Automated security patches
      • IP blocking
      • SSH hardening
    • Performance Optimization:
      • Built-in Redis caching
      • Server optimization
      • Resource monitoring
    • Team Collaboration: Multi-user access with role-based permissions

    Pricing

    • Essentials: For $9/month, the Essentials plan provides all the fundamental tools to manage a single server with unlimited applications, backups, and 1-click SSL.
    • Professional: The Professional plan, priced at $19/month, is designed for developers shipping to production by expanding to 50 servers and adding advanced tools, such as application cloning and 10 staging environments.
    • Business: At $49/month, the Business plan is tailored for teams managing mission-critical workloads, including zero-downtime atomic deployments, team management, and API access.
    • Enterprise: The Enterprise plan, priced at $399/month, is designed for large-scale businesses that require extensive capacity, supporting up to 500 servers, 50 team seats, and high-volume API access.
    Suggested read: How to install & setup Ghost (NGINX and OpenLiteSpeed)

    RunCloud strikes the perfect balance between convenience and control by offering developers a unique hybrid approach to server management. While its intuitive dashboard simplifies common tasks, you retain complete access to your server’s underlying infrastructure. With full SSH access, you can dive into the command line whenever needed, whether for troubleshooting or advanced configurations.

    Unlike managed solutions that hide the filesystem from you, RunCloud provides direct access to your files, making it easier to debug issues, implement custom solutions, or perform granular backups. This combination of visual management tools and low-level access means platform limitations never constrain you.

    Additionally, RunCloud provides access to its API, which allows you to manage your server exactly as you need while still benefiting from its streamlined interface.

    Suggested read: The Best Web Development Tools To Level Up Your Stack

    Render

    Render is a modern cloud platform that reduces the complexity of deploying and managing Node.js applications. Unlike traditional hosting services that require extensive DevOps knowledge, Render abstracts away the infrastructure complexities while maintaining powerful capabilities.

    The platform automatically handles crucial aspects such as SSL certificate management, continuous deployment from Git repositories, and DDoS protection, which allows developers to focus primarily on their code.

    Paid Plans: Starting at $0/month, paid plan costs $19/month

    Best For: Small to medium-sized applications, startups

    Notable Features:

    • Zero-downtime deployments
    • Automatic scaling
    • Built-in DDoS protection
    • Native PostgreSQL support

    When traffic increases, Render automatically handles load balancing and scaling, requiring no manual intervention. The platform’s integrated PostgreSQL and Redis offerings are particularly valuable for Node.js developers, as they come with automatic backups, point-in-time recovery, and secure private networking. This makes it an excellent choice for novice users who don’t want to handle the infrastructure themselves.

    The platform’s ability to automatically sleep inactive services in development environments, and wake them on demand, helps optimize costs – especially for developers managing multiple projects or staging environments.

    Suggested read: How To Monitor Your Web App’s RAM & CPU Usage with Netdata

    Fly.io

    Fly.io is a developer-centric platform that excels in hosting Node.js applications and takes a unique approach to cloud deployment and pricing. It offers an innovative edge deployment model that automatically distributes applications across global regions for optimal performance. It also provides seamless WebSocket support, built-in Redis integration, and native PostgreSQL hosting capabilities, which makes it a great choice for JavaScript developers.

    Paid Plans: Pay-as-you-go plans, with a simple application costing approximately $15/month

    Best For: Distributed applications, edge computing

    Notable Features:

    • Global deployment with edge locations
    • WebSocket support
    • Built-in Postgres databases
    • Docker-based deployments

    It has sophisticated containerization support using its enhanced Docker implementation. This ensures that Node.js applications can be deployed with minimal configuration while maintaining full access to native Node.js features and packages.

    Similar to other tools in this list, Fly.io automatically handles crucial aspects such as SSL/TLS certification, HTTP/2 support, and global load balancing while still providing developers with granular control when needed.

    But what really distinguishes Fly.io is its approach to regional deployment. Node.js applications can be automatically distributed to edge locations closest to users, resulting in significantly reduced latency and improved application performance.

    Suggested read: How To Create a Docker Image For Your Application

    Cloudflare Pages + Workers

    Cloudflare offers a serverless platform to host Node.js applications using a unique combination of Workers and Pages. This is particularly compelling for Node.js developers because it eliminates the traditional distinction between frontend and backend deployments and allows for seamless integration of serverless functions with static content.

    Cloudflare has its own extensive global network, and it can place compute resources within 50ms of 95% of the world’s Internet-connected population. This results in exceptional website performance and page speed improvements.

    Free Tier Includes:

    • Unlimited sites
    • Unlimited requests
    • 100,000 Workers invocations/day
    • Unlimited bandwidth

    Paid Plans: Starting at $5/month

    Best For: JAMstack applications, serverless architecture

    Notable Features:

    • Global CDN
    • Automatic git deployment
    • Zero cold starts
    • Edge computing capabilities

    Additionally, Cloudflare uses a standard JavaScript runtime that ensures compatibility with existing Node.js packages and libraries while offering free egress and static asset hosting. It integrates essential development tools, including CI/CD pipelines, git-based deployments, and live previews, making it particularly attractive for teams looking to streamline their development workflow.

    It can auto-provision and directly integrate with other Cloudflare services such as KV (key-value storage), Durable Objects (distributed computing), R2 (object storage), and D1 (SQL database), providing developers with a complete ecosystem for building sophisticated Node.js applications.

    Suggested read: The 12 Best cPanel Alternatives to Manage Your Servers

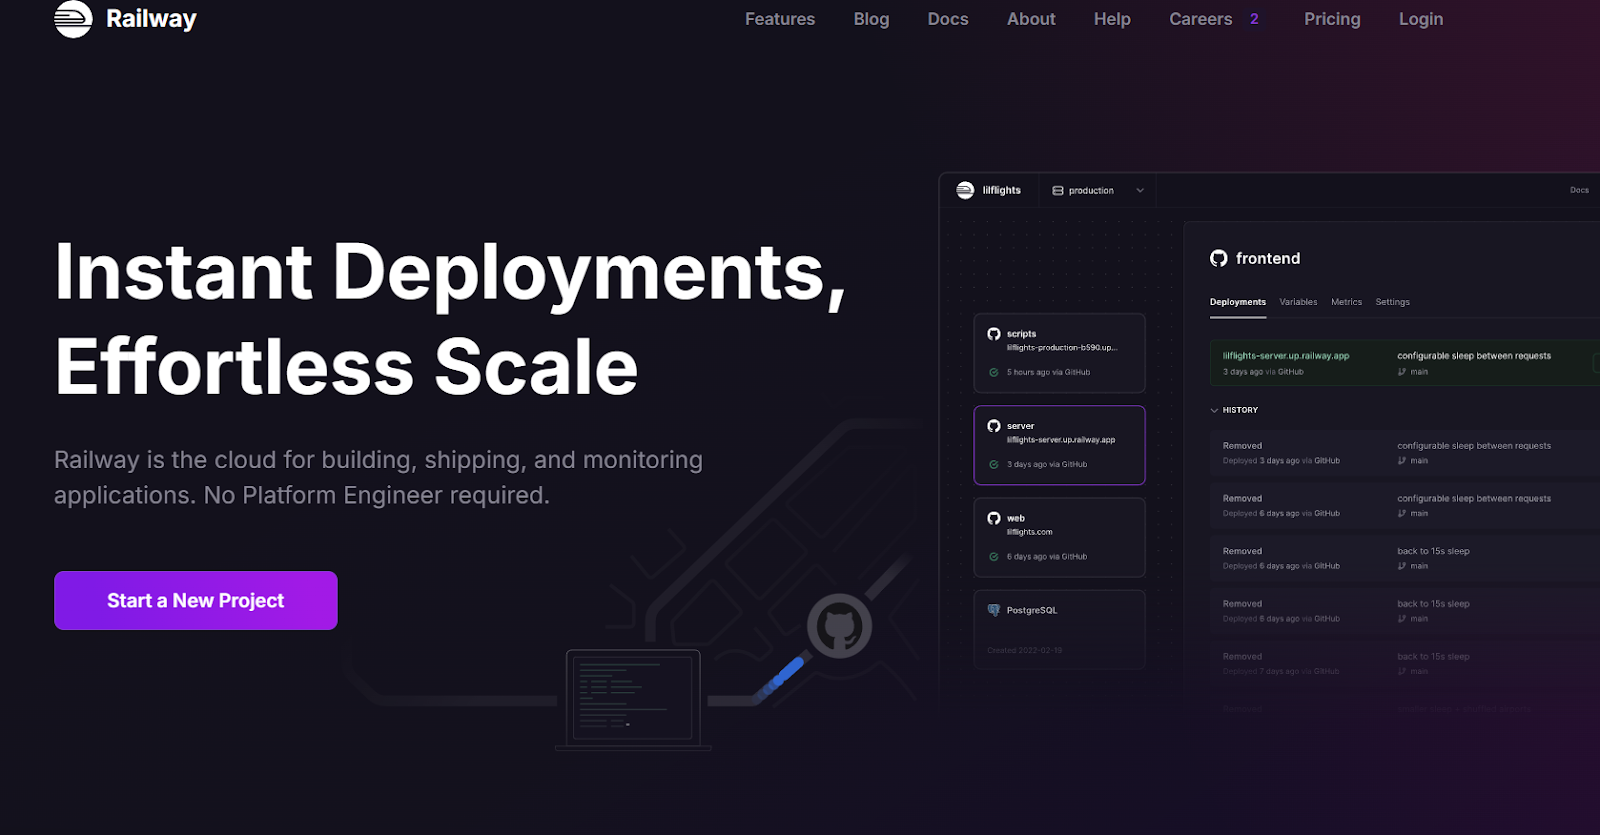
    Railway

    Railway is a developer-first platform with an impressive array of features that takes the pain out of deployment. It supports deploying directly from GitHub repositories, local codebases, and Docker containers. What sets it apart is its developer-centric features that dramatically speed up the development cycle. Railway’s automatic preview environments for pull requests mean you can test changes in isolation before merging to production.

    It also offers horizontal scaling capabilities, with support for 50+ replicas per service and round-robin load balancing, making it a great choice for fast-growing applications. Railway’s networking stack is particularly impressive, offering up to 100 GBPS of transfer speed for private networking between services and up to 10 GBPS for public traffic.

    Advanced users can also take advantage of their extensive observability tools – including 90-day log retention, JSON-structured logs, and comprehensive metrics monitoring.

    Free Tier Includes:

    • $5 credit monthly
    • 512MB RAM
    • Shared CPU
    • 1GB disk

    Paid Plans: Starting at $5/month

    Best For: Full-stack applications, development teams

    Notable Features:

    • One-click deployments
    • Built-in databases
    • Automatic HTTPS
    • Team collaboration tools

    Suggested read: Self-Managed or Managed Hosting: Which One is Right for You?

    Heroku

    Heroku was one of the first Platform-as-a-Service (PaaS) solutions, offering developers a seamless way to deploy Node.js applications without getting bogged down by infrastructure complexities. Heroku’s “dynos” are lightweight Linux containers that provide flexible computing options starting from as low as $7 per month.

    Similar to other cloud providers, Heroku has a comprehensive ecosystem of managed services, from PostgreSQL databases and Redis key-value stores, to automated certificate management and zero-downtime deployments.

    Free Tier: Discontinued

    Paid Plans: Starting at $5/month

    Best For: Enterprise applications, scalable projects

    Notable Features:

    • Extensive add-on marketplace
    • Advanced monitoring
    • Auto-scaling
    • Managed containers
    heroku hosting for NodeJS

    With features such as Heroku Pipelines, developers can create sophisticated CI/CD workflows that automate the journey from code to production. Additionally, Heroku’s Review Apps feature automatically creates temporary environments for pull requests, making code review and testing much easier and faster.

    When it comes to monitoring and maintenance, Heroku provides built-in application metrics, log management, and automated OS patching to ensure your Node.js applications remain healthy and secure.

    Suggested read: Cloud Hosting vs VPS Hosting – Which One Should You Choose in 2024?

    Vercel

    Vercel has a zero-configuration platform that prioritizes developer experience above everything else. It is very popular among JavaScript developers due to its seamless integration with popular frameworks like Next.js.

    What makes Vercel particularly powerful for Node.js developers is its serverless functions architecture. This architecture automatically handles the deployment and optimization of resources across 18 regions, eliminating the need for complex infrastructure management. It also offers automatic edge deployment across hundreds of global locations for lightning-fast content delivery.

    Free Tier Includes:

    • 100GB bandwidth/month
    • Serverless functions
    • CI/CD pipeline

    Paid Plans: Starting at $20/month

    Best For: Next.js applications, frontend-heavy projects

    Notable Features:

    • Edge functions
    • Analytics
    • Preview deployments
    • Team collaboration
    vercel hosting ofr node js

    Vercel also includes built-in DDoS protection at the edge and L3/L4 protection at every location, ensuring applications remain secure without compromising on performance. This makes it a great option for hosting NodeJS applications.

    How to Choose the Right Node.js Hosting for Your Project

    There’s no single best platform – it depends on your project. Use these four questions to narrow your choices and find the best fit for how you build and scale applications.

    1. Scalability

    Your application’s hosting needs will likely evolve over time. Choose a platform that can grow with you.

    • For Personal Projects & Prototypes: Start with a platform that offers a generous free tier. Render, Vercel, and Fly.io are excellent choices that enable you to deploy and run small applications with no initial investment.
    • For Growing Startups: Prioritize platforms that simplify the scaling process. Render’s autoscaling and Heroku’s flexible “dynos” let you handle traffic spikes without manual intervention. A solution like RunCloud on a cloud provider (e.g., DigitalOcean, AWS) also gives you a clear path to scale your server resources as needed.
    • For Large-Scale & Enterprise Apps: Focus on performance, reliability, and global reach. Fly.io excels at deploying applications close to your users worldwide, reducing latency. For maximum control and security, using RunCloud to manage dedicated servers gives you unparalleled power over your infrastructure.

    2. Developer Experience (GUI vs. CLI)

    How your team likes to work is an important factor.

    • GUI-Focused Teams: If you prefer a visual dashboard to manage deployments, environments, and settings, you’ll feel at home with Render, Vercel, or DigitalOcean App Platform. Their web interfaces are intuitive and require minimal setup.
    • CLI-First Developers: For those who live in the terminal, a command-line-interface-driven workflow is faster and more powerful. Fly.io and Heroku are famous for their excellent CLIs that let you deploy and manage apps with just a few commands.
    • The Best of Both Worlds: RunCloud strikes a unique balance. It provides a clean, powerful web dashboard to manage servers provisioned from any cloud provider, abstracting away complex server administration while still giving you the underlying power and SSH access of a full VPS.

    3. Budget and Pricing Models

    Understand how you will be charged to avoid surprise bills.

    • Fixed & Predictable: A subscription model, like that offered by RunCloud, provides a predictable monthly cost, which is great for budgeting.
    • Pay-As-You-Go: If your traffic is variable, the PAYG models of Render and Fly.io are ideal. You only pay for the resources you actually consume, making it highly efficient for apps with inconsistent usage patterns.
    • Tiered Pricing: Platforms like Heroku and Vercel often have structured tiers. These are good starting points, but be sure to monitor your usage to know when you might need to upgrade to the next level.

    4. Database and Integration Needs

    Your application is more than just Node.js code. Consider your database and other service requirements.

    • Integrated Managed Databases: For ultimate convenience, platforms like Render and Heroku offer managed databases that can be provisioned and connected to your application in just a few clicks. This removes the headache of database setup and maintenance.
    • Broad Ecosystem: Heroku’s main strength is its massive add-on marketplace. You can easily integrate dozens of third-party services for logging, monitoring, caching, and more.

    Wrapping Up

    In this post, we’ve explored several powerful platforms for deploying Node.js applications, from Railway’s developer-centric approach to Heroku’s mature ecosystem and Vercel’s cutting-edge infrastructure. Each platform offers unique advantages that could align with your project needs, whether it’s extensive database options, scalability, or edge computing capabilities.

    However, it’s crucial to consider the trade-offs associated with these Platform-as-a-Service solutions. While they offer convenience, users are often locked into their specific ecosystems, with limited control over the underlying infrastructure.

    Your hosting costs can quickly escalate as you scale, and you’re ultimately at the mercy of their pricing models and platform-specific limitations. Many developers want more control over their server environment or the ability to optimize configurations for their specific use cases.

    This is where RunCloud offers a compelling alternative.

    Unlike platform-specific solutions, RunCloud works with any cloud provider – whether it’s DigitalOcean, AWS, Google Cloud, or others – giving you the freedom to choose and switch providers as needed.

    With RunCloud, you get the best of both worlds: complete server control through CLI for when you need to fine-tune your setup, alongside a powerful dashboard that makes server management accessible and efficient.

    Want full control without the complexity?

    Try RunCloud free for 5 days and see how easily you can manage your Node.js servers across any cloud provider.

    Start Your Free RunCloud Trial

    FAQs on Node.js Hosting

    How much does it cost to host a Node.js server?

    Node.js hosting costs vary widely, from free tiers on platforms such as Cloudflare to hundreds of dollars per month for dedicated servers. Factors influencing price include required resources (CPU, RAM), bandwidth, and chosen hosting provider (shared, VPS, dedicated, or serverless).

    How do I run a node server locally?

    Install Node.js and npm on your machine. Then, navigate to your project’s directory in the terminal and run the command node server.js (or node index.js, depending on your main file).

    Which cloud database is best for node JS?

    Node.js is database-agnostic, meaning it works well with various databases. Popular choices include MongoDB (NoSQL, document-based) for flexibility and PostgreSQL (SQL, relational) for robust data integrity, depending on your project’s needs.

    How many clients can a NodeJS server handle?

    Due to its non-blocking, event-driven architecture, Node.js excels at handling concurrent connections. The number of clients depends on server resources, application complexity, and efficient code implementation, potentially scaling to thousands or even millions.

    Which architecture is best for node JS?

    Microservices architecture is often a good fit for Node.js applications as it allows for independent scaling and deployment of individual services. Alternatively, a more traditional monolithic architecture can be suitable for smaller projects with simpler requirements.

    Can I run NodeJS on shared hosting?

    Some shared hosting providers offer Node.js support, but it may be limited. Ensure your chosen provider allows SSH access and custom startup scripts to run your Node.js application effectively.


  • WP Rocket vs LiteSpeed Cache: Which One is Best in 2026

    WP Rocket vs LiteSpeed Cache: Which One is Best in 2026

    Have you ever given up on a website because it was taking forever to load? Almost certainly you have – probably many times. And it’s certainly not something you want visitors to do when visiting your site!

    A slow website can lead to a poor user experience, and improving its speed is one of the best ways to keep visitors happy – and rank higher on Google.

    In this post, we will look at some of the best caching solutions available, from the server-level power of LiteSpeed Cache to the famously beginner-friendly WP Rocket.

    But before we do that, let’s quickly understand the real reason why you need caching plugins.

    What is WordPress Caching and Why Do You Need It?

    Every time a visitor arrives at your site, WordPress has to process the information, fetch necessary pages from the database, process them with PHP, and assemble the final HTML page to serve the visitor. This process happens for every single visitor, and if you get a lot of traffic, your server will become overwhelmed, and the service will slow down for everyone.

    Caching is like preparing your most popular web request ahead of time. Instead of building the page from scratch every time, a caching system takes a snapshot of the fully assembled page and serves that static copy to visitors. This is dramatically faster and uses far fewer server resources.

    The primary reason you need caching is speed. A faster website provides a significantly better user experience, keeps visitors engaged, and reduces the chance they’ll leave your site out of frustration (this is known as lowering the “bounce rate”). Additionally, by reducing the workload on your server your website will be able to handle much more traffic simultaneously without slowing down or crashing.

    Server-Level Caching with RunCloud Hub

    While there are many WordPress caching plugins available, in our opinion, there is only one winner.

    RunCloud Hub is an advanced caching plugin that offers superior performance because it operates before WordPress even gets involved. RunCloud uses a highly optimized NGINX FastCGI cache, which works at the server level to intercept visitor requests.

    This method is incredibly efficient because it completely bypasses the slow process of loading WordPress, executing PHP scripts, and querying the database for the majority of your visitors.

    The caching features built into the RunCloud platform make managing and developing your websites extremely easy. For a new user, the complexity of configuring a typical caching plugin can be daunting. With RunCloud, you can enable a powerful, server-grade cache with a single click in your dashboard, and no complicated settings are required.

    However, this solution is only available for RunCloud users. If you are not a RunCloud user yet, let’s look at some of the other popular caching solutions that are available.

    📖 Suggested read: The Best WordPress Caching Plugins To Speed Up Your Site (2025)

    Caching Plugins for WordPress

    WP Rocket

    WP Rocket has earned its reputation as one of WordPress’s most powerful and user-friendly performance plugins. It’s a comprehensive, all-in-one solution designed to speed up your website with minimal hassle, making it ideal for users who want premium results without a steep learning curve.

    Unlike many other caching plugins requiring technical expertise to configure, WP Rocket automatically applies about 80% of web performance best practices upon activation. This immediate impact on site speed and Core Web Vitals is why it’s a go-to tool for beginners and seasoned developers who value their time and want a reliable, effective optimization solution that works on any hosting platform.

    wp rocket cache plugin

    📖 Suggested read: The Complete WordPress Speed Optimization Guide

    Key Features of WP Rocket

    WP Rocket has powerful features designed for maximum impact with minimal effort. Once activated, it immediately enables page caching and creates static HTML files that drastically reduce load times for subsequent visitors. For even faster performance, its cache preloading feature automatically warms up the cache after you make changes; this ensures that all visitors get the fastest version of your site right away.

    In addition to standard caching, WP Rocket includes advanced features such as LazyLoad for images, iframes, and videos, which delays loading media until it’s actually visible to the user. It also offers database optimization tools to clean up unnecessary clutter like old post revisions and transients, and seamless one-click integration with any Content Delivery Network (CDN).

    For ecommerce sites using WooCommerce or other popular plugins, WP Rocket is intelligently configured to automatically exclude cart and checkout pages from the cache, preventing any interference with the customer’s shopping process and ensuring a smooth, fast buying experience.

    📖 Suggested read: How to Use Redis Object Cache To Speed Up a Dynamic WordPress Site

    WP Rocket Pricing

    WP Rocket is a premium plugin with a transparent pricing structure based on the number of websites you need to support. They offer licenses for a single site ($59/year), a “Plus” license for three websites ($119/year), and a “Multi” license for 50 websites ($299/year), all of which include one year of support and updates.

    LiteSpeed Cache

    LiteSpeed Cache is a powerful site acceleration plugin uniquely designed to integrate directly with LiteSpeed web servers. It is very useful for LiteSpeed servers as it has a deep, server-level integration, which allows it to manage caching more efficiently than many other plugins that operate solely at the application level.

    When your website runs on a server powered by LiteSpeed Web Server (LSWS) or OpenLiteSpeed, the LiteSpeed Cache plugin can communicate directly with the server’s built-in caching engine (LSCache) and deliver remarkable performance improvements, especially for dynamic, high-traffic WordPress sites.

    This integration enables advanced caching capabilities, such as handling logged-in users and private content, that are often difficult to achieve with other caching solutions. However, the plugin’s primary strength is also its most significant limitation: its best features are exclusive to the LiteSpeed ecosystem.

    📖 Suggested read: NGINX Caching for WordPress – Complete Guide & Tutorial

    Key Features of LiteSpeed Cache

    The LiteSpeed Cache plugin for WordPress is much more than a simple caching tool. It allows you to control server-level full-page cache directly from the WordPress dashboard. This will enable you to efficiently handle dynamic content such as WooCommerce shopping carts and logged-in user sessions.

    The plugin also includes an exclusive server-level crawler that automatically travels your site to refresh expired cache pages, ensuring visitors always experience the fastest speeds. In addition to caching, it offers an advanced set of optimization features, including image optimization, a Content Delivery Network (QUIC.cloud CDN) specifically for LiteSpeed, and tools for minifying and combining CSS, HTML, and JavaScript files.

    LiteSpeed Pricing

    LiteSpeed offers a flexible pricing model that covers software licenses and professional services. For its core products, the LiteSpeed Web Server Enterprise has an accessible entry point starting from $0/month, while the more specialized LiteSpeed Web ADC begins at $65/month. Both are available through monthly, yearly, or owned license plans.

    In addition to the software itself, LiteSpeed provides a range of paid support services, including one-time fees for tasks like installation (from $150) and WordPress optimization (from $100), as well as ongoing support options such as hourly assistance (from $150/hour) and a semi-annual optimization service priced at $1,200.

    LiteSpeed Cache Requirements and Limitations

    The biggest requirement for unlocking the full potential of the LiteSpeed Cache plugin is that your website must be hosted on a server running either LiteSpeed Web Server Enterprise, OpenLiteSpeed, or another LiteSpeed product like a WebADC. Without one of these specific server technologies, the plugin’s most powerful feature, the server-level page cache, is completely non-functional.

    In this scenario, LiteSpeed Cache acts merely as a generic optimization plugin, putting it on the same level as many other tools but without its key differentiator.

    This server dependency is the plugin’s major limitation. Many of the best hosting platforms and server management tools are built on highly tuned NGINX and Apache stacks, which are known for their performance, stability, and widespread community. You cannot use LiteSpeed’s server-side cache if your site is on one of these common server types.

    📖 Suggested read: Everything You Need to Know About WordPress Object Caching

    When to Choose WP Rocket Over LiteSpeed Cache

    When your website is not hosted on a LiteSpeed server, you should choose WP Rocket over LiteSpeed Cache. In these environments, LiteSpeed Cache’s signature server-level caching features are disabled, stripping it of its primary advantage. WP Rocket, on the other hand, is built to be universally compatible and deliver exceptional results on any server type, making it the most reliable and powerful choice for the average user.

    Furthermore, WP Rocket is better if you prioritize ease of use and a fast, predictable workflow. Its interface is famously intuitive, and it applies critical optimizations right out of the box with minimal configuration required from the user.

    When to Choose LiteSpeed Cache Over WP Rocket

    The primary reason to choose LiteSpeed Cache over WP Rocket is when your hosting provider explicitly uses LiteSpeed Web Server (LSWS) or its open-source variant, OpenLiteSpeed. In this specific environment, the LiteSpeed Cache plugin can integrate directly with the server’s native caching engine, creating a uniquely powerful integration that is difficult for other plugins to match.

    This deep integration allows it to handle dynamic content, such as ecommerce or membership sites, with incredible efficiency. It also provides access to the free QUIC.cloud CDN, which is tailored for the LiteSpeed ecosystem.

    Securely managing and integrating this plugin with your server environment on traditional web hosting providers can be challenging. But if you use the OpenLiteSpeed tech stack on your RunCloud server, you can enable the LiteSpeed Cache plugin on your WordPress website with a single click.

    📖 Suggested read: LiteSpeed Cache WordPress Plugin Configuration Tutorial

    WP Rocket vs. LiteSpeed vs. RunCloud Cache

    To simplify your decision, this table compares the key aspects of each solution, including the server-level caching provided by RunCloud.

    FeatureWP RocketLiteSpeed CacheRunCloud Cache (Server-Level)
    Primary Caching MethodPlugin-Based (PHP)Server-Integrated (on LSWS)Server-Native (NGINX FastCGI)
    Server RequirementAny (NGINX, Apache, etc.)LiteSpeed Server (LSWS/OLS)RunCloud Optimized NGINX and Docker Stack
    Ease of Use⭐⭐⭐⭐⭐ (Simple)⭐⭐⭐ (Moderately Complex)⭐⭐⭐⭐⭐ (One-Click Activation)
    Performance ImpactExcellentExcellent (Only on LiteSpeed)Exceptional
    Risk of ConflictsLow (Well-coded)Moderate (Many settings)Virtually Zero (Runs before plugins)
    CostPremium (Starts at $59/yr)FreeIncluded with RunCloud Subscription
    Ideal ForUsers who want a simple, universal solution.Users on LiteSpeed hosting.Users who want maximum speed with zero complexity.

    Wrapping Up: Making Your Decision for the Best Cache Plugin for You

    Choosing the right caching solution is one of the most important decisions for your WordPress website’s performance. However, the most significant performance gains don’t come from a plugin alone, but from the server. Both WP Rocket and LiteSpeed Cache are primarily application-level solutions, meaning they work within WordPress.

    A truly exceptional performance strategy should have a server-level cache that operates before WordPress even loads to serve pages with maximum speed and efficiency.

    This is where a third option shines, RunCloud’s full-page cache, which offers a more fundamental and powerful solution to the speed problem.

    If you’ve managed a WordPress site for any length of time, you’ve likely faced these issues:

    1. The “White Screen of Death” occurs when you enable a setting like “Minify JavaScript”, and your site’s layout or functionality breaks completely.
    2. Plugin & Theme Conflicts: Your caching plugin clashes with your page builder, e-commerce plugin, or theme, causing visual glitches.
    3. Changes Not Appearing: You update a page, but the changes don’t show up for you or your visitors because of a persistent cache that’s difficult to clear.

    RunCloud’s server-level cache inherently solves these problems. Because it caches the entire fully rendered page before WordPress or any plugins are loaded, it cannot conflict with them. When you need to see an update, you simply click “Purge Cache” in your WordPress dashboard to instantly serve the fresh version of the page.

    But that’s not all – RunCloud enables you to manage your entire server workflow with unparalleled simplicity. With RunCloud, you can perform all of the following:

    • Create a new server on any cloud provider.
    • Deploy new applications with a single click.
    • Update PHP versions with a single click.
    • Perform automated backups with a single click.
    • Create staging environments with a single click.

    From server setup to full-page caching, RunCloud handles the heavy lifting so you can focus on what matters. Get started with RunCloud in minutes.

    FAQs on WP Rocket vs LiteSpeed Cache

    Is WP Rocket worth the money compared to free LiteSpeed Cache?

    WP Rocket is a good investment for its ease of use and powerful features that work on any server environment. While LiteSpeed Cache is free, its most powerful features are exclusively tied to using a LiteSpeed web server, which isn’t always an option. A better approach is to use a superior server-level cache, like the one-click RunCloud Hub, which provides a massive performance boost on WordPress websites.

    Do I need a caching plugin if my host already has server caching?

    Yes, you can benefit from both, as they perform different jobs. A server cache, like RunCloud’s NGINX FastCGI cache, handles the heavy lifting of page caching for the fastest possible load times. You can then use a plugin to handle secondary optimizations like CSS/JS minification and lazy loading, creating a comprehensive performance strategy.

    Can I use both WP Rocket and LiteSpeed Cache plugins together?

    No, you must never activate two page-caching plugins like WP Rocket and LiteSpeed Cache at the same time. This will create critical conflicts as they fight to control the same processes, almost certainly breaking your website. The correct method is to choose one plugin for its features or rely on a more powerful server-level solution like RunCloud Hub as your primary caching engine.

    How does LiteSpeed Cache compare to W3 Total Cache?

    LiteSpeed Cache is generally more user-friendly and offers unique server-level integrations when used on a LiteSpeed server. W3 Total Cache is a powerful, albeit complex, plugin that offers a high degree of customization but can be overwhelming for new users. If simplicity and power are your main objectives, RunCloud Cache provides a server-level solution that outperforms typical plugin caching and requires just a single click to enable.

    Does LiteSpeed Cache conflict with page builders like Elementor?

    LiteSpeed Cache can occasionally conflict with page builders if its asset optimization settings are configured too aggressively. A more stable solution is to use RunCloud’s server cache for raw speed, as it operates before any plugins load and is therefore inherently conflict-free with Elementor.

    Is WP Rocket easier to configure than LiteSpeed Cache?

    Yes, WP Rocket is widely considered much easier to configure, offering a “set it and forget it” experience that works great out of the box. LiteSpeed Cache, while powerful, presents a more complex interface with many settings that can be confusing for non-experts. But for ultimate simplicity, RunCloud’s server cache is enabled with a single toggle, eliminating complex plugin configurations for your primary caching needs.

    Can LiteSpeed Cache improve Core Web Vitals more than WP Rocket?

    On a LiteSpeed server, LiteSpeed Cache may have a slight edge due to its deep integration, but this advantage depends entirely on the server technology. On any other platform, like the high-performance NGINX servers managed by RunCloud, WP Rocket often performs on par or better. Ultimately, your best Core Web Vitals results will come from a fast server foundation, which is precisely what RunCloud’s optimized stack and server cache are built to provide.

  • WordPress Permalinks Not Working Here is the Easy Fix

    WordPress Permalinks Not Working Here is the Easy Fix

    Seeing “404 Page Not Found” on posts that definitely exist?

    Broken WordPress permalinks are usually to blame – and while frustrating, they’re easy to fix.

    Permalinks are your post and page URLs. When they break, visitors can’t reach your content, and your SEO suffers. This guide walks you through quick fixes that restore your links in minutes.

    Common Causes of Broken Permalinks

    Before we fix the problem, let’s look at what typically causes permalinks to fail. Here are the most common reasons why WordPress permalinks suddenly stop working:

    • Plugin or theme conflicts: A new or updated plugin/theme can interfere with your URL rules and cause 404 errors.
    • Corrupted .htaccess file: This configuration file controls your links. If damaged, it can stop your pages from loading.
    • Recent WordPress updates: Updates can sometimes break permalink settings, especially with outdated plugins.
    • Site migration or domain change: Moving to a new host or domain can leave WordPress pointing to old URLs.
    • Restoring from backup: Restored settings may not match your current server environment, leading to mismatched link paths.

    How to Fix Broken WordPress Permalinks (Step-by-Step)

    If your website links are leading to “404 Page Not Found” errors, then don’t panic! This is a very common WordPress issue, and the fix is usually surprisingly simple. Follow the steps below to fix it:

    1. Resetting Your Permalinks

    Resetting your permalinks fixes 404 errors in most cases.

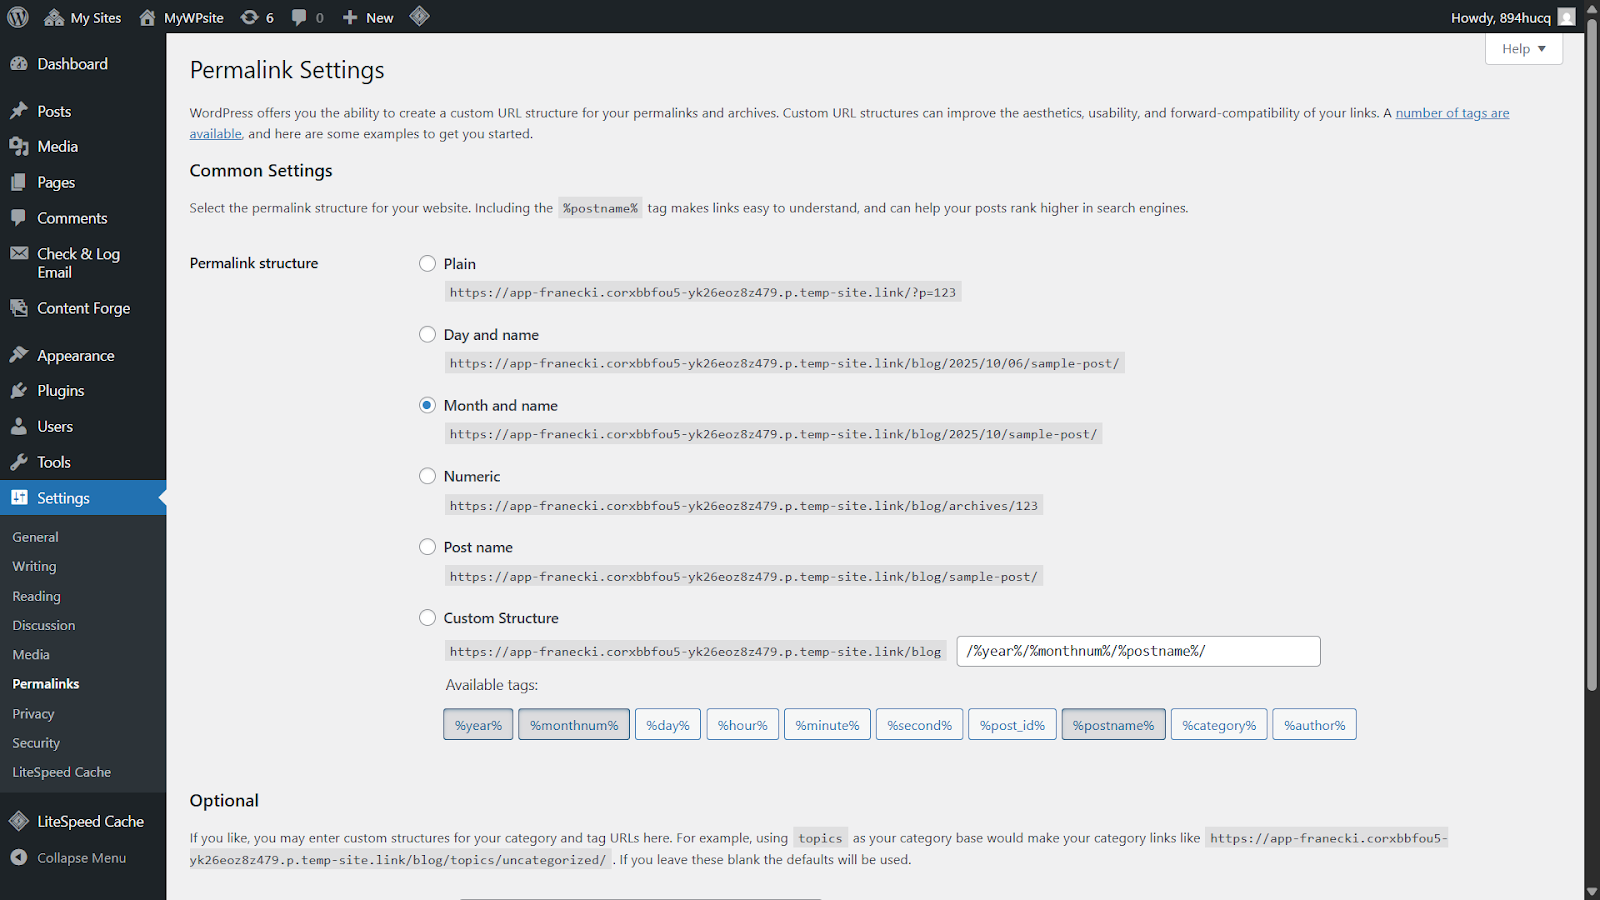
    • Log in to your WordPress dashboard.
    • Go to Settings → Permalinks.
    • Without changing anything, click Save Changes.

    WordPress will refresh your link structure automatically. Check your pages again – the issue is often already fixed.

    Reset wordpress permalinks

    By just re-saving the page, you’ve prompted WordPress to fix its link structure behind the scenes. Now, go visit one of your pages to see if the error is gone. If not, proceed to the next step.

    2. Temporarily Deactivating Your Plugins

    If resetting the permalinks didn’t work, then it is possible that a plugin is misbehaving. If you are using a firewall or security plugin, then it is also possible that it isn’t configured correctly and causing an issue.

    In this step, you will need to deactivate your plugins one by one and try to identify what caused the issue. Don’t worry; deactivating a plugin won’t delete its settings or your data.

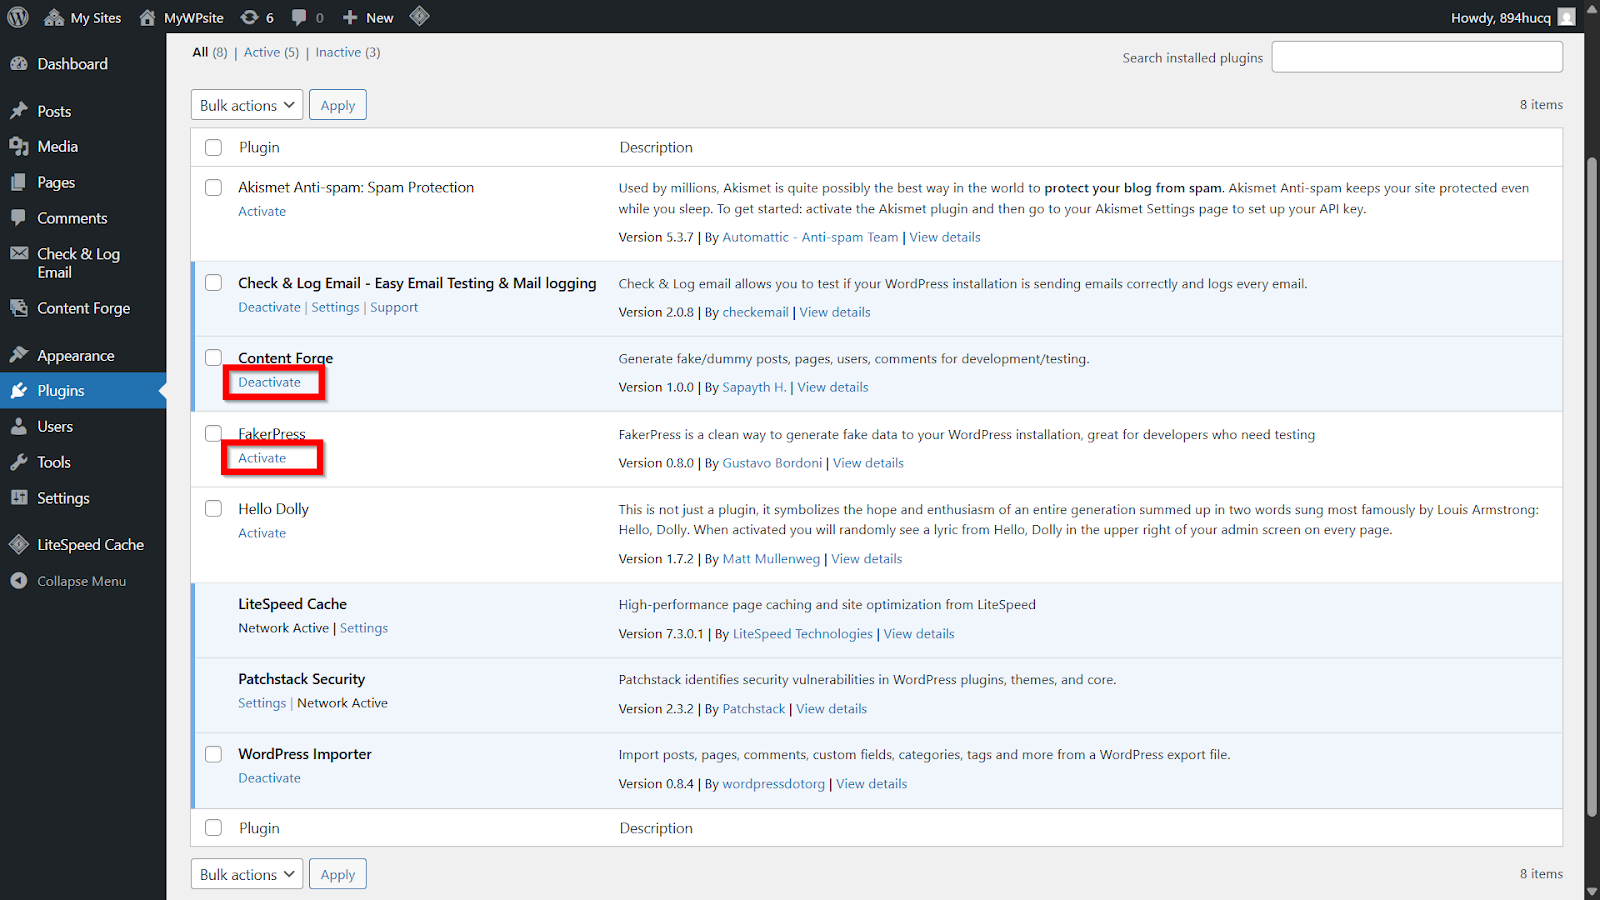
    1. Step 1: In your WordPress dashboard, go to Plugins > Installed Plugins.
    2. Step 2: From the list of active plugins, select the plugin that you want to disable temporarily and click Deactivate under it.
    3. Step 3: Now that this plugin is off, check your website. If your links work again, then you will know that this plugin was causing the issue.
    4. Step 4: Once you find the plugin causing the problems, you can either find a replacement for it or contact its developer for help.

    3. Regenerate Your .htaccess File

    This step is a bit more hands-on and requires some technical knowledge. Many WordPress hosts and themes create an .htaccess file on the server. This file stores important configuration and tells the server how to handle URLs.

    Important Note for NGINX Users: If your website runs on a pure NGINX server, you will not have an .htaccess file. NGINX handles permalinks differently. This step is only for users on Apache, LiteSpeed, or NGINX with .htaccess enabled servers. If you’re unsure, you can likely skip this and check your permissions (Step 4) or contact your host.

    WARNING: Your .htaccess file is extremely sensitive. Editing this file incorrectly can instantly break your entire website. A bad edit could also silently create security vulnerabilities. Only proceed with this step if you are comfortable editing core website files and have made a backup.

    Here’s how to safely force WordPress to generate a new, default version:

    Step 1: Access Your Website Files

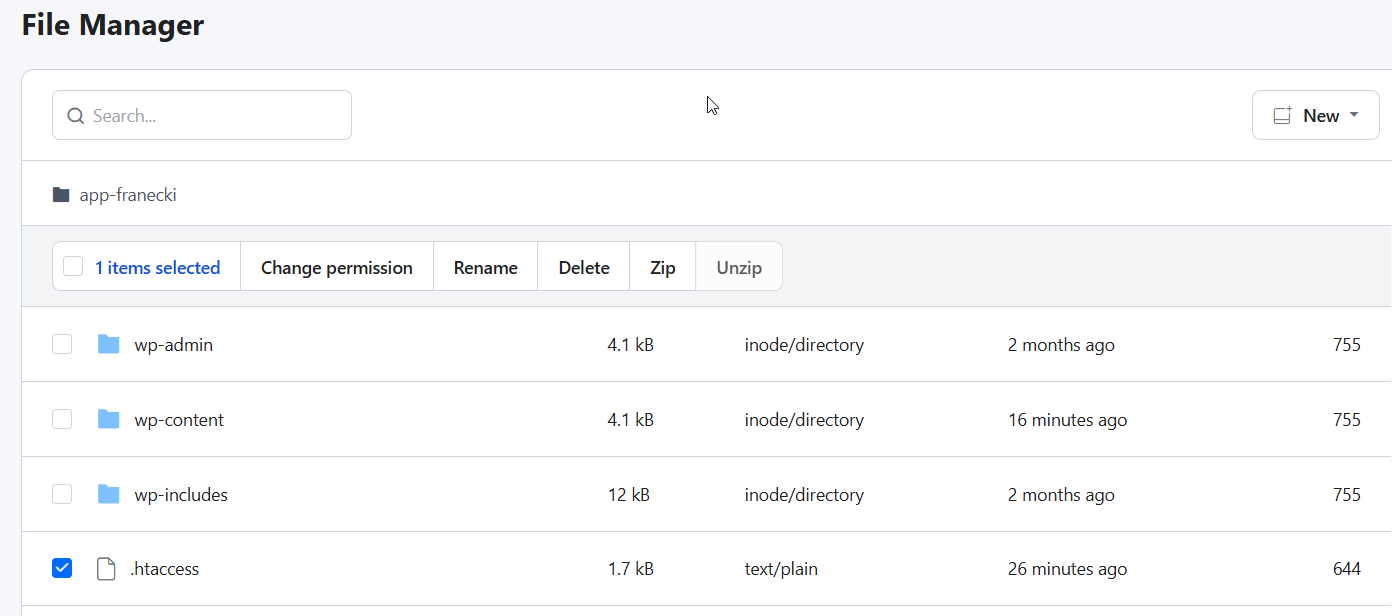
    To access your site’s core files, use either an FTP client or the RunCloud File Manager.

    In RunCloud:

    1. Log in to your dashboard.
    2. Select your server and web application.
    3. Click File Manager to open your site’s root directory.

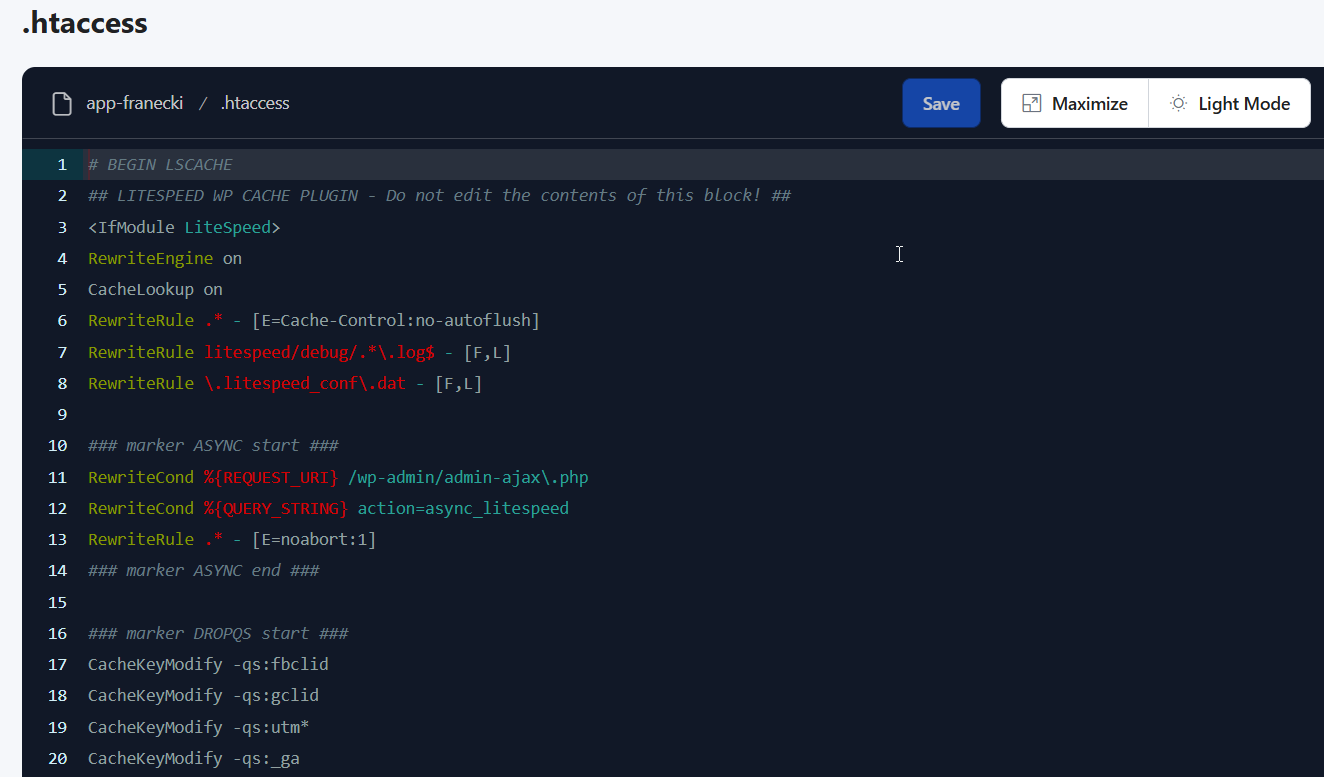
    From here, find and back up your .htaccess file. Rename it to .htaccess_old, then go to Settings → Permalinks → Save Changes in WordPress to generate a clean version.

    Step 2: Locate the .htaccess File in Your Website’s Root Folder

    Now, you’ll need to find the .htaccess file itself. In your File Manager or FTP client, navigate to the main (or “root”) directory of your WordPress installation. This is the top-level folder that contains your core WordPress directories, such as wp-content, wp-admin, and wp-includes.

    It’s very common not to see this file at first glance. By default, files that start with a dot (like .htaccess) are treated as “hidden files” or “dotfiles” by many systems. Your file manager is likely hiding it to prevent you from making accidental changes.

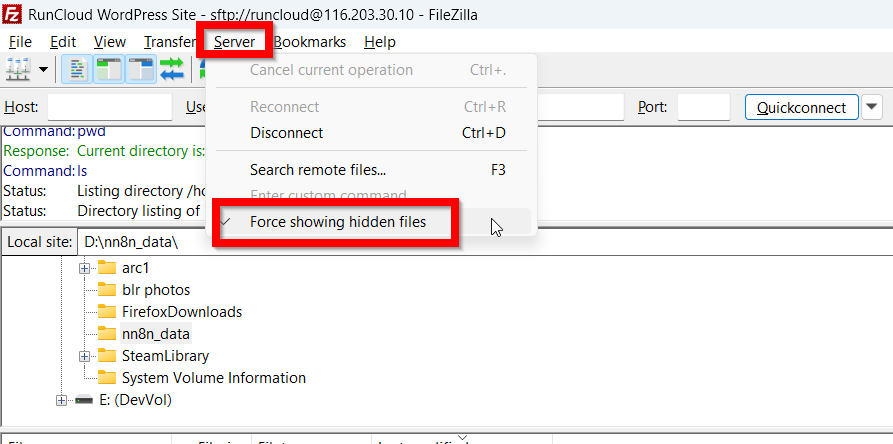
    You will need to configure your tool to show these hidden files. In an FTP Client (like FileZilla): this setting is usually in the top menu bar. Look for an option under “Server” and click “Force showing hidden files”.

    After changing the setting, the file list should refresh, and your .htaccess file will now be visible.

    If you have correctly enabled hidden files and the .htaccess file is genuinely not there, it is a strong indicator that your website is not running on an Apache or LiteSpeed server. Instead, it is likely on an NGINX server, which is a popular, high-performance alternative.

    NGINX does not use .htaccess files to manage URL rules; its configuration is handled differently at the server level. If this describes your situation, then a broken or missing .htaccess file is not the cause of your permalink issue. You can safely skip the rest of this section and move on to the next potential fix.

    Step 3: Replace the Old .htaccess File

    First, you should download the existing .htaccess file to your laptop for a backup. With your backup safely downloaded, you can now proceed with resetting the file on your server.

    In your File Manager or FTP client, right-click on the original .htaccess file and choose the “Rename” option. A simple and effective name is .htaccess_old or .htaccess_backup.

    This action does two things at once: first, it preserves your original file in case you need to restore it. Second, by renaming it, you effectively deactivate the old, potentially corrupted file.

    Now, leave your File Manager open and switch back to your WordPress dashboard in your browser.

    1. On the left-hand menu, navigate to Settings > Permalinks.
    2. You do not need to change any of your permalink settings on this page. Simply scroll to the bottom and click the Save Changes button.

    If the issue was a corrupted file, this action will almost certainly fix your broken links.

    Step 4: Manually Editing .htaccess

    Once you have disabled the old file, you should create a new file with the necessary rules for your website. If you use caching plugins (like WP Rocket), security plugins (like Wordfence), or custom redirects, then you might need to add custom rules or restore them from the old file.

    4. Reviewing File Permissions

    In our previous post on file permissions, we explained that file permissions in Linux are like digital locks on your website’s files. If the permissions are wrong, WordPress might be locked out and unable to work as expected.

    Your .htaccess file should have 644 permissions.

    In RunCloud, you can fix this in seconds – go to your web application’s Permissions section and click Reset File Ownership to correct all file and folder settings automatically.

    Wrapping Up: Fixing WordPress Permalinks Easily

    In this post, we have explained how to fix broken permalinks on a WordPress site. The good news is that the fix is almost always straightforward once you know where to look. By following this guide, you’ve learned how to diagnose and solve the issue quickly.

    While these fixes are effective, the real goal is to spend less time troubleshooting and more time building. Having the right tools can make all the difference as it transforms complex server tasks into simple clicks.

    Managing servers doesn’t have to be complicated.

    RunCloud gives developers full control with one intuitive panel – from NGINX caching and SSL setup to automated backups.

    Start your free RunCloud trial today and experience how effortless WordPress management can be.

    FAQs on WordPress Permalinks

    Why are my WordPress links not working?

    The most common reasons for non-functional WordPress links are plugin or theme conflicts, a corrupted .htaccess file, incorrect server configuration, or issues after a website migration or update.

    How do I fix a 404 error after changing permalinks?

    The first step is to reset your permalinks by going to Settings > Permalinks and clicking “Save Changes”. If that doesn’t work, you should check for plugin conflicts or regenerate your .htaccess file.

    Can a new plugin break my permalinks?

    Yes, a new plugin can interfere with your .htaccess file and break your permalinks. Deactivating plugins one by one is a good way to identify the culprit.

    What should my .htaccess file permissions be?

    The recommended file permission for your .htaccess file is 644.

    Is it safe to change my permalink structure on a live site?

    Changing your permalink structure on a live site can lead to broken links and a drop in SEO rankings if not done correctly. If you must change it, ensure you set up 301 redirects from the old URLs to the new ones to preserve your link equity.

  • What is “401 Error Unauthorized Access” and How to Fix it?

    What is “401 Error Unauthorized Access” and How to Fix it?

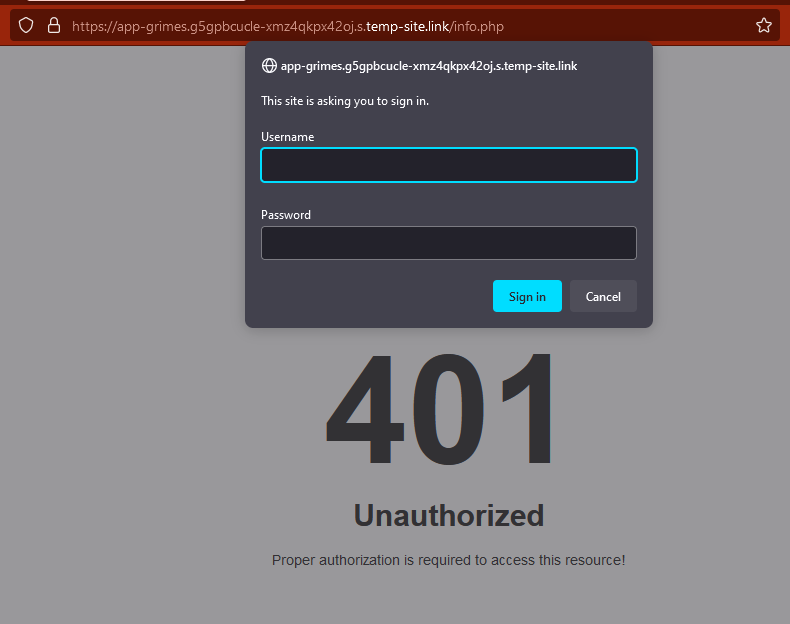
    Seen a “401 Unauthorized” or “Access Denied” message when visiting a website?

    This error means your browser couldn’t prove you have permission to view a page.

    The good news: it’s easy to fix. This guide explains what causes the 401 error and walks you through the steps to resolve it quickly.

    Let’s get started!

    Understanding the 401 Unauthorized Error

    When you browse the internet, your web browser and the website’s server exchange messages to deliver the content you want to see. Most of the time, these exchanges are successful, and you never see any error codes. However, if you don’t have the necessary permissions to access a web page, you will see the 401 Unauthorized Error.

    A 401 error happens when the server can’t verify your identity. In most cases, your login credentials are missing, invalid, or expired.

    You might see this error displayed in a few different ways, but they all mean the same thing:

    • “401 Authorization Required”
    • “HTTP 401 Error – Unauthorized”
    • “Access Denied”

    This is a client-side error, meaning the problem is caused by the browser sending either incorrect or incomplete credentials to the server.

    401 vs. 403 Errors – What’s the Difference?

    The 401 and 403 errors look similar but mean different things:

    401 Unauthorized Error403 Forbidden Error
    IssueAuthentication Failure: The server cannot verify your identity.Authorization Failure: Your identity is verified, but you don’t have permission.
    Your Login StatusYou are either not logged in or have provided incorrect credentials (e.g., wrong password).You are successfully logged in with valid credentials.

    Suggested read: How to Fix a 502 Bad Gateway Error

    Common Reasons for a 401 Error

    Once you understand what causes a 401 error, fixing it is simple. Follow these steps to resolve the issue and regain access.

    1. Incorrect Login Details

    Let’s start with the most obvious and common cause: a simple typo. You might have accidentally misspelled your username or entered the wrong password. Check for common mistakes like having Caps Lock on or mixing up similar characters like the number ‘0’ and the letter ‘O.

    2. Outdated Browser Cache and Cookies

    All modern browsers store bits of information from websites you visit in a local storage area called the browser cache. It also saves small files called browser cookies that remember your login status, site preferences, and other session data.

    Storing this information locally is great for website performance, but it can sometimes cause a 401 error. If your browser’s cache or cookies become corrupted or outdated, your browser might send an old, invalid login token to the server. The server, seeing these incorrect credentials, denies you access and returns a 401 error.

    3. An Incorrect URL or an Outdated Link

    Sometimes the problem is as simple as a mistake in the web address. You may have typed the incorrect URL or clicked on an old bookmark that points to a page that no longer exists or has been moved behind a login wall. Certain pages on a website are meant to be private and require authentication. If you try to access one directly without being logged in, the server will correctly block you with a 401 error. Always double-check that the URL is correct and that you’re trying to access a public page or are properly logged into a private area.

    4. Plugin or Theme Incompatibility (For Website Owners)

    Security or firewall plugins can sometimes block valid logins after an update or misconfiguration. Temporarily disabling them can help identify the issue. This is a common source of WordPress errors, and it is often triggered after a recent update to a plugin, a theme, or the WordPress core itself.

    5. Firewall Issues

    A firewall (either on the website’s server or even on your own network) can cause a 401 error. A Web Application Firewall (WAF) is designed to identify and block suspicious traffic. If it detects what it perceives as a threat from your IP address (perhaps due to multiple failed login attempts), it may block your access to prevent a potential attack, which would result in a 401 Unauthorized response.

    How to Fix a 401 Error (Step-by-Step)

    Now that you understand what the 401 error is and where it comes from, it’s time to troubleshoot 401 issues and get you back in. We’ll start with the simplest solutions and work our way up to more technical fixes. Follow these steps in order, as the problem is often resolved within the first few steps.

    1. Double-Check the URL

    This may sound overly simple, but an incorrect URL is a frequent cause of this error. Make sure you have typed the web address correctly. Pay close attention to ensure you haven’t accidentally tried to access a page that is restricted to administrators or logged-in users.

    If you clicked on a link from an email or another website, it might be an outdated link that now points to a protected resource. Try navigating to the website’s main homepage and then finding the page you need from there.

    2. Review Your Login Credentials

    The most common problem is a simple mistake in your username or password. Before trying anything else, carefully re-enter your login details.

    • Check for typos.
    • Ensure your Caps Lock key isn’t on.
    • If you’re still locked out and are not 100% sure of your password, the safest bet is to use the “Forgot Password?” or “Reset Password” link on the login page. This eliminates any guesswork.

    3. Clear Your Browser’s Cache and Cookies

    If the URL and your login details are correct, the next step is to check your browser’s stored data. Outdated or corrupted cache and cookies can cause your browser to send invalid authentication information to the server. Clearing the browser cache is a quick and easy way to fix 401 errors.

    Here’s how to do it on popular browsers:

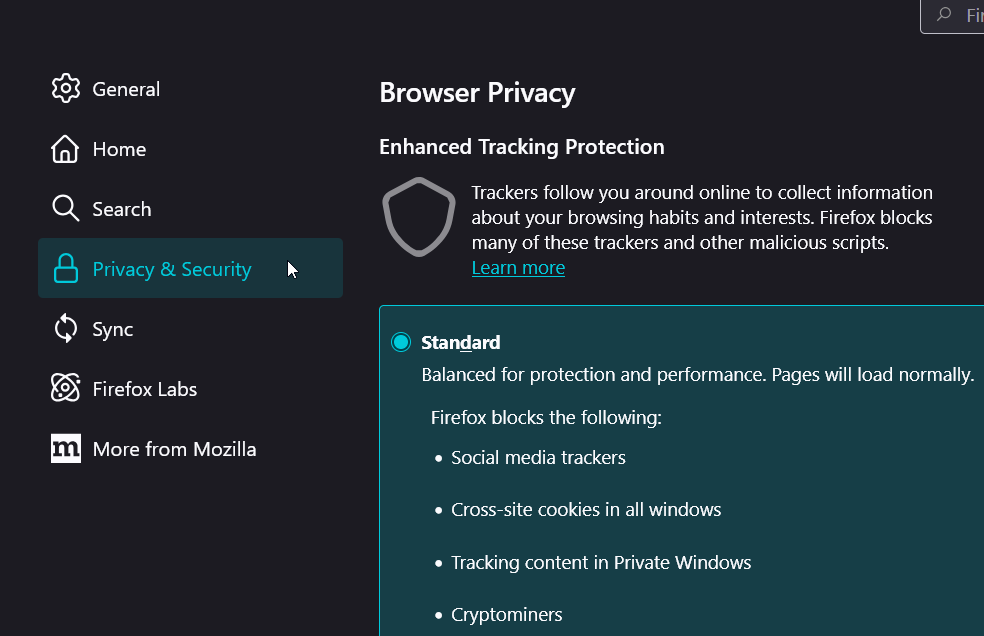
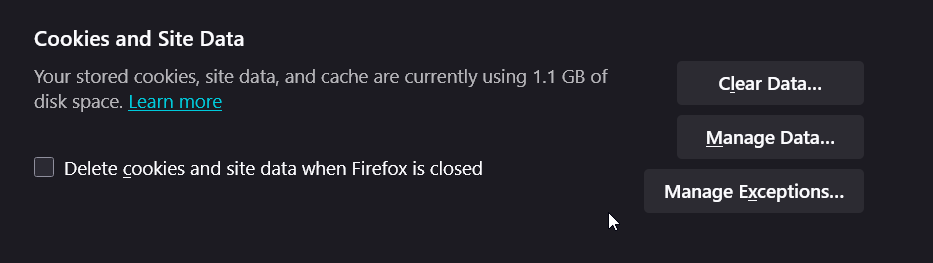
    • In Chrome or Firefox, open Settings → Privacy → Clear browsing data.
    • Select Cookies and Cached images/files, then confirm.
    • Restart your browser and try again.

    After clearing the data, close your browser completely, reopen it, and try logging in again.

    4. Deactivate Your WordPress Plugins (For Website Owners)

    If you are experiencing the 401 error on your own WordPress site after an update, then a plugin (especially a security or firewall plugin) may be causing this error. The easiest way to check this is to deactivate WordPress plugins.

    • If you can access your dashboard: Navigate to Plugins > Installed Plugins. Select all plugins by checking the top box, and from the Bulk actions dropdown, choose Deactivate. If the error disappears, you know a plugin was the cause. Reactivate them one by one, checking the site after each activation, until the error returns. The last plugin you activated is the culprit.
    • If you are locked out of your dashboard: You’ll need to use an FTP client or your hosting provider’s File Manager. Navigate to the wp-content folder and find the plugins folder. Rename it to something like plugins_old. This will deactivate all plugins. If you can now log in, rename the folder back to plugins and then follow the one-by-one reactivation process from your dashboard.

    5. Check the HTTP Headers (For Advanced Users)

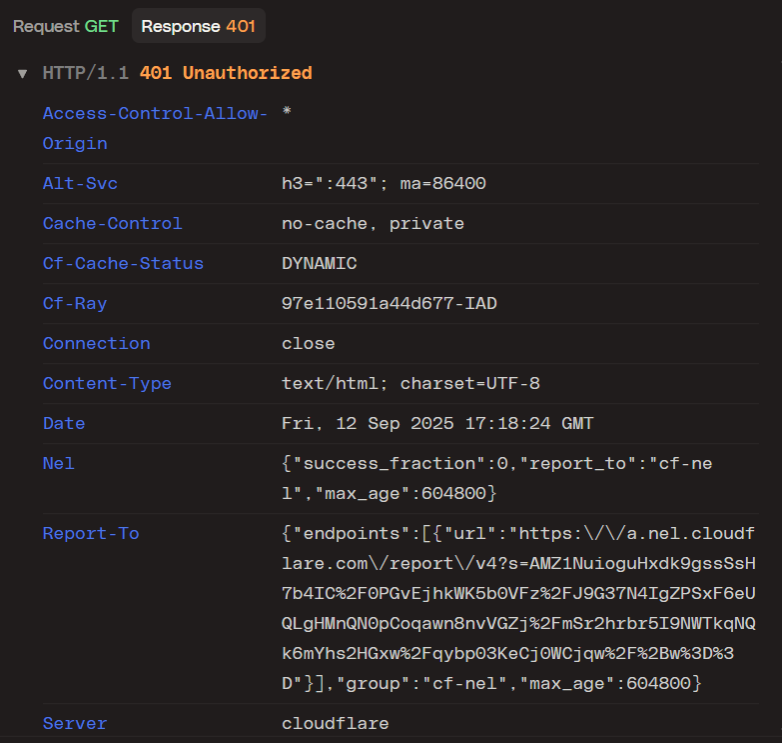
    This is a more technical step. When a server sends a 401 response, it also includes additional headers. These headers contain data that specifies which authentication scheme the server requires (e.g., Basic, Bearer). You can view this header using your browser’s developer tools.

    1. Open the page causing the 401 error.
    2. Right-click anywhere on the page and select Inspect or Inspect Element.
    3. Go to the Network tab.
    4. Reload the page. You’ll see a list of network requests.
    5. Find the request with a 401 status (it will be red). Click on it.
    6. In the details pane, look for the Headers tab. This can give a developer clues about why the authentication is failing.

    6. Contact the Website Administrator

    If none of these steps work, contact the site administrator.

    Include:

    • The URL causing the error
    • The time it occurred
    • The steps you’ve already tried

    This information will help them identify and resolve the issue much faster.

    Wrapping Up: Fixing 401 Errors the Easy Way

    In this post, we’ve seen that “401 error” is rarely a sign of a major problem. More often than not, it’s a simple miscommunication between your browser and the server, usually caused by a minor issue like a typo, an outdated browser cache, or a conflicting plugin.

    Most 401 errors are easy to fix, often caused by old logins, cached data, or a simple typo.

    But if you manage multiple sites, dealing with access issues, plugins, and performance can take up valuable time.

    RunCloud helps you focus on your work while it handles the rest – from security to server management.

    Start your free RunCloud trial today and spend less time troubleshooting.

  • How to Set Up Business Email on Your Domain [With MX SPF DKIM DMARC]

    How to Set Up Business Email on Your Domain [With MX SPF DKIM DMARC]

    Still using a @gmail.com or @yahoo.com address for your business?

    A custom domain email, like contact@example.com, instantly boosts trust and makes your brand look credible and professional. It’s also free advertising as every email you send reinforces your website.

    The only catch is that setting it up means dealing with a few confusing DNS terms: MX, SPF, DKIM, and DMARC.

    This guide breaks them down in plain English and shows how to configure everything correctly using tools like RunCloud and Cloudflare.

    Let’s get started!

    Why Proper Email Configuration is Necessary

    Even if your email already works, proper configuration is critical for three reasons:

    1. Building Credibility & Brand Trust

    A custom domain email is your digital business card. It instantly builds credibility and brand trust. An address like contact@example.com shows you are an established, legitimate business, whereas a generic @gmail.com address can appear unprofessional and temporary to potential clients.

    2. It Helps Avoid the Spam Folder

    The single most important technical reason for proper setup is to prevent emails from landing in the spam folder. Major providers like Google and Yahoo now require email authentication (SPF & DKIM) to verify that you are who you say you are. Without these records, your invoices and client proposals will likely be rejected or land in spam.

    3. Protecting Your Brand from Spoofing & Phishing

    Proper email configuration is an important security measure that protects your brand’s reputation from fraud. These records make it nearly impossible for malicious actors to “spoof” your domain and send phishing emails pretending to be you. This safeguards your customers from scams and prevents the irreversible damage to your brand trust that occurs when your name is tied to fraudulent activity.

    What Do You Need for Your Business Email Setup

    Before we get into the technical settings, let’s break down the three simple things you need to get started. We’ll also cover what you can expect to spend, so there are no surprises.

    A Custom Domain Name

    A domain name is your unique digital address on the internet (e.g., example.com). The great news is that if you already have a website, you do not need to buy a new domain. You can use the same one for your email at no additional cost.

    If you are buying a domain name for the first time, then you should try to pick something that is short and memorable but also represents your brand. Some companies go a little overboard with this and end up spending millions of dollars on a domain name. However, there is no need for that, and if you don’t have a domain yet, you can purchase one from a domain registrar like Namecheap, GoDaddy, or Cloudflare. A standard .com domain typically costs around $10 to $20 per year.

    An Email Hosting Provider

    This is the service that will actually handle sending, receiving, and storing your emails. While some basic web hosting plans include free email, a dedicated provider offers far better reliability, security, and features.

    Professional email hosting is very affordable and is usually priced per user (or per mailbox). Depending on the provider and features you need, you can expect to spend between $3 and $12 per user per month. There are far too many good email providers available out there to cover in one post, so we recommend reading the following posts if you want to learn more:

    Access to Your Domain’s DNS Records

    This sounds technical, but it’s simply the control panel where you tell the internet where to send your email. It’s like a switchboard for your domain, and you just need to know where to find it. You can typically access your DNS settings through the same company where you bought your domain (your registrar) or with your website hosting provider.

    Access to managing your DNS records is free. This essential feature is included with your domain registration or hosting plan.

    A Step-by-Step Guide to DNS Records for Business Email

    Let’s dive into the technical details. This part can seem intimidating, but it’s just a matter of copying and pasting the right information into the right boxes. We’ll walk through setting up each of the four records one by one.

    For this guide, we’ll demonstrate how to add these records using Cloudflare, a very popular and free DNS provider known for its speed and user-friendly interface. The steps will be very similar, no matter which DNS provider you use.

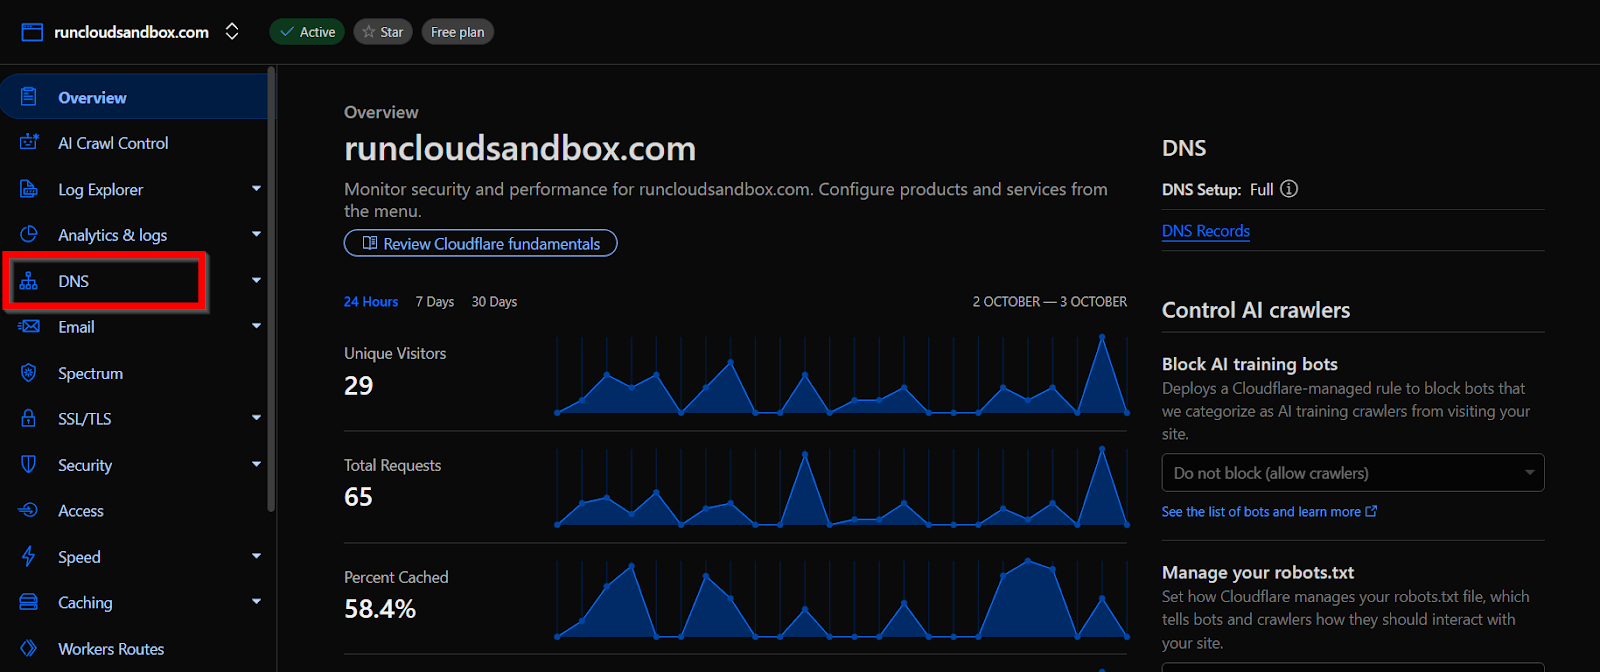
    First, log in to your Cloudflare account, select your domain, and navigate to the DNS > Records section. This is where we’ll be working.

    How to Set up MX Records

    If your domain is a building, then the MX (Mail Exchange) record is the mailing address on the front door. It tells the internet exactly which server to use to deliver your emails.

    Your email provider (like Google Workspace or Zoho Mail) will give you a list of their mail servers and a “priority” number for each. Your job is to enter these into your DNS settings.

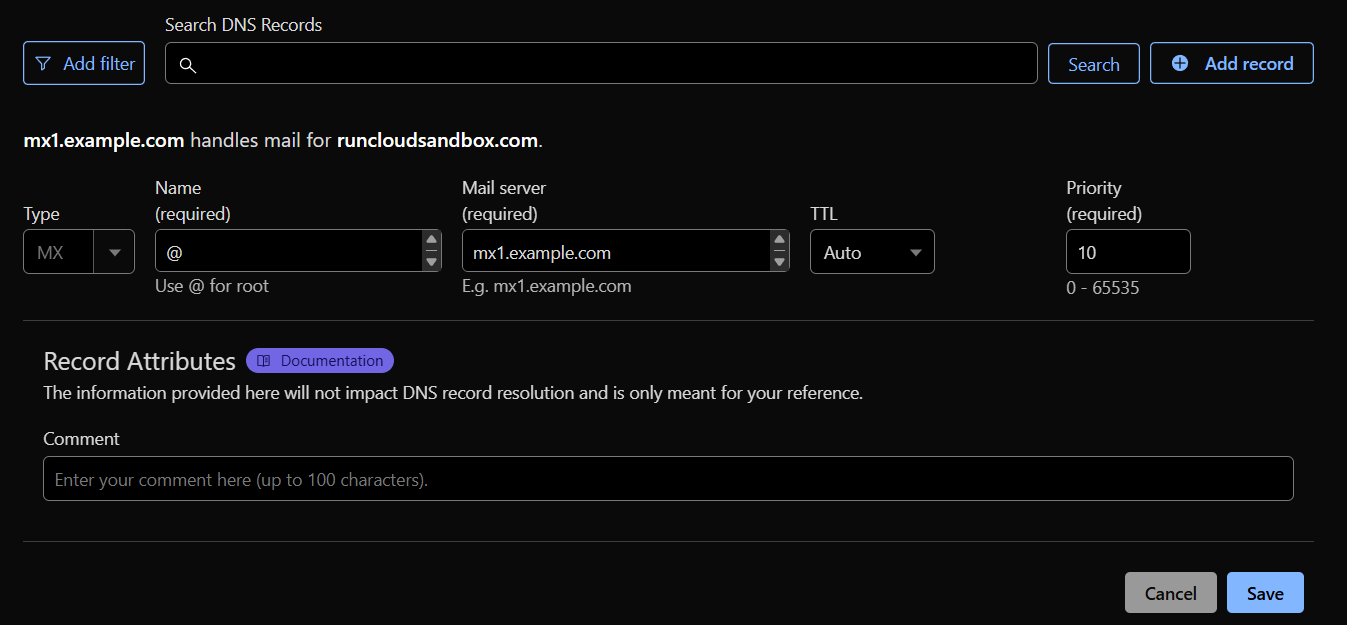
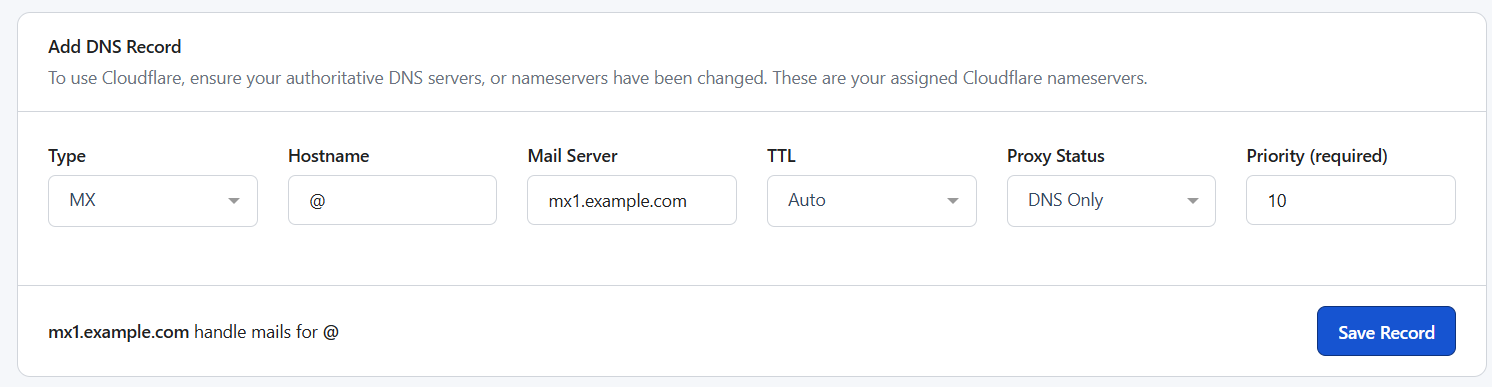
    1. In your Cloudflare DNS panel, click Add record.
    2. Select MX from the “Type” dropdown menu.
    3. In the Name field, type @. This symbol simply means it applies to your main domain, and your emails will look like contact@example.com. If you want to use a subdomain for a separate email server, then you can type the subdomain here. For example, if you type txns here, then the resulting email address will look like contact@txns.example.com
    4. In the Mail server field, enter the first server address your email provider gave you (e.g., test.google.com).
    5. In the Priority field, enter the corresponding priority number (e.g., 10).
    6. Click Save.


    Important: Your email provider will probably give you multiple MX records. You must repeat this process for every single one they provide, each with its own unique server and priority number.

    How to Set up SPF Record

    An SPF (Sender Policy Framework) record tells all other mail servers which email systems are officially allowed to send email on behalf of your domain.

    An SPF record is created as a TXT record. You can only have one SPF record per domain, so if you already have one, you’ll need to edit it rather than add a new one.

    1. In Cloudflare, click Add record.
    2. Select TXT for the “Type.”
    3. In the Name field, type @.
    4. In the Content field, paste the SPF value your email provider gave you. For Google Workspace, it looks like this: v=spf1 include:_spf.google.com ~all
    5. Click Save.

    What does SPF Records mean:

    1. v=spf1: This just identifies it as an SPF record.
    2. include:_spf.google.com: This is the list of servers that can send emails on your behalf. It tells everyone on the internet to check and approve anything Google sends on your behalf.
    3. ~all (Soft Fail): This tells servers that if an email comes from a sender not on the list, they should accept it but mark it as suspicious. It’s safer to start with this. –all (Hard Fail) tells them to reject the email completely.

    How to Set up a DKIM Record

    DKIM (DomainKeys Identified Mail) is like a unique, unbreakable wax seal on a letter. It uses a cryptographic signature to prove that the email genuinely came from you and its content hasn’t been altered in transit.

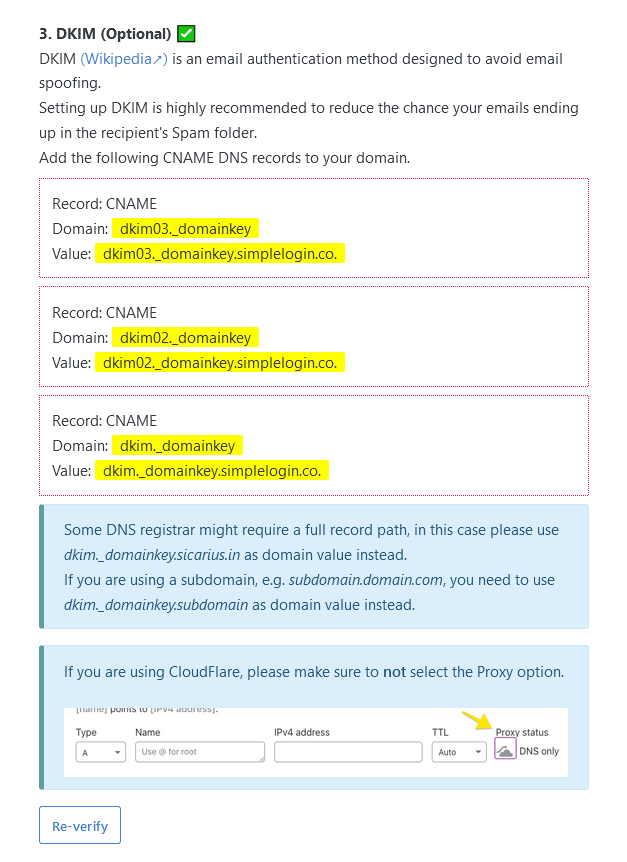
    First, you’ll need to generate a DKIM key inside your email provider’s admin panel. This process will give you two pieces of information: a selector (the name for the record) and a public key (the long text value).

    1. In Cloudflare, click Add record.
    2. Select TXT for the “Type.”
    3. In the Name field, paste the selector your provider gave you. It will look something like google._domainkey.
    4. In the Content field, paste the entire long public key text. Be careful to copy the whole thing, as it can be very long.
    5. Click Save.

    To learn more about this, check out our full-length article on DKIM – What Is It & Why Your Emails Need It.

    How to set up a DMARC Record

    DMARC (Domain-based Message Authentication, Reporting, and Conformance) checks both the SPF records and the DKIM records. Based on what it finds, it follows your instructions on what to do with unverified mail and sends you reports on email activity.

    If you have an existing domain that is sending out emails, we strongly recommend starting with a “monitor only” policy to avoid accidentally blocking legitimate emails.

    1. In Cloudflare, click Add record.
    2. Select TXT for the “Type.”
    3. In the Name field, type _dmarc.
    4. In the Content field, paste the following starter policy: v=DMARC1; p=none; rua=mailto:dmarc-reports@example.com (You are supposed to replace this email with your actual email, but read the next section to find what we recommend).
    5. Click Save.

    Understanding the DMARC policy:

    1. v=DMARC1: Identifies the record.
    2. p=none: This is your instruction. Here, none means “monitor only” and don’t take any action. Later, you can change this to p=quarantine (send to spam) or p=reject (block entirely).
    3. rua=mailto:…: This tells servers where to send daily reports about your email activity, which is incredibly useful for spotting issues. These reports are sent in XML format and are best viewed using specialized software. We recommend using the Postmark DMARC report tool instead of publishing your personal email on the internet.

    Suggested read: How to Flush DNS Cache on Windows, Mac, and Linux

    Using RunCloud and Cloudflare for Effortless DNS Management

    If the steps above seemed tedious and prone to error, you’re not alone. Managing DNS records directly at your domain registrar or a basic hosting panel often comes with frustrating challenges:

    • Clunky Interfaces: The control panels are frequently outdated and confusing to navigate.
    • Disconnected Workflow: You have to jump between your server management panel, your email provider’s instructions, and your DNS provider’s website, increasing the chances of making a copy-paste error.
    • Slow Updates: After you make a change, you can be left waiting for hours due to slow DNS propagation and left wondering if you did it correctly. If you make a mistake, correcting it can be just as slow and stressful.

    RunCloud simplifies DNS management by integrating directly with Cloudflare.

    Instead of jumping between multiple dashboards, you can add or edit DNS records straight from your RunCloud panel.

    This reduces the risk of typos, speeds up propagation, and keeps your workflow consistent across sites and domains.

    Final Thoughts

    Setting up MX, SPF, DKIM, and DMARC isn’t just a technical detail as it’s what ensures your emails reach inboxes, not spam folders.

    Taking a few minutes to configure these records protects your brand, improves deliverability, and builds long-term trust with your clients.

    With RunCloud and Cloudflare, you can handle these configurations from one clean dashboard. No more switching between panels or waiting for updates.

    Manage DNS and hosting the smart way. 

    Get started with RunCloud and set up a professional email the right way.

    FAQs & Common Troubleshooting

    How long does it take for DNS changes to work?

    The process, known as DNS propagation, can traditionally take up to 48 hours for changes to be visible globally. However, when using a fast, modern DNS provider like Cloudflare (which integrates seamlessly with RunCloud), these updates are often nearly instant. This means your new email settings can start working in minutes.

    How do I check if my email records are set up correctly?

    You can easily verify your setup using free online diagnostic tools, which act as a DNS checker for email deliverability. Simply enter your domain name into a trusted service like MXToolbox or DMARCian’s DMARC Inspector. These tools provide a full report on your MX, SPF, and DKIM records, confirming if they are configured correctly.

    My emails are still going to spam after setting this up. Why?

    While correct DNS records are important, other factors heavily influence deliverability, such as your domain’s age and reputation. Be mindful of your email content to avoid spam trigger words, and make sure to “warm up” a new email address by sending emails slowly at first to build trust with providers.

    What’s the difference between ~all and -all in an SPF record?

    The ~all (Soft Fail) tag means that receiving servers should accept the email but mark it as suspicious, which is ideal for testing. The -all (Hard Fail) tag is a strict command to reject any email that fails the test outright. It is always recommended to start with ~all to avoid accidentally blocking legitimate emails while you monitor your setup.

    Can I use multiple email services with one domain?

    Yes, but you must authorize all sending services within a single SPF record, as a domain cannot have multiple. You can achieve this by using the include: mechanism for each service, such as v=spf1 include:_spf.google.com include:sendgrid.net ~all for using both Google Workspace and SendGrid. This ensures both your primary business email and transactional messages are authenticated correctly.

  • How to Fix Cloudflare Captcha Failure in 2026 [SOLVED]

    How to Fix Cloudflare Captcha Failure in 2026 [SOLVED]

    Cloudflare CAPTCHA errors are a common frustration for both users and developers.

    These verification failures waste time, interrupt logins, and can even block legitimate visitors from accessing your site.

    In this guide, you’ll learn what causes Cloudflare CAPTCHA to fail – including network, browser, and configuration issues – and how to fix them effectively, whether you’re troubleshooting as a user or optimizing your setup as a site administrator.

    What Cloudflare CAPTCHA Does

    Cloudflare CAPTCHA, now evolving into Cloudflare Turnstile, verifies that site visitors are human before allowing sensitive actions like logins, registrations, or form submissions.

    Cloudflare Turnstile captcha

    Captcha challenges serve several key security purposes:

    • Protects against brute-force attacks by blocking automated login attempts.
    • Prevents spam and abuse in forms, comments, or mass account creation.
    • Verifies human interaction to maintain service integrity.
    • Reduces fraudulent activity by preventing bot-driven actions.

    Common Reasons Cloudflare CAPTCHA Fails

    Cloudflare uses machine-learning models to classify traffic as safe or suspicious. These models aren’t perfect, meaning legitimate users can sometimes be challenged or blocked.

    The most common triggers include:

    • Suspicious IP addresses: Shared or blacklisted IPs from VPNs, proxies, or hotel Wi-Fi can be misclassified.
    • High challenge frequency: When multiple users share an IP previously linked to abuse, Cloudflare increases CAPTCHA prompts.
    • Aggressive security rules: Overly strict firewall or bot protection settings can block genuine visitors.

    To reduce false positives:

    • Use reputable VPNs.
    • Avoid public or shared networks for login attempts.
    • Review Cloudflare’s Firewall Rules and Bot Fight Mode for overly restrictive settings.

    How to Fix CAPTCHA Failures (for Users)

    Captcha failures can indeed be a source of frustration, but there are several steps you can take to resolve common issues.

    Here is our three-point checklist of how to troubleshoot Cloudflare Captcha failures:

    #1 – Clear Your Browser’s Cache and Cookies

    Cached data and cookies are essential components of your browsing experience, designed to improve website performance and remember your preferences. However, if the cached version of a webpage becomes outdated or corrupt, it may not interact properly with current versions of web applications – this can lead to Captcha either not loading or not validating your inputs correctly.

    Additionally, cookies can sometimes store incorrect or outdated session data, which may conflict with the Captcha validation process. For example, if a cookie retains an old session state, it might prevent the Captcha from recognizing that you’ve entered the correct response.

    How to Clear Cached Data and Cookies:

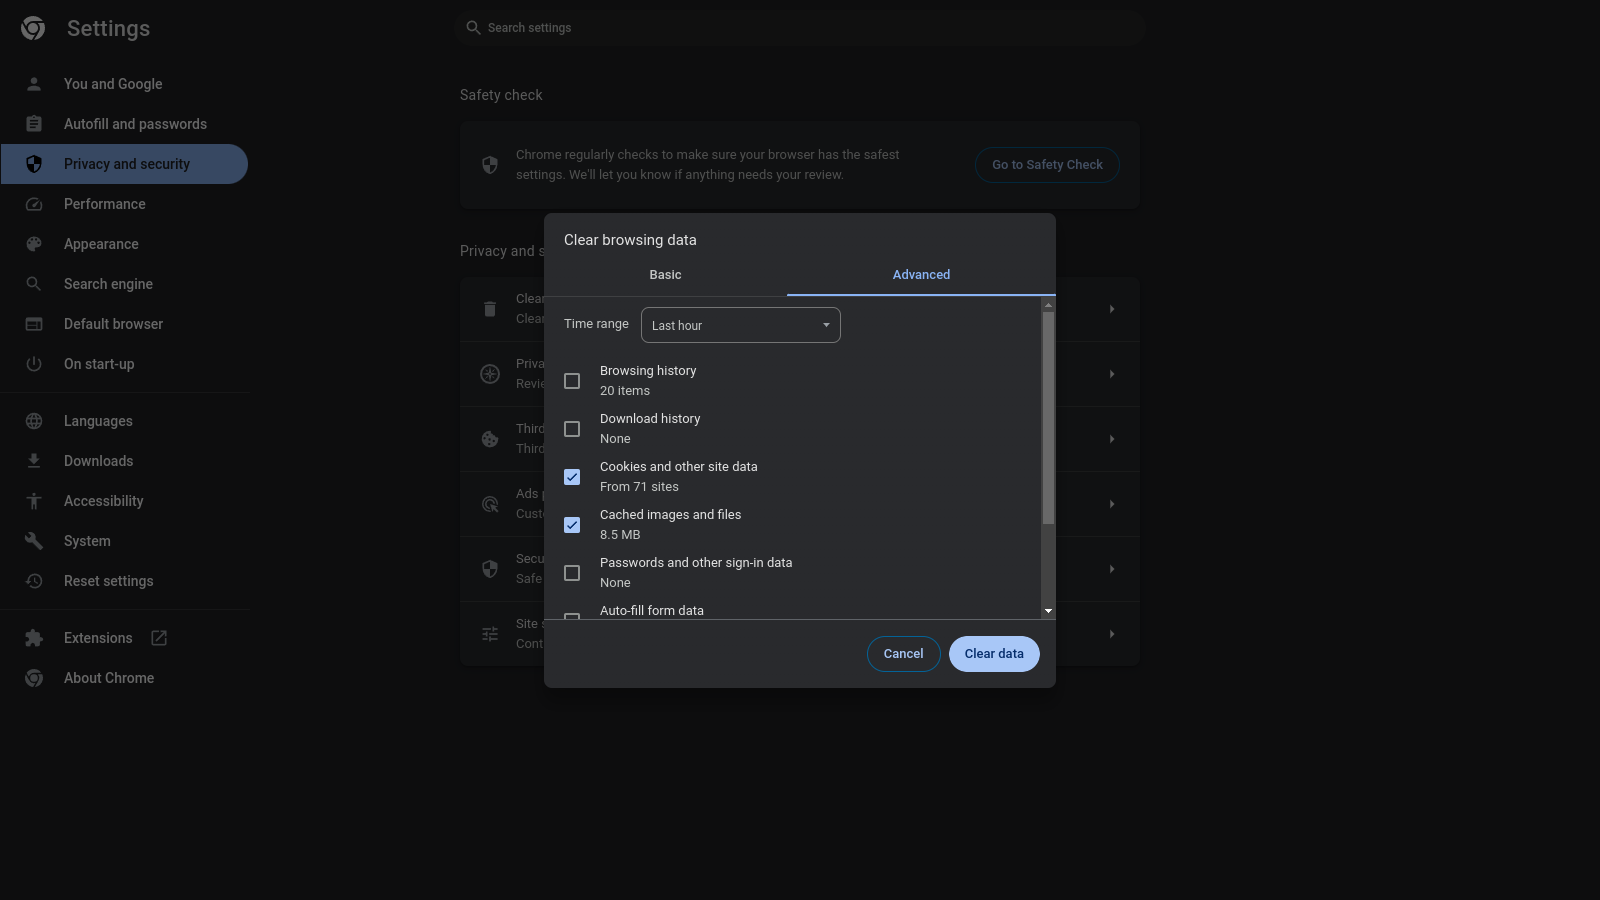
    1. Access Browser Settings: Open your browser settings or preferences. This is usually found in the menu in the upper right corner of your browser.
    2. Locate Clearing Options: Look for an option that says something like “Clear browsing data,” “Clear cache,” or “Clear cookies and site data”.
    3. Select Data to Clear: Choose to clear cached images and files (cache) and cookies. You may also have the option to clear browsing history, but this is not typically necessary for resolving Captcha issues.
    4. Clear the Data: Confirm the action to clear the selected data from your browser.
    Cookies clear to fix captcha

    By clearing your cache and cookies, you remove any potentially corrupted or outdated files that could be causing issues with Captcha. This can often resolve problems where Captcha won’t load or won’t accept your input, even when you’re sure you’ve got it right.

    #2 – Update Your Browser

    Modern web applications, including Captcha systems, are built using the latest web standards; an outdated browser may not be compatible with these standards, leading to functionality issues.

    Update your browser regularly as new updates introduce new features or improve existing ones, including those related to accessibility and user interaction, which can affect how Captchas are displayed and function.

    #3 – Disable Browser Extensions

    Browser extensions can significantly enhance your browsing experience by adding functionality or improving privacy. However, they can also interfere with how web pages load and function, and this can include the operation of Captcha systems.

    Many extensions use JavaScript to modify web pages, which can lead to altering or blocking scripts that are essential for Captcha to work. Some privacy-focused extensions might actually block or restrict web requests that Captcha systems use to verify responses. To fix this, consider temporarily disabling extensions:

    1. Open Extension Settings: Launch your browser and enter chrome://extensions/ (for Chrome) or the equivalent in your browser’s address bar.
    2. Disable Extensions: You’ll see a list of installed extensions with toggle switches. Turn off all extensions by clicking these switches.
    3. Test Captcha: With all extensions disabled, try accessing the Captcha again. If it works, extensions are likely the cause of the problem.
    4. Consider Alternatives: If you identify an extension that’s causing issues, look for alternative extensions that don’t interfere with Captcha, or adjust the extension’s settings if possible.

    Managing CAPTCHA Behavior (for Site Admins)

    If you are a website owner, administrator, or developer, then you need to understand why your legitimate users are being challenged and how to fine-tune your settings for a better experience without compromising security.

    In this section, we will teach you how to diagnose issues with Cloudflare analytics, configure Turnstile for modern applications, and test your implementation correctly.

    Use Turnstile Analytics to Diagnose Issues

    Cloudflare’s Turnstile Analytics dashboard is your best diagnostic tool for understanding how security challenges affect real users.

    Key metrics to review include:

    • Challenge volume: Identify sudden increases that may indicate new bot activity or overly strict firewall rules.
    • Challenge solve rate (CSR): A low CSR suggests legitimate users are being challenged or abandoning the process.
    • Challenge type metrics: Track whether certain challenge types (e.g., managed vs. interactive) correlate with failures.

    Regularly reviewing these metrics helps ensure your configuration maintains security without compromising user experience.

    Enable Pre-Clearance for Single-Page Apps

    Single-page applications (SPAs) don’t reload full pages, which can lead to repeated Turnstile challenges as users navigate between views.

    Cloudflare’s Pre-Clearance feature solves this by issuing a temporary verification cookie after a user completes one challenge. This cookie confirms the user’s authenticity for the rest of their session, preventing unnecessary prompts and improving usability.

    Exclude Turnstile from Automated Testing

    If you are running automated tests on your application, then you will need a way to bypass Turnstile verification. Continuously solving real challenges in a test environment is impractical and unreliable. Cloudflare provides dedicated testing keys for this purpose.

    You should use the official test credentials provided in Cloudflare documentation for your testing environments. Cloudflare’s servers will always accept these keys without presenting a real challenge.

    Warning: Never use these test credentials in a production environment. Your deployment process must have safeguards to ensure that only your production keys are used on your live website.

    Troubleshooting Repeating CAPTCHA Loops

    A “challenge loop” happens when users solve one CAPTCHA only to face another immediately after.

    Common causes:

    • Unstable or low-quality network connections (e.g., public Wi-Fi or VPNs).
    • Browser extensions blocking Turnstile’s JavaScript.
    • Outdated browsers (Internet Explorer is unsupported).
    • Disabled JavaScript – Turnstile cannot function without it.

    Fix: Ensure JavaScript is enabled, test on a modern browser, and avoid VPNs or shared connections when possible. For persistent cases, check your Cloudflare logs for repeated bot classifications from the same IP range.

    Final Thoughts and Next Steps

    Cloudflare’s Captcha serves as a critical line of defense against bots and automated threats, although it’s not without its quirks. While Captcha challenges can sometimes be a source of frustration, they play a vital role in maintaining the integrity and security of online services. If you find yourself battling Captcha failures, remember to:

    • Lower Security Settings: High security settings are great, but they can sometimes be overzealous. If you’re facing persistent Captcha challenges, consider temporarily dialing back your security settings.
    • Incognito Mode: This mode isn’t just for private browsing – it can also help bypass troublesome browser settings that might be interfering with Captcha.
    • Check for IP Ban: Too many failed attempts can lead to a temporary IP ban. If you suspect this is the case, then consider restarting your router and trying again after a few hours.
    • Use a Different Device: Device-specific issues can cause unexpected Captcha failures. Switching devices can be a quick fix.

    Managing server security, SSL, and configuration doesn’t need to be time-consuming.

    RunCloud simplifies everything, from automatic configuration and PHP management to real-time monitoring and SSL setup, all from one intuitive dashboard.

    Start your free RunCloud trial today and manage your Cloudflare-protected sites with confidence.

    FAQs About Cloudflare Captcha Failure

    Is Cloudflare Turnstile better than CAPTCHA?

    Cloudflare Turnstile is a user-friendly, privacy-preserving alternative to traditional Captchas. It automatically blocks bot traffic using a suite of non-intrusive browser challenges based on telemetry and client behavior. As a result, many find it to be a better option due to its less intrusive nature and privacy considerations.

    Does Cloudflare use Google CAPTCHA?

    Cloudflare previously used Google’s reCAPTCHA service, but now it has developed its own CAPTCHA alternative, Turnstile, to address privacy concerns and provide more flexibility.

    Are CAPTCHA systems outdated for spam protection?

    While CAPTCHAs are still commonly used, their effectiveness against spam and automated threats has been questioned. Advanced bots have found ways to bypass CAPTCHAs, and alternatives such as Cloudflare’s Turnstile are emerging as more effective solutions.

    Is Cloudflare Turnstile CAPTCHA Free?

    Yes, Cloudflare Turnstile is a free service that aims to deliver frustration-free web experiences and confirms visitors are real without the data privacy concerns or the need for users to solve puzzles.

    How can I prevent my own team from being challenged by Cloudflare during development and testing?

    The best practice is to use IP Access Rules in the Cloudflare dashboard under Security > WAF > Tools. By adding your office’s or team members’ static IP addresses to the “Allow” list, you can ensure they bypass Cloudflare’s security checks entirely. This is the most reliable way to prevent trusted traffic from being challenged.

    My Turnstile widget appears correctly on the frontend, but my server-side verification keeps failing. What should I check?

    This issue almost always points to one of two problems. First, double-check that you are using your secret key for the server-side API call, as mistakenly using the public sitekey here is a common error. Second, ensure that your server’s firewall allows outgoing HTTPS requests to Cloudflare’s API endpoint.

    Will adding Cloudflare Turnstile negatively impact my site’s Core Web Vitals?

    No, Turnstile is specifically designed to be lightweight and performance-friendly. Unlike traditional CAPTCHA, which can be render-blocking, Turnstile runs non-intrusive JavaScript challenges that have a minimal impact on metrics like Largest Contentful Paint (LCP) and First Input Delay (FID). It is a much better choice for performance-conscious developers than older, more disruptive challenge systems.

  • How to Install and Deploy Bagisto (Laravel eCommerce)

    How to Install and Deploy Bagisto (Laravel eCommerce)

    Launching an e-commerce store can seem complex, especially when dealing with server configurations and deployment complexities. But what if you could deploy a feature-rich, Laravel-based eCommerce platform in just a few simple steps?

    In this guide, we’ll show you exactly how to install Bagisto, a leading open-source eCommerce solution, using the power and simplicity of the RunCloud server management panel.

    In this tutorial, we will provide a complete, step-by-step walkthrough designed for users with limited knowledge of Linux CLI. You will learn how to set up your server environment, deploy the Bagisto application, connect your database, and perform the final installation, all with the help of RunCloud’s intuitive dashboard.

    Let’s get your online store up and running!

    What is Bagisto and Why Should You Use It?

    Bagisto is a powerful, open-source eCommerce platform built on top of Laravel. It provides a complete solution for businesses looking to create and manage an online store.

    If you’re already familiar with Laravel, then you should definitely try out Bagisto as it extends Laravel’s built-in features, elegant syntax, and extensive ecosystem. This means developers don’t have to build an eCommerce system from scratch; instead, they can use Bagisto’s pre-built modules and extend its functionality using familiar Laravel patterns, which can significantly speed up the development process.

    Bagisto dashboard

    Key Features of Bagisto:

    • Multi-Source Inventory: Manage your stock across multiple locations and channels from a single platform.
    • Multi-Currency and Locale: Easily configure your store to support different currencies, languages, and regional taxes to sell to a global audience.
    • Access Control Level (ACL): Implement a role-based permission system to control what your team members can access and manage within the admin panel.
    • Built-in Payment Integrations: Bagisto supports popular payment gateways, making it simple to start securely accepting payments.
    • Advanced Reporting: Gain insights into your sales, customers, and products with detailed reports and analytics.

    Step-by-Step Guide for Installing Bagisto via RunCloud

    RunCloud is a powerful server management panel that makes deploying and managing web applications like Bagisto incredibly straightforward. By handling the complex server configuration, it allows you to focus on building your application.

    Follow the steps below to get your Bagisto store up and running with RunCloud.

    Step 1: Create a New Database and Database User

    First, your application needs a database to store all its information, such as products, orders, and customer details. Log in to your RunCloud dashboard and navigate to the “Databases” tab on your server.

    Here, you will first create a database user by clicking “Add New Database User“.

    Once you have created the user, make sure you’re in the Database tab and click “Add New Database”. Give your database a name, and from the dropdown menu, select the user you just created to grant it access.

    Step 2: Create a New Web Application

    Next, you need to set up the web application environment where your Bagisto files will be stored. In your RunCloud dashboard, go to the “Web Applications” section and click “Create Web Application“.

    Switch to the “Empty Web App” tab and fill in the basic details for your application.

    You will need to configure a few settings here to ensure Bagisto runs correctly:

    • Enter your domain name
    • Configure SSL
    • Select your application owner
    • Choose PHP version 8.2 (this is the recommended version for Bagisto at the time of writing).

    Finally, under “Web Application Settings“, change the Public Path from its default to /public, which is the standard directory structure for Laravel applications.

    Once you have made the necessary changes, you can deploy the application on your server.

    Step 3: Connect the Database

    After you create the web application, you need to connect the database you created in the first step.

    Go to your new web application in the RunCloud dashboard and find the “Settings” tab on the left-hand menu.

    On this page, you can select your Bagisto database and user from the dropdown menus to attach them to the application. This step ensures that when RunCloud performs a backup of your application, it will include both the files and the connected database in a single backup file.

    Step 4: Connect to Your Server via SSH and Prepare the Directory

    Now it’s time to connect to your server to install Bagisto itself. If you are not sure how to do this, then you can follow our previous guide, which explains how to use an SSH client like Terminal (on macOS/Linux) or PuTTY (on Windows), to log in.

    Once connected, you need to navigate to your application’s root directory using the following command, replacing <root path> with the root path of your application, which is displayed in the RunCloud dashboard:

    cd <root path>

    When RunCloud creates a new application, it places a default public folder with an index.html file inside. Since Bagisto’s installation process will create its own public folder, you must first delete the existing one. You can do this by running the following command in your terminal:

    rm -rf public

    Step 5: Install Bagisto with Composer

    You can now install Bagisto using Composer. Execute the following command in your application’s root directory to download and install all the necessary Bagisto files. The . at the end of the command tells Composer to install the files in the current directory:

    composer create-project bagisto/bagisto .

    Step 6: Initialize the Bagisto Application

    After Composer has finished downloading the files, you need to run the Bagisto installation script. This script will set up your database tables, create your administrator account, and configure other essential settings for your store. To start this process, run the following command in your terminal:

    php artisan bagisto:install

    The installer will prompt you to enter several details:

    • Your database name
    • Username
    • Password (which you created in Step 1)
    • Your desired admin email and password

    Once you have filled in all the information, the installation will complete, and you will see a message confirming its success, along with your admin login URL.

    Note: If you are using a Dockerized server on RunCloud, you will need to use the host value (instead of localhost) in your database configuration. To learn more about this, refer to the documentation on Networking in a RunCloud Containerized Server.

    Step 7: Log In and Start Building Your Store

    Congratulations, your Bagisto store is now installed! You can now access the admin panel by navigating to your domain, followed by /admin (e.g., http://runcloud-demo.com/admin). Use the credentials you set up during the installation process to log in and begin adding products, configuring settings, and customizing your new eCommerce store.

    Step 8: Optimize Your Application Type in RunCloud

    To make managing your new Bagisto store even easier, there is one final step you can take within the RunCloud dashboard.

    Navigate to your web application’s “Settings” page and change the “Application Type” from “General” to “Laravel.” This change unlocks a suite of powerful, Laravel-specific features in your RunCloud dashboard.

    You will see new menu items that allow you to run Artisan commands, manage scheduled tasks (cron jobs), and configure message queues directly from the web interface, without ever needing to log in via SSH for these routine tasks. This feature is one of the many ways RunCloud simplifies application management and maintenance.

    Step 9: Enable Backups and Harden Your Server for Production

    Now that your Bagisto store is running, the final and most critical steps are to secure your application by setting up automated backups and hardening your server’s security settings.

    RunCloud makes this incredibly simple; just navigate to the “Backup” section of your web application in the dashboard, choose your preferred cloud storage provider, and set a schedule.

    Once configured, RunCloud will automatically back up your application files and the connected database, giving you complete peace of mind.

    For securing the server, we recommend reading the following resources:

    Wrapping Up

    And there you have it! In just a few steps, you have successfully deployed a powerful, production-ready Bagisto eCommerce store. You can now log in, start adding your products, and customize your storefront to match your brand.

    Throughout this process, you’ve seen firsthand how RunCloud streamlines what can often be a complex and time-consuming task. From creating databases and managing application settings with a few clicks to providing powerful, application-aware features, RunCloud handles the heavy lifting of server management so you can focus on what truly matters: building your online business.

    While this tutorial focused on Bagisto, a Laravel-based application, RunCloud’s power and flexibility extend far beyond a single framework. Whether you’re looking to host a modern blog using Ghost, set up your own private cloud with Nextcloud, or deploy a custom application built with Next.js, our platform is designed to make it simple and efficient. We encourage you to explore our other guides to see just how versatile RunCloud is.

    Ready to simplify your server management?

    Sign up for RunCloud today.

  • How to Fix the “SSL_ERROR_RX_RECORD_TOO_LONG” Error in Firefox

    How to Fix the “SSL_ERROR_RX_RECORD_TOO_LONG” Error in Firefox

    Seeing the SSL_ERROR_RX_RECORD_TOO_LONG message in Firefox?

    This error usually means your browser or server isn’t handling HTTPS traffic correctly – often due to a simple configuration issue.

    This guide explains what causes the error and how to fix it, whether you’re a site visitor or a server administrator.

    What the SSL_ERROR_RX_RECORD_TOO_LONG Error Means

    When you use Firefox to browse the web, you might occasionally see the error message “SSL_ERROR_RX_RECORD_TOO_LONG”. While the name sounds complicated, the reason behind it is usually quite simple.

    Firefox shows this error when it tries to load a secure (HTTPS) page but receives an unencrypted or invalid response instead. In most cases, the site’s SSL configuration is incorrect, or it’s using outdated security protocols.

    This error can be caused by multiple issues. Let’s break down the common causes:

    Common Server-Side Causes of the Error

    In most situations, the problem isn’t with your computer or browser but with how the website you’re trying to visit is set up.

    • Incorrect port configuration: Firefox connects to HTTPS sites through port 443. If the server handles plain HTTP traffic on this port, Firefox will stop the connection and show this error.
    • Outdated security protocols: Servers still using old SSL or TLS versions (1.0 or 1.1) can’t complete the handshake with modern browsers.
    • Certificate problems: Expired, misconfigured, or mismatched certificates prevent Firefox from validating the site’s identity.

    Common Browser or Client-Side Causes

    Although it is less common, this error can also be caused by the settings on your own computer or within Firefox.

    • Cached data: Outdated cookies or cache files can confuse Firefox when a site’s security settings change.
    • Proxy settings: Incorrect proxy configuration (especially on corporate networks) can block HTTPS connections.
    • Extensions: Overactive security or ad-blocker add-ons may interfere with the TLS handshake.

    Suggesed read: How to Fix err_ssl_protocol Error

    How to Fix the SSL_ERROR_RX_RECORD_TOO_LONG Error

    We now know what causes the SSL_ERROR_RX_RECORD_TOO_LONG error. Let’s see how to fix this quickly and easily:

    Clear Your Browser’s Cookies and Cache

    As we explained above, sometimes browsers try to connect using outdated information, which can cause errors. To fix this, we will simply clear and delete all the cookies and cache for that particular site. This forces Firefox to download a fresh, correct copy of the website.

    1. Clear cache and cookies: Go to Settings → Privacy & Security → Clear Data, select both checkboxes, and confirm. Then restart Firefox and reload the page.

    2. Check proxy settings: Go to Settings → General → Network Settings → Settings…. Choose No proxy, unless you’re on a network that requires one.

    3. Disable extensions: Restart Firefox in Troubleshoot Mode. If the site loads, re-enable your add-ons one at a time to find the culprit.

    4. Update Firefox: Go to Help → About Firefox to install the latest version.

    Check Your Proxy Settings

    Most home internet users connect directly to the web. However, some users on a company or school network use a “proxy server”. This proxy server intercepts all the traffic coming into the network, which can cause errors on the site. If you are using a proxy server, make sure it is configured correctly on your computer:

    1. Go to the Settings menu again (click the three lines in the top-right).
    2. On the General tab, scroll to the bottom to “Network Settings” and click the Settings… button.
    1. This will open a new window. The correct setting for most home users is “No proxy“. If it’s set to something else, change it to “No proxy” and click OK.

    Note: If you are on a corporate or school network, you may need a proxy. If changing this setting breaks your internet connection, revert it and check with your IT department.

    Temporarily Disable Your Browser Add-ons

    As we discussed above, some browser extensions interfere with network connections, and you can fix this by simply disabling the problematic extension.

    1. The fastest way to do this is by restarting Firefox in Troubleshoot Mode (previously called Safe Mode). This temporarily disables all your add-ons.
    2. Click the three-line menu, go to Help, and then select Troubleshoot Mode….
    3. Click Restart.

    Once Firefox restarts, try visiting the website again. If it works now, you know an add-on is the problem! You can then follow the steps below to find out which one.

    1. Go to the menu and select Add-ons and Themes (or press Ctrl+Shift+A).
    2. Click on Extensions.
    3. Disable your extensions one by one using the blue toggle switch, reloading the problem website after each one. When the site finally loads correctly, you’ll find the extension causing the issue.

    Update Your Browser

    The world of internet security is constantly evolving. Every few years, new security protocols (the “rules” for the handshake) are released, and old ones are retired. An outdated browser might not know the latest, most secure handshake that modern websites use to communicate on the Internet. Making sure Firefox is up-to-date ensures it has all the modern tools it needs to connect securely.

    1. Click the three-line menu and go to Help.
    2. Select About Firefox.
    3. A small window will pop up and automatically check for updates. If an update is available, it will download and install it for you.

    If none of the browser fixes worked, the issue is almost certainly on the server. Here’s how to diagnose and correct it as a developer.

    How Developers and Admins Can Fix the Error

    If you are a website administrator, then you are in the best position to resolve the “SSL_ERROR_RX_RECORD_TOO_LONG” error for your website. This error is almost always a sign of a server-side misconfiguration, where the server sends an unexpected response during the initial TLS handshake. The following detailed checks will help you diagnose and fix the underlying issue.

    Use an Online SSL/TLS Diagnostic Tool

    Before you spend too much time manually combing through configuration files, you should use an external tool to give you a detailed report. These services test your server from the perspective of an external client and can pinpoint subtle misconfigurations that are easy to miss.

    You can use a service like Qualys SSL Labs’ SSL Test or DigiCert SSL Installation Diagnostics Tool to perform a deep analysis of your entire SSL/TLS setup. It will grade your configuration and provide a detailed report on protocol support, key exchange, cipher strength, and certificate chain issues.

    The report will explicitly flag common problems such as an incomplete certificate chain (“Chain issues: Incomplete”), support for insecure protocols, or weak cipher suites. This provides an actionable checklist of items to fix within your server’s configuration files.

    Verify Your Server’s Port and Protocol Configuration

    This is the most frequent cause of the error.

    Verify Port and Protocol Settings

    • NGINX: Add listen 443 ssl; to your configuration block.
    • Apache: Use <VirtualHost _default_:443> and ensure SSLEngine on is enabled with valid certificate file paths.

    Check Certificate Installation

    • Install both your main certificate and the intermediate chain from your CA.
    • Confirm the certificate’s CN or SAN matches your domain.
    • Renew any expired certificates.

    Update TLS and Cipher Settings

    • Enable TLS 1.2 and 1.3 only.
    • Disable older protocols (TLS 1.0, 1.1, SSLv2, SSLv3).
    • In RunCloud, select your preferred TLS version from the dropdown menu in the TLS settings.

    Audit the SSL Certificate Installation and Validity

    A faulty SSL certificate setup can prevent the TLS handshake from even beginning properly. The browser needs to validate a complete and correct certificate “chain of trust” to proceed. Any break in this chain or mismatch in information will cause connection failures.

    • Check for Correct Installation: Ensure that you have installed not just the primary domain certificate but also the necessary intermediate certificates provided by your Certificate Authority (CA). A missing intermediate certificate breaks the chain of trust, and while some browsers can fetch them, it is not reliable behavior.
    • Verify Domain Name Matching: The certificate’s Common Name (CN) or, more modernly, a name in the Subject Alternative Name (SAN) field must exactly match the domain the user is accessing. A certificate issued for www.example.com will not be valid for example.com unless both are listed in the SAN.
    • Confirm Expiration: While usually leading to a different error, an expired certificate can sometimes contribute to configuration issues that manifest as this error. Always confirm your certificate is within its validity period.

    Update and Strengthen Your TLS Version and Cipher Suites

    Modern browsers, including Firefox, have deprecated older, insecure versions of the TLS protocol (specifically TLS 1.0 and 1.1). If your server is configured only to support these outdated versions, Firefox will refuse to connect, which can sometimes result in this specific error. You must ensure your server is configured to negotiate a modern, secure protocol.

    • Enable Modern Protocols: Your server configuration should be set to enable TLS 1.2 and TLS 1.3, the current industry standards for security.
    • Disable Obsolete Protocols: Explicitly disable support for TLS 1.0, TLS 1.1, and all versions of SSL (SSLv2, SSLv3). This not only resolves compatibility issues but is also the best security practice to protect against known vulnerabilities.

    If you are using RunCloud, you can do this very easily by selecting the right value from a dropdown menu in your TLS certificate settings.

    Simplifying SSL Management with RunCloud

    Configuring SSL manually can be slow and error-prone.

    RunCloud simplifies it with one-click SSL setup, automatic renewals, and a staging environment for safe testing, helping you avoid common issues like this Firefox error.

    One-Click SSL Certificates with Auto-Renewal

    RunCloud offers a seamless integration with Let’s Encrypt, a free and trusted certificate authority. With RunCloud, you can:

    • Install SSL with a Single Click: Secure your websites with a valid SSL/TLS certificate in seconds, directly from your RunCloud dashboard.
    • Automated Renewals: RunCloud automatically handles the renewal of your Let’s Encrypt certificates, ensuring your sites remain secure without any manual intervention. This eliminates the risk of expired certificates causing errors.

    Making changes directly to a live server can be risky and can inadvertently lead to configuration errors. RunCloud’s staging environment provides a safe sandbox to test any modifications before deploying them to your production site.

    Once you’ve verified that your changes are working correctly in the staging environment, you can easily sync them with your live site.

    Final Thoughts: Simplify SSL Management

    Managing SSL manually can take hours – and a single misstep can break your site.

    With RunCloud, you can deploy, renew, and manage SSL certificates in seconds through an intuitive dashboard.

    Start your free RunCloud trial today and secure your sites the easy way.

    FAQs

    What causes the “SSL_ERROR_RX_RECORD_TOO_LONG” error in Firefox?

    This error almost always signals a misconfiguration on the web server. It happens when Firefox expects a secure (HTTPS) response but receives unencrypted data, often because the server isn’t correctly configured to handle SSL/TLS traffic on the proper port (443). Other causes include an improperly installed SSL certificate or the use of outdated and insecure TLS protocols by the server.

    Is the “SSL_ERROR_RX_RECORD_TOO_LONG” error my fault or the website’s?

    In the vast majority of cases, this error originates from the website’s server, not your browser or computer. While clearing your browser’s cache or checking proxy settings can sometimes help, the fundamental problem usually needs to be fixed by the website’s developer or administrator.

    Why does the website work in other browsers but not in Firefox?

    Firefox is often more stringent and particular about its enforcement of SSL/TLS protocols and security standards. While other browsers might be more lenient with minor server misconfigurations, Firefox’s strict security posture will flag these issues, resulting in the “SSL_ERROR_RX_RECORD_TOO_LONG” error. This means the underlying server issue still exists, even if other browsers don’t display an error.

    How can I fix the “SSL_ERROR_RX_RECORD_TOO_LONG” error as a website visitor?

    As a visitor, your troubleshooting options are limited to your own browser. The most effective steps are to clear your Firefox cache and cookies, disable any proxy settings, and temporarily disable browser extensions to rule out any local conflicts. If the error persists after these steps, the issue must be resolved by the website owner.

    As a developer, what is the most common fix for this error?

    The most frequent cause and fix for developers is an incorrect port configuration on the web server. You must ensure your server is explicitly configured to listen for secure traffic on port 443 (e.g., listen 443 ssl; in NGINX). Verifying that your SSL certificate is correctly installed and valid and that you are using modern TLS versions (TLS 1.2 or 1.3) will resolve most other instances of this error.

    Is it safe to bypass this error by changing my browser’s security settings?

    No, it is highly discouraged to lower your browser’s security settings, such as forcing it to accept an outdated TLS version, to bypass this error. Doing so can expose your browsing activity to security vulnerabilities and defeat the purpose of a secure connection. The error is a warning that the site’s security is not properly configured, and the website’s administrator is responsible for the fix.

    How can RunCloud help prevent this error?

    RunCloud helps prevent this error by simplifying and automating server and SSL management. With features like one-click SSL certificate installation and automatic renewals, RunCloud ensures your certificates are always valid and correctly configured, eliminating a common cause of the error. Furthermore, its easy-to-use dashboard and staging environments allow you to test server changes safely, reducing the risk of misconfigurations that could lead to SSL issues on your live site.

  • The 5 Best UptimeRobot Alternatives for Website Monitoring

    The 5 Best UptimeRobot Alternatives for Website Monitoring

    If your website goes down, every second counts. Uptime monitoring tools alert you before visitors or customers notice.

    Uptime Robot has been the go-to option for years, but its limits and pricing have pushed many users to look elsewhere.

    Here are five reliable, free Uptime Robot alternatives worth considering in 2025 – from simple hosted options to powerful open-source tools you can run yourself.

    Let’s get started!

    What Website Uptime Monitoring Actually Does (and Why It Matters)

    Website Uptime Monitoring is the process of continuously testing a website or web service to ensure it is online and accessible to end-users. It is a specialized service that uses a global network of servers to send requests to your website, API, or server to check for a valid response.

    If an error is found, it immediately triggers an alert to notify you via channels like email, SMS, or Slack so you can resolve the issue before it significantly impacts your users and business.

    In addition to simple “up” or “down” checks, modern monitoring tools also track performance metrics like response time, verify SSL certificates, and check for specific keywords on a page to confirm everything is functioning correctly.

    Suggested read: How to Check Running Processes in Linux Using ps, top, htop, and atop Commands

    Key Features to Look for in Uptime Monitoring Tools

    When choosing an uptime monitoring tool, focus on features that ensure accuracy and fast alerts:

    • Frequent checks: Every 1–5 minutes from multiple global locations.
    • Smart alerts: Email, SMS, Slack, or Discord integrations.
    • Public status pages: Communicate incidents and maintenance clearly.
    • Multiple check types: HTTP/S, Ping, TCP, and SSL monitoring.
    • Extra insights: Response time, incident logs, and uptime reports.

    Suggested read: How To Install New Relic Monitoring on RunCloud

    Top 5 Free Uptime Robot Alternatives for 2025

    Here are the best free alternatives to Uptime Robot, each offering a powerful feature set for keeping your services online.

    1. Uptime Kuma (Self-Hosted, Free)

    Uptime Kuma is a self-hosted, open-source uptime monitor with a clean interface and advanced features. You can create unlimited monitors and set check intervals as short as 20 seconds. Because it runs on your own server, you control performance, data, and reliability.

    It supports a wide range of monitor types, from standard HTTP(s) and TCP ports to DNS records and Docker containers. It integrates with over 90 notification services to ensure you never miss an alert. Its highly customizable status pages allow you to present a professional and transparent view of your service health to users.

    If you want maximum control and reliability, self-hosting Uptime Kuma on a Virtual Private Server (VPS) with a management panel like RunCloud is the ideal setup. Hosting on a RunCloud-managed VPS gives you full server control, ensuring more reliable uptime than on shared hosting, where “noisy neighbors” can drain resources and impact performance.

    Suggested read: How UptimeRobot Can Save Your Website from Downtime Disasters

    2. Pulsetic

    Pulsetic is a fantastic managed monitoring service with a user-friendly interface and a surprisingly generous free-forever plan. It’s an excellent choice for startups, developers, and small businesses that want a powerful tool without the need for self-hosting. The free plan includes 10 monitors, SSL certificate monitoring, and unlimited, customizable status pages that can even be mapped to a custom domain (this feature is often reserved for paid tiers in other services).

    The status pages are beautifully designed and can be translated into any language, which makes it easy to keep a global user base informed. Alerts can be configured for email, Slack, Telegram, and other channels, ensuring your team is notified promptly. Advanced users would like to know that Pulsetic offers insightful performance reports and the ability to customize request headers, which makes it a scalable solution that can grow with your project.

    Suggested read: How To Monitor Your Web App’s RAM & CPU Usage with Netdata

    3. HetrixTools

    HetrixTools offers one of the most feature-rich free uptime monitoring plans out there. Its free-forever plan includes 15 uptime monitors with a rapid 1-minute check frequency from 4 global locations, which helps ensure outage detections are accurate and not just a regional network glitch. This plan also provides a public status page to maintain transparency with your customers and even includes a server resource monitor to help you prevent outages before they happen.

    In addition to simple uptime checks, HetrixTools provides valuable diagnostic tools during an outage and performs necessary actions such as collecting ping and MTR samples to help you debug the issue faster. The platform also monitors domain and SSL certificate expiration and sends warnings to prevent unexpected downtime caused by administrative oversights.

    Suggested read: 7 Best Control Panels for VPS Management (Free & Paid)

    4. Monika (Open Source, Free)

    Monika is a command-line uptime monitor designed for developers who like configuration-as-code. It uses a simple YAML setup and supports automated checks for downtime and slow responses – ideal for CI/CD pipelines or scheduled synthetic tests.

    Like Uptime Kuma, Monika is self-hosted and gives you complete control over your monitoring environment. And you can host it on a VPS managed by RunCloud, which ensures that your monitoring is consistent and reliable.

    Additionally, the RunCloud platform simplifies server management with features like Auto-healing, which can automatically apply updates or restart server services, reducing downtime caused by human error or delays. This automated server management, combined with Monika’s powerful configuration, creates a highly resilient and developer-centric monitoring system.

    Suggested read: Uptime Monitoring Tools: Why You Need Them, and What to Look for

    5. Hyperping

    Hyperping is a premium-feeling monitoring service that offers a sleek user interface, fast alerting, and beautifully designed status pages. While its free plan is not as extensive as some of the other services discussed in this article, it still provides access to advanced features that showcase its power, including synthetic monitoring and checks from several global regions.

    Hyperping is designed for teams that prioritize incident communication and a polished user experience. It offers features like status page subscriptions, multi-language support, and smart on-call scheduling.

    It integrates with popular communication platforms like Slack, Microsoft Teams, Google Chat, Discord, and Telegram for instant alerts. It also supports PagerDuty, OpsGenie, Intercom, Webhooks, and traditional phone and SMS notifications for comprehensive incident management and communication.

    Suggested read: 8 Best GTmetrix Alternatives for Website Performance Testing (Includes Free)

    From Monitoring to Full Uptime Management

    In this post, we’ve highlighted several powerful tools for tracking websites and applications. In addition to the tools we discussed, there are many other excellent solutions available.

    Monitoring tells you when your site is down – but prevention keeps it online.

    The best results come from combining smart monitoring tools with a well-managed, high-performance server environment. This is where a comprehensive server management platform becomes indispensable.

    Why RunCloud is the Central Hub for Reliable Uptime

    While external monitoring tools tell you when you’re down, RunCloud helps you understand why and actively works to prevent it from happening in the first place.

    • Integrated Server Health Monitoring: At its core, RunCloud provides built-in server monitoring that gives you a real-time view into critical health metrics. By tracking CPU, RAM, and disk usage, you can move beyond simple “up” or “down” alerts to analyze the root causes of performance degradation and potential downtime. This insight allows you to optimize your server resources effectively, ensuring high availability.
    • Automated Healing for Proactive Stability: One of RunCloud’s most powerful features is its automated healing service. Instead of waiting for a critical alert and manually intervening, RunCloud can be configured to automatically restart essential services if they fail, providing a self-healing infrastructure that minimizes downtime without human intervention.

    RunCloud gives you more than uptime alerts – it keeps your servers healthy, fast, and self-healing.

    Start your free RunCloud trial today and experience how much uptime improves when your infrastructure manages itself.

    FAQs on Free Uptime Robot Alternatives

    What is the best free uptime tool?

    Uptime Kuma is widely considered the best free uptime tool if you can host it yourself. It offers unlimited monitors and is completely open-source. If you want a managed service that requires no setup, then you can consider Better Uptime.

    How does Uptime Kuma work?

    Uptime Kuma works by periodically sending requests to your defined services, such as websites (HTTP/S), ports (TCP), or DNS records, to check their status. If a check fails to receive the expected response within a set time, it triggers a notification through one of its many integrated channels, like Slack or Telegram.

    Is there a good self‑hosted monitor?

    Yes, Uptime Kuma is an excellent and incredibly popular self-hosted uptime monitor that is both feature-rich and easy to deploy using Docker. It provides a modern user interface and extensive notification options without any subscription fees or limitations on the number of monitors.

    What is the cheapest Pingdom alternative?

    The cheapest Pingdom alternative is a free, self-hosted solution like Uptime Kuma, where your only cost is the minimal server resources to run it. If you prefer a managed SaaS product, Pulsetic’s generous free plan is a powerful and cost-effective alternative to Pingdom’s paid plans.

    What is the best open source uptime monitor?

    Uptime Kuma stands out as the best free open-source monitor for its quick setup, clean interface, and complete feature set. It delivers a polished, premium experience that competes with paid services, all while being completely free and community-driven.

    Are free uptime tools accurate enough?

    Yes, for the vast majority of use cases like websites, blogs, and APIs, free uptime tools are more than accurate enough for reliable monitoring. They typically use multiple global check locations to confirm downtime and prevent false positives, making them a dependable choice for most users.

  • How to Check Linux CPU Usage or Utilization (5 Ways)

    How to Check Linux CPU Usage or Utilization (5 Ways)

    Is your Linux server slowing down? CPU usage is often the reason.

    Monitoring CPU performance helps you spot issues early, prevent slowdowns, and optimize your server for smoother performance.

    This guide walks you through practical ways to check CPU usage in Linux – from essential commands like top and mpstat to visual monitoring with RunCloud.

    Let’s dive right in!

    What Causes High CPU Utilization?

    If you have been running your server for a long time, several services might be running on it. Short CPU spikes are normal during heavy tasks like database queries or backups.

    But constant high CPU usage usually means a deeper issue – such as inefficient code, unoptimized plugins, or too many concurrent PHP or Python processes.

    Poor caching and malware (like cryptominers) can also push CPU utilization to dangerous levels.

    Content management systems such as WordPress might also strain the CPU when plugins or themes are poorly coded or when caching isn’t properly implemented.

    Malicious activities can also significantly increase CPU usage. Cryptojacking malware, which hijacks system resources to mine cryptocurrency, is an increasingly common cause of high CPU utilization. Similarly, DDoS attacks or brute-force attempts can flood servers with requests, forcing the CPU to process an overwhelming amount of traffic.

    Sometimes, normal maintenance tasks can lead to temporary CPU spikes. Activities like system backups, virus scans, or package updates typically demand more processing power. However, scheduling these tasks during off-peak hours and properly configuring their resource usage can help minimize their impact on system performance.

    Detecting a Runaway Process in Linux

    Run top or htop and look for any process using nearly 100% CPU with a rapidly increasing TIME+ value.

    This is usually a runaway process. Stop it using its PID to free up system resources.For a runaway process, the TIME+ value will be unusually high and will increase rapidly, which indicates it is actively and continuously churning through CPU cycles without end. If you find a runaway process, then you can consider killing the process via CLI to free up system resources.

    Identifying a DoS Attack on Your Server

    If you get an abnormally high number of network connections, especially to your web ports (80 and 443), then it is a good indication that you are under attack. You can use some advanced commands like netstat -an | grep ESTABLISHED | wc -l to view a sudden and massive spike in connections.If you suspect that you are under attack, then you should go ahead and block unwanted traffic using Fail2Ban and consider implementing zero-trust logins for your applications.

    Suggested read: Best nine htop Alternatives for Linux, Mac & Windows in 2024

    How to Check High CPU Utilization on Linux?

    There are several ways to track CPU usage on your Linux system. Let’s look at a few of the most common methods.

    Method 1: Check CPU Usage with the ‘top’ Command

    The top command is one of the most fundamental and widely used tools for real-time system monitoring in Linux. It provides a dynamic view of system performance, showing processes sorted by CPU usage, memory consumption, and other resources. You can run it on your computer by executing the following command in your shell:

    top

    By default, the top updates every 3 seconds and displays essential information such as load averages, task statistics, and CPU states. Users can interact with the display using keyboard shortcuts, including ‘P’ to sort by CPU usage, ‘M’ for memory usage, and ‘k’ to kill processes directly from the interface.

    Suggested read: How to Check Running Processes in Linux Using ps, top, htop, and atop Commands

    Method 2: Monitor CPU Usage with the RunCloud Server Monitoring

    RunCloud has a built-in server monitoring functionality that provides a user-friendly, visual approach to tracking CPU utilization. You can view it by simply navigating to the “Monitoring” section of your server settings in the RunCloud dashboard.

    The dashboard displays historical CPU usage patterns through intuitive graphs, making it easier to identify trends and anomalies. You can also configure alerts for when CPU usage exceeds defined thresholds, and it provides detailed metrics about individual processes and system resources.

    Unlike command-line tools, RunCloud’s monitoring solution retains historical data and provides insights without requiring constant terminal access.

    In Linux systems, CPU load represents the average number of processes that are either currently executing or waiting for system resources (CPU, disk I/O, etc.) over a specific time period. Unlike CPU usage percentage, which shows immediate processor utilization, the load average gives you a broader view of system demand over time.

    A load average of 1.0 on a single-core system means the CPU is exactly at capacity, while on a quad-core system, a load of 4.0 would represent full capacity. When the load average exceeds the number of CPU cores, it indicates that processes are competing for resources and may need to wait their turn, potentially causing system slowdown.

    For example, if a quad-core system shows a load average of 8.0, it means the system is overloaded with twice as many processes as it can handle efficiently, leading to degraded performance.

    Suggested read: How to Find Most Used Disk Space Directories and Files in Linux

    Method 3: Monitor CPU Usage with the ‘mpstat’ Command

    The mpstat command is part of the sysstat package, and provides CPU statistics for each available processor. This tool is particularly valuable for multi-core systems as it shows per-processor utilization, including user time, system time, idle time, and I/O wait time. You can view your CPU usage statistics by running the following command:

    mpstat

    System administrators can use options like mpstat -P ALL 2 5 to display statistics for all processors, updating every 2 seconds for 5 iterations, helping identify potential CPU core imbalances.

    Suggested read: What are Linux Logs? What Are They & How To Use Them

    Method 4: Use the ‘sar’ Command to Check CPU Usage

    The System Activity Reporter (sar) command is a powerful tool for collecting, reporting, and storing system activity information. It can display historical CPU performance data and create detailed reports about system resource usage. The sar command can show CPU utilization data from the current day or from stored system activity files, which makes it invaluable for analyzing performance trends over time.

    You can execute the following command to see the CPU usage history on your computer:

    sar

    In the above example, we can see that each row provides a snapshot of the CPU utilization metrics in 10-minute increments. If you want to customize the output, then you can pass the appropriate flags as the input. For example, sar -u 2 5 shows CPU usage updated every 2 seconds for 5 iterations.

    Suggested read: Mastering the Echo Command in Linux (with Practical Examples)

    Method 5: Check CPU Usage with the ‘iostat’ Command

    The iostat command provides CPU statistics and input/output statistics for devices and partitions. While it is primarily known for I/O monitoring, it also offers CPU reporting capabilities, which include breakdowns of user time, system time, idle time, and I/O wait time.

    You can run the following command to view your CPU usage activity:

    iostat

    This command is particularly useful when investigating whether high CPU usage is related to disk I/O operations, and you can customize the output of this command according to your needs: options like iostat -c focus specifically on CPU statistics, while iostat -x provides extended statistics.

    Suggested read: Using Dynatrace to Monitor RunCloud Servers

    Method 6: Monitor CPU Usage with the ‘vmstat’ Command

    The Virtual Memory Statistics (vmstat) command offers a concise view of system performance, including CPU usage, memory, swap space, and I/O statistics. It’s especially useful for identifying bottlenecks affecting CPU performance, such as memory constraints or excessive swapping. You can use this command by executing the following code snippet in your terminal:

    vmstat

    You can also use some additional command-line arguments to modify its behavior. For example, running vmstat with a delay value (e.g., vmstat 2) provides continuous monitoring and shows how CPU usage changes over time. Its compact output format makes it ideal for quick system health checks and monitoring trends in real time.

    Suggested read: How To Monitor Your Web App’s RAM & CPU Usage with Netdata

    Wrapping Up

    Monitoring CPU usage helps you prevent slowdowns and keep your server running efficiently. While Linux commands like top and sar are powerful, RunCloud makes performance tracking easier with visual insights and automated alerts.

    While command-line tools are incredibly powerful for deep-dive, real-time diagnostics, they require you to be actively logged into the server via SSH. They don’t easily reveal trends over time or provide a simple “is everything okay?” status check.

    This is why RunCloud provides a Server Monitoring dashboard to get high-level oversight. RunCloud gives you a visual dashboard showing CPU, memory, and disk usage in one place.

    You can view historical data, identify spikes, and set alerts for high CPU usage – no SSH access required.

    On this screen, you can instantly assess the core vitals of your server:

    • Load: Immediately see your server’s current workload without needing to interpret the 1, 5, and 15-minute averages. 
    • Memory Usage: A simple percentage shows how much RAM is in use, letting you know if you’re approaching a memory bottleneck.
    • Disk Usage: Quickly check if you’re running out of storage space.
    • Top Processes: RunCloud automatically surfaces the most resource-intensive processes, and saves you the manual effort of scanning through the top command’s list to find the culprit behind a CPU spike.
    • Slow [Database] Queries: For web applications, this is a game-changer. RunCloud can pinpoint the exact database queries that are slowing down your entire site, a task that is notoriously difficult with standard CLI tools.
    • Automated Alerting: RunCloud can be configured to send you an alert via Slack, Telegram, or email the moment your CPU usage crosses a critical threshold (e.g., >80% for 5 minutes).

    Start your free RunCloud trial today and see your server’s performance at a glance – no command line required.

    FAQs on Linux CPU Usage

    How to check CPU power consumption in Linux?

    You can monitor CPU power consumption using tools like powertop or by reading from /sys/class/power_supply/ for battery-powered devices. For a quick check, installing and running turbostat will show detailed power and frequency statistics of your CPU.

    Why is my CPU 100% usage?

    High CPU usage typically occurs when resource-intensive processes like runaway scripts, malware, or poorly optimized applications consume excessive processing power. You can identify the culprit using top or htop commands to see which processes are consuming the most CPU resources.

    How to find CPU utilization in OS?

    The simplest way is to use the top command in the terminal, which shows real-time system statistics, including CPU usage per process. Alternatively, RunCloud’s monitoring dashboard provides an easy-to-read interface showing CPU usage trends over time.

    How do I check if my CPU is running properly?

    You can monitor CPU temperature using sensors command and check system logs (dmesg or /var/log/syslog) for any hardware-related errors or throttling messages. RunCloud’s monitoring can also alert you if CPU performance metrics deviate from normal patterns.
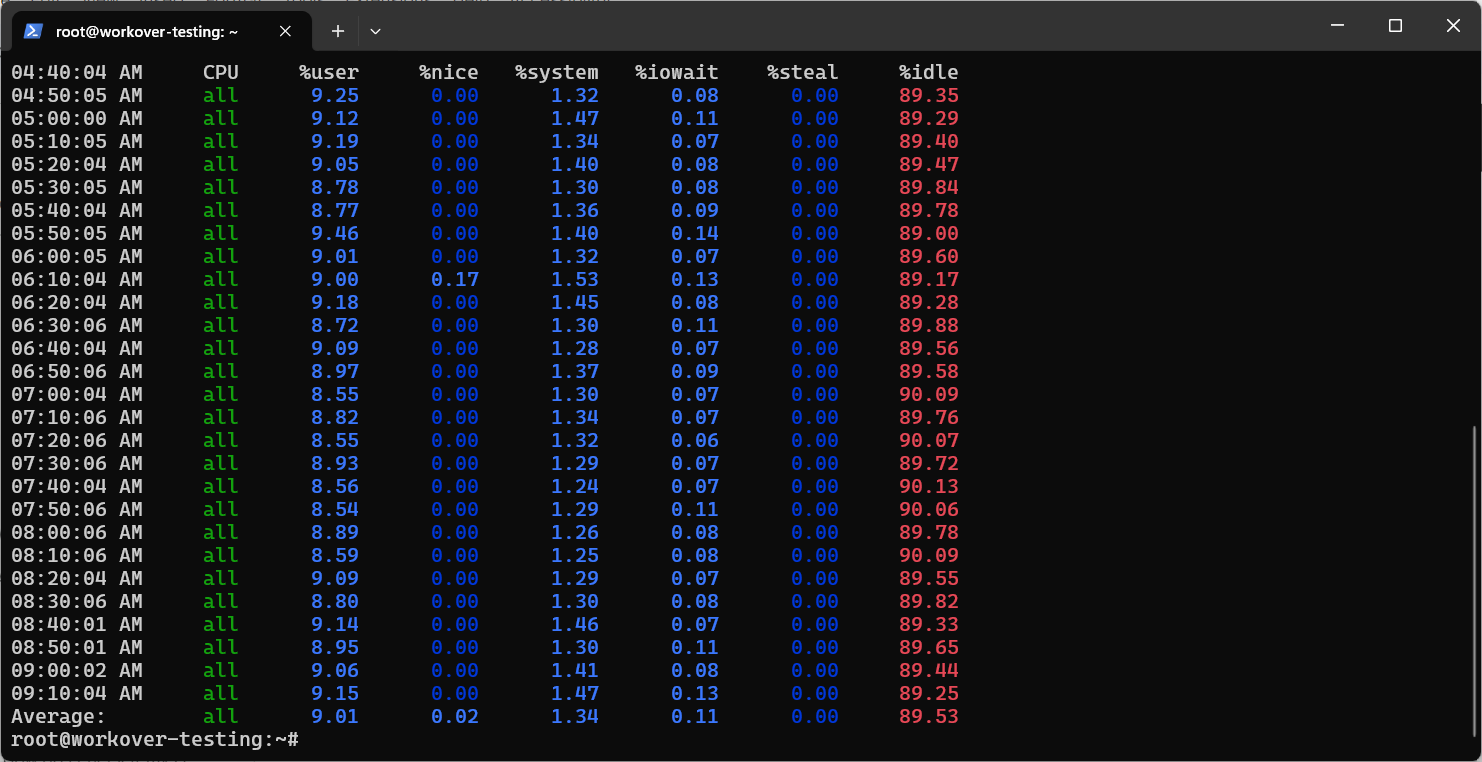
    How do I make sure my CPU is running at its best?

    Ensure your system is running the latest kernel version, has proper cooling, and uses tools like cpupower to manage CPU frequency scaling. Also, regularly update your BIOS and consider enabling performance mode in your CPU governor settings.

    How do I fix excessive CPU usage?

    First, identify the resource-hungry processes using top or RunCloud’s monitoring dashboard. Then, either optimize the application code, adjust configuration settings, or terminate unnecessary processes. If needed, consider implementing resource limits using groups.

    How to check how many CPU cores you have in Linux?

    You can quickly check your CPU cores by running nproc for logical core count or lscpu for detailed CPU architecture information, including physical and virtual cores. For a more detailed view, you can also read /proc/cpuinfo.

    How can I find out which specific process is causing high CPU usage?

    The quickest way to find the process is by using the top command or its more user-friendly alternative, htop, in your terminal. These tools display a live, sorted list of all running processes and automatically place the most resource-hungry ones at the very top. Simply look for the process with the highest number in the %CPU column to find the most resource hungry process.