Category: Tips & Tricks

  • How to Kill a Process in Linux From the Command Line

    How to Kill a Process in Linux From the Command Line

    Are you tired of unresponsive programs, resource-hogging applications, or rogue processes slowing your Linux system down? While knowing how to kill a process on Linux from the command line is a fundamental skill for any Linux user, the story doesn’t end with a simple kill command.

    What if you can’t find the process ID (PID)?

    What’s the difference between a “job” and a “process” – and how do you manage them?

    If you’ve ever found yourself searching for answers to these follow-up questions, you’re in the right place. This article will move past the basic ps aux | grep command and discuss more efficient tools like pgrep and pidof to find exactly what you’re looking for.

    We will learn how to manage foreground and background jobs – an essential skill for multitasking in the terminal.

    We’ll also tackle common points of confusion, such as the difference between jobs and processes, and how to find resource-hungry processes without relying on top.

    But before we kill processes, let’s first refresh our knowledge of what processes are!

    What is a Process in Linux?

    In Linux, a process is an instance of a running program. Each process has its own memory space, system resources, and a unique Process ID (PID) that the kernel assigns.

    Processes can be applications, system services, or background tasks essential for the operating system’s functionality.

    Suggested read: Introduction to Bash For Loops: A Beginner’s Guide

    What is Meant by Killing a Process in Linux?

    Killing a process in Linux means terminating or stopping a program forcefully. This action is often necessary when a process becomes unresponsive, consumes too many system resources, or needs to be stopped for maintenance or security reasons.

    Linux provides several methods to kill processes, ranging from graceful termination signals to forceful stops.

    When you kill a process, you’re essentially sending a signal to that process, instructing it to terminate. The most common signal used for this purpose is SIGTERM (signal 15), which allows the process to perform cleanup operations before exiting.

    In cases where a process doesn’t respond to SIGTERM, users can employ stronger signals such as SIGKILL (signal 9), which forces immediate termination without allowing for cleanup.

    Suggested read: How MailHog Can Transform Your Local Email Testing Process

    Reasons to Kill or Terminate a Process on Linux

    There are various scenarios where killing a process becomes necessary:

    • Unresponsive Applications: When a program freezes or becomes unresponsive, terminating it can free up system resources and allow for a restart.
    • Resource Management: Processes consuming excessive CPU or memory can be killed to maintain system stability and performance.
    • Security Concerns: Suspicious or potentially malicious processes should be terminated to prevent security breaches.
    • System Maintenance: During system updates or reconfigurations, certain processes may need to be stopped.
    • Debugging: Developers often need to terminate processes during software testing and debugging.
    • Freeing Up Ports: Killing a process can release network ports that are being held, allowing other applications to use them.
    • Clearing File Locks: Terminating a process can release file locks, enabling access to previously locked files or directories.
    • Stopping Runaway Processes: Accidental infinite loops or other programming errors can create runaway processes that need to be stopped.

    Suggested read: What is Docker and How Does it Work

    How to Find a Process ID in Linux

    Before you can stop a process, you need to find it, but multiple processes with similar names can run simultaneously. In Linux, every process running on your system has a unique Process ID (PID).

    While many users are already familiar with the ps aux | grep command, there are often faster and more precise tools for the job.

    Let’s explore the best ways to locate processes.

    Using the ps command in Linux

    The ps (process status) command gives you a snapshot of the currently running processes. It has many options, but a few combinations are incredibly useful.

    1. ps aux: This is one of the most common commands for tracking processes, as it shows all processes running for all users. You should use ps aux when you need to identify which user owns a process and how much CPU or memory it’s using.

      The ‘aux’ in this case comprises the following three parameters:
      • a = show processes for all users
      • u = display the process’s user/owner
      • x = also shows processes not attached to a terminal
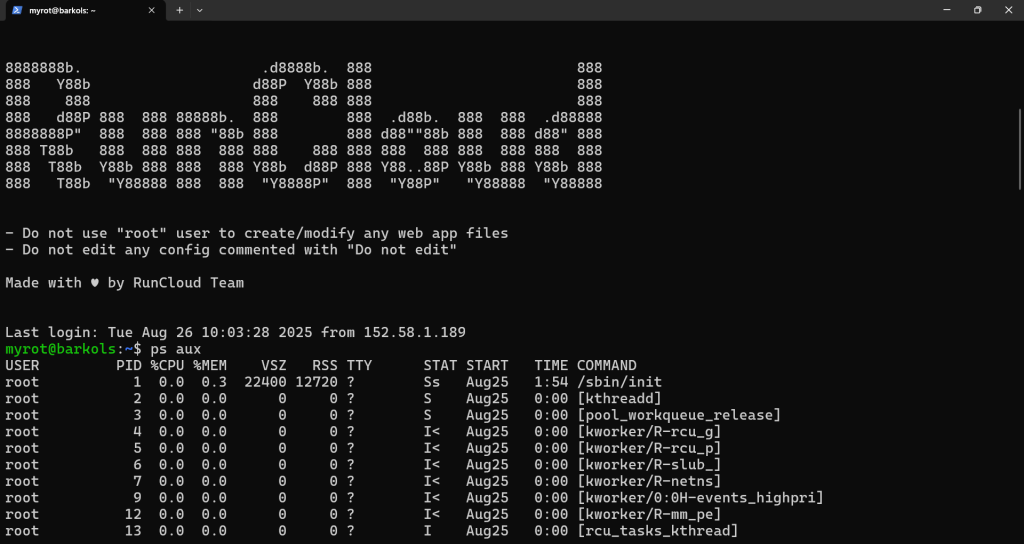
    Example: To find the process ID of the RunCloud agent, you could type:

    ps aux | grep runcloud

    The second column in the output is the PID you need. You’ll notice that the output presented here is quite complex because of the number of columns, and it can be hard to locate what you need.

    Let’s look at some of the better alternatives below, which provide us with the Process ID without any other complex information.

    1. ps -ef: This command is similar to ps aux and shows every process on the system in a different format. You should use this command if you also need to find a process’s Parent Process ID (PPID).
      • -e = select every process
      • -f = display full-format listing

    Example:

    ps -ef | grep runcloud

    This command returns cleaner output; the process ID is in the second column. However, some users might still find it hard to read. Let’s look at some of the better options below, which produce even simpler output in human-readable format.

    1. ps -C <process_name>: In the previous commands, the ps utility returned a very long list of processes, and we used a different tool (grep) to extract only what we needed and discard everything else. This command provides a much cleaner way to find a process by its name without needing grep.
      • -C = select by the command name

    Example:

    ps -C runcloud

    This will list only the processes named “runcloud” with a clean output showing the PID and how long this process has been running. This command displays the information in a presentable format that is easy to read. However, it can still be cumbersome to extract the process ID of a particular process in an automated manner.

    Using the pgrep Command in Linux

    The pgrep (process grep) command is a modern and efficient tool for finding PIDs. It’s faster and less cumbersome than piping ps to grep. If you want to learn more about Linux pipes, we recommend reading our recent blog post on pipes vs xargs.

    1. Basic pgrep: Simply type pgrep followed by the process name.
    pgrep runcloud

    This command will return only the PIDs of the sshd process, nothing more.

    1. pgrep -l: If you want to see the process name alongside the PID, then you can use the -l (list-name) option
    pgrep -l runcloud

    1. pgrep -u <username>: If you need to find all processes run by a specific user, you can use the -u (user) option.
    pgrep -l -u root
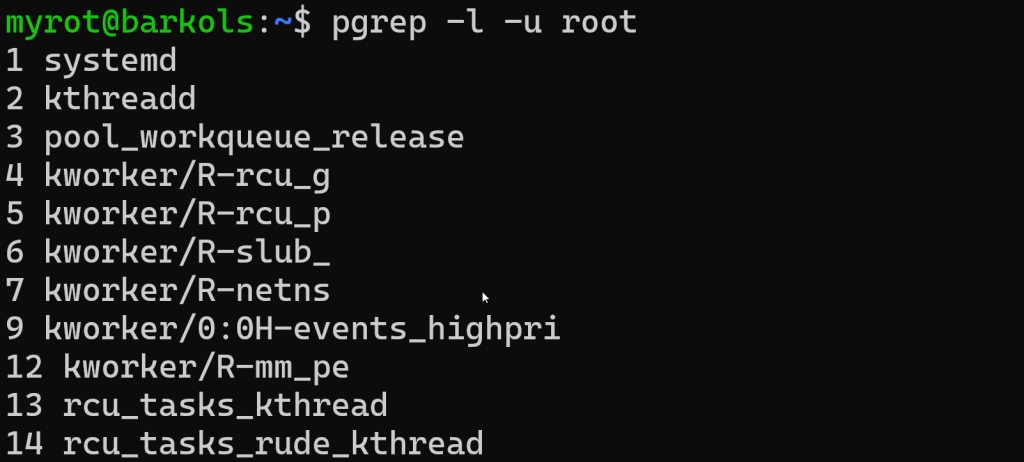
    This will list the PID and name of every process owned by the user “root.”

    Using the pidof Command in Linux

    All the commands we discussed have returned some extra information. If you just want to see the process ID and nothing else, you can use the pidof command with the process name. This command is simple, fast, and doesn’t require data processing to extract the necessary information. This makes it extremely easy to integrate into bash scripts.

    Example:

    pidof runcloud

    In the above example, if any process named ‘runcloud’ is running, this command will output its PID.

    Using the top Command to find the Process ID

    The top command provides a real-time, interactive view of your system’s running processes. Just type top to launch it, and you’ll see a constantly updated list of processes, sorted by CPU usage by default. The PID is in the first column, and the command is in the last column. Once you have found what you are looking for, press the ‘q’ key to exit.
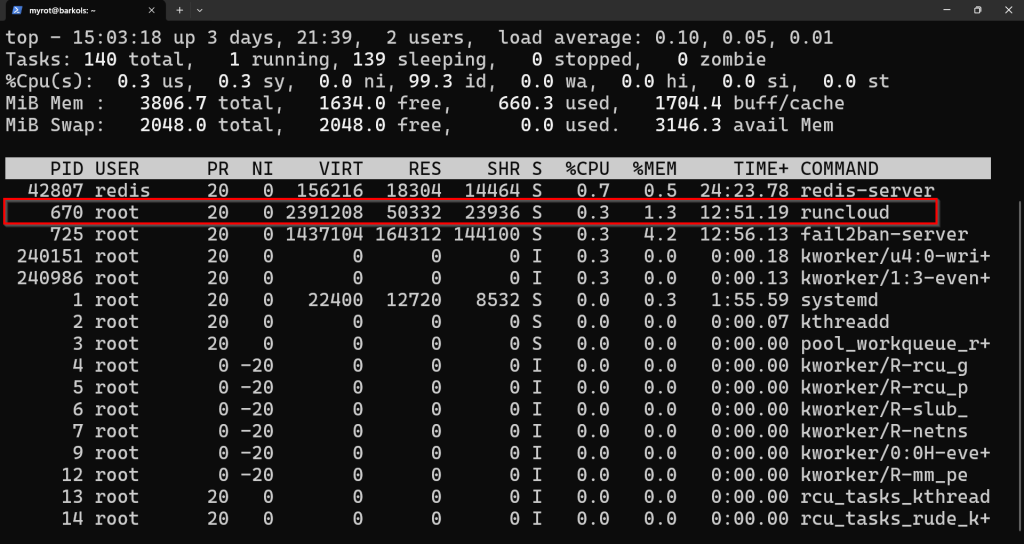
    The above example shows that the ‘runcloud’ process has the process ID 670.

    Managing Background and Foreground Tasks in Linux

    When you run a command in your terminal, it typically runs in the foreground. This means it occupies your terminal, and you must wait for it to finish before entering another command. But what if you need to run a time-consuming task and continue using your terminal?

    This can be done using the built-in job control functionality. A job is a wrapper around one or more processes, allowing you to manage them within your current terminal session.

    Sending a Job to the Background in Linux Shell

    You can start a process directly in the background by adding an ampersand (&) at the end of the command.

    Example: Let’s say you’re running a script that takes a long time.

    ./my-long-script.sh &

    The script will start, and the terminal will immediately return you to the command prompt. You’ll see output similar to [1] 12345, where [1] is the job ID and 12345 is the PID.

    The above example shows that the ls command was launched in the background and assigned the PID 241370.

    Viewing and Managing Jobs with jobs

    It is easy to forget once you have sent a job to the background. The jobs command lists all jobs associated with your current terminal session.

    jobs -l

    The -l option also shows the PID, which is very useful.

    The above example shows that the current terminal session has two jobs running in the background.

    Bringing Jobs to the Foreground and Background

    • fg (Foreground): If you need to interact with a background job again, you can bring it to the foreground with the fg command followed by its Job ID.
    fg %1

    This command brings job ID 1 back to the foreground and makes it the active process in your terminal.

    • bg (Background): If you’ve stopped a foreground process (using Ctrl+Z), you can send it to the background to continue running with bg.
    bg %1

    How to Kill a Process in Linux

    There are several ways to kill a process in Linux, but the first step is always to identify the process you want to kill. Once you identify the process, you can choose the following method based on your needs:

    How to Kill a Process Using the kill Command With a PID

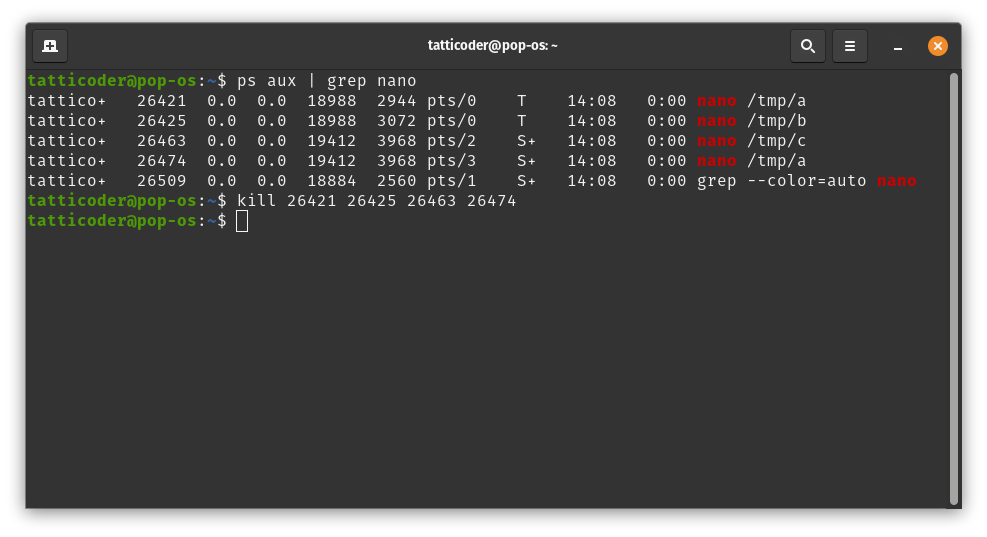
    1. Using the kill command: Once you have the PID, you can use the kill command to terminate the process:
    kill PID

    Replace “PID” with the actual number you found. For instance:

    kill 1234
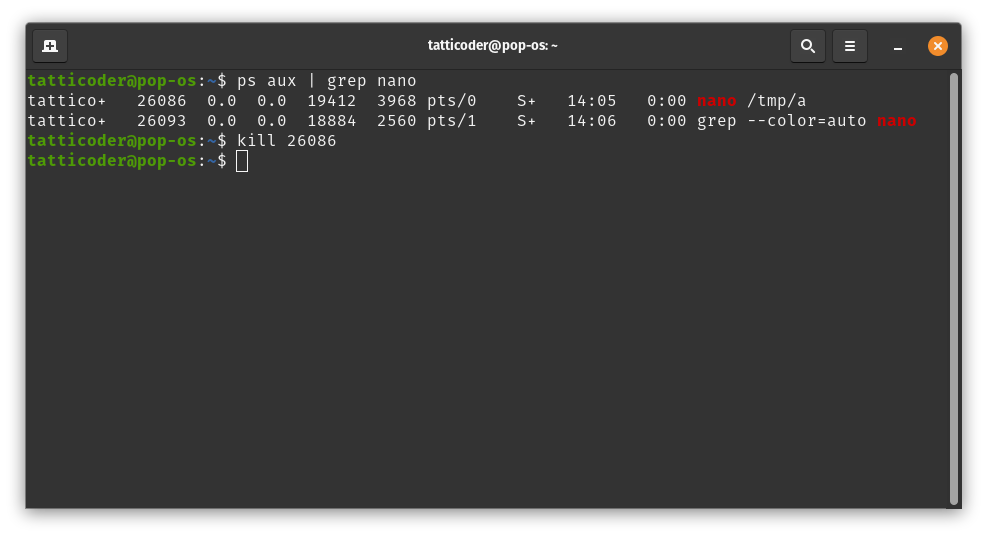
    kill linux process

    This sends a SIGTERM signal, asking the process to shut down gracefully.

    1. Forceful termination: If the process doesn’t respond to the regular kill command, you can use a stronger signal, SIGKILL (9), which forces immediate termination:
    kill -9 PID

    Be cautious with SIGKILL as it doesn’t allow the process to clean up, potentially leading to data loss or corruption.

    How to Kill Multiple Processes

    Sometimes, you need to terminate multiple processes simultaneously. Linux provides efficient ways to do this:

    1. Using kill with multiple PIDs: If you know the PIDs of all processes you want to terminate, you can list them after the kill command:
    kill PID1 PID2 PID3

    For example:

    kill 1234 5678 9101
    kill multiple linux process via command line
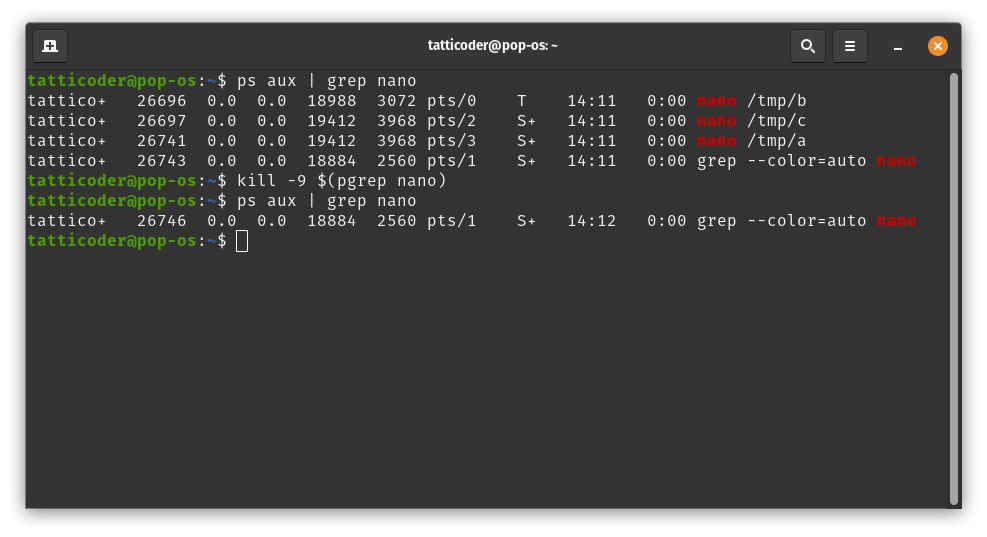
    1. Using command substitution: A more dynamic approach is to use command substitution with pgrep. This method kills all processes matching a name:
    kill $(pgrep process_name)

    For instance, to kill all Firefox processes:

    kill $(pgrep firefox)

    This command first uses pgrep to find all PIDs associated with Firefox, then passes these PIDs to the kill command.
    Suggested read: Everything You Need To Know About wp-config.php File

    How to Kill a Process Using the pkill Command

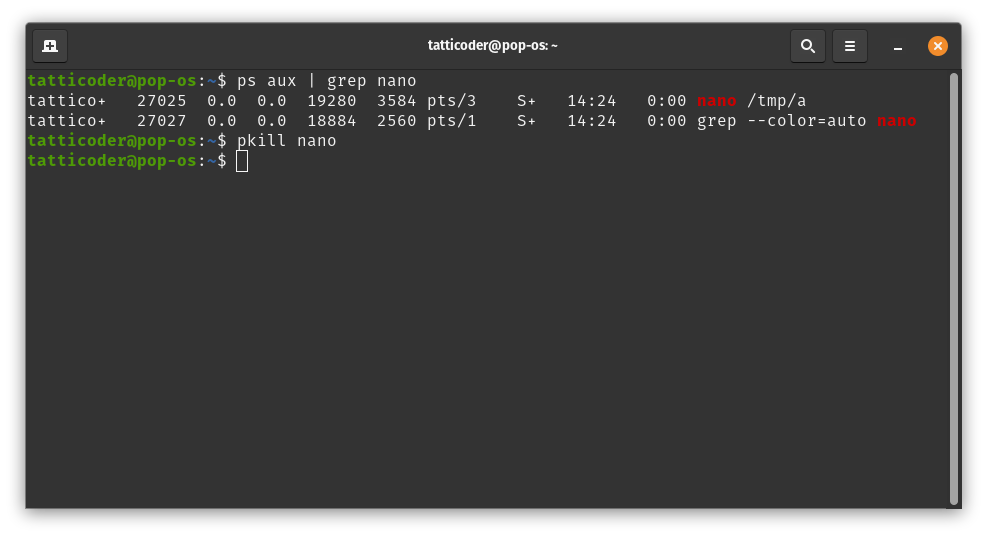
    The pkill command simplifies process termination by allowing you to kill processes based on their names rather than PIDs:

    1. Basic usage: To kill a process by name, simply type: pkill process_name
      This will terminate all processes with “process_name” in their names.
    2. Case-insensitive matching: If you need clarification on the exact capitalization of the process name, use the -i option. For instance: pkill -i firefox will match “Firefox”, “firefox”, or any other case variation.
    How to Kill a Process Using the killall Command

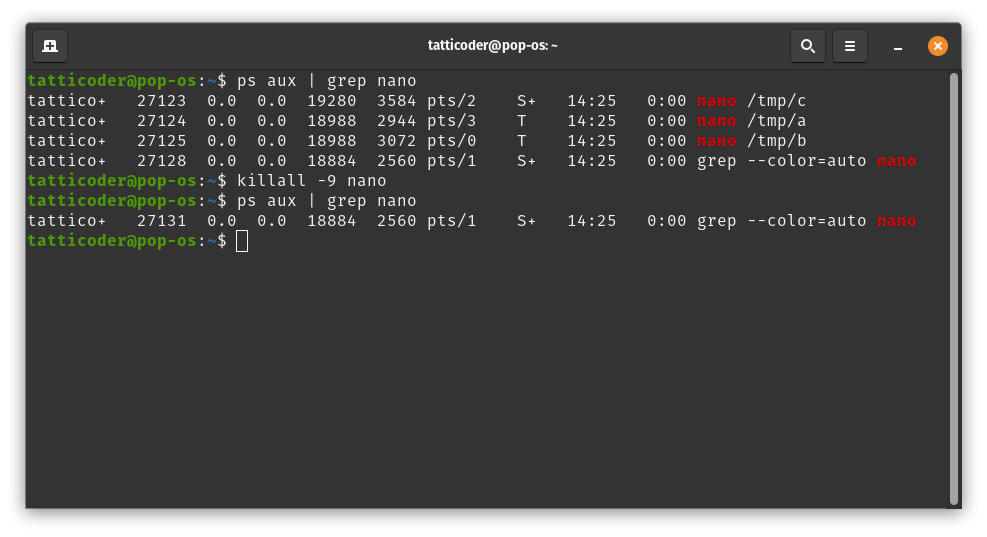
    The killall command is similar to pkill but requires an exact match of the process name:

    1. Basic usage: To kill all processes with an exact name match: killall process_name
    2. Forceful termination: For stubborn processes use the -9 option (equivalent to SIGKILL): killall -9 process_name

    Suggested read: Mastering the Echo Command in Linux (with Practical Examples)

    How to Kill Process in Linux by User

    Sometimes, you need to terminate all processes owned by a specific user:

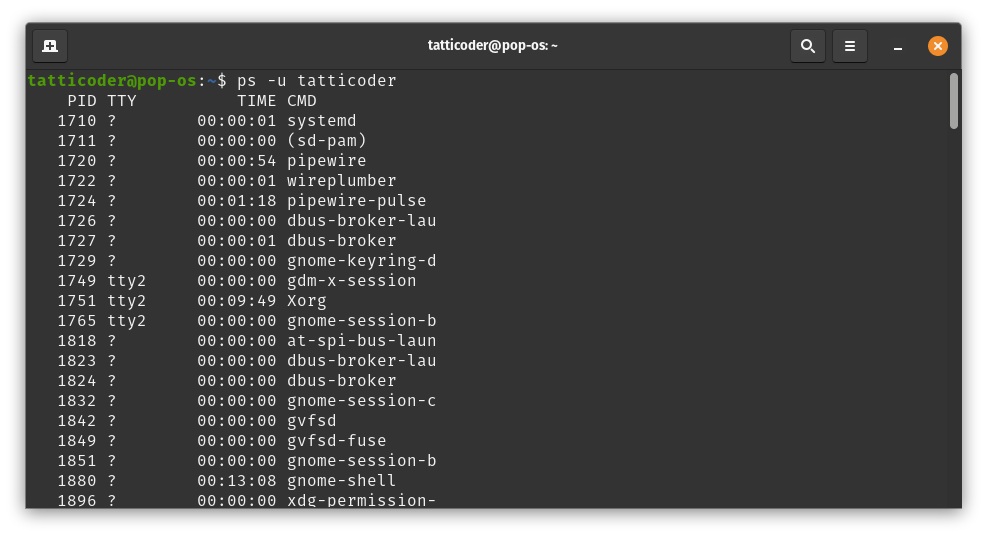
    1. Listing user processes: First, you can list all processes for a user: ps -u username
      Replace “username” with the actual username.
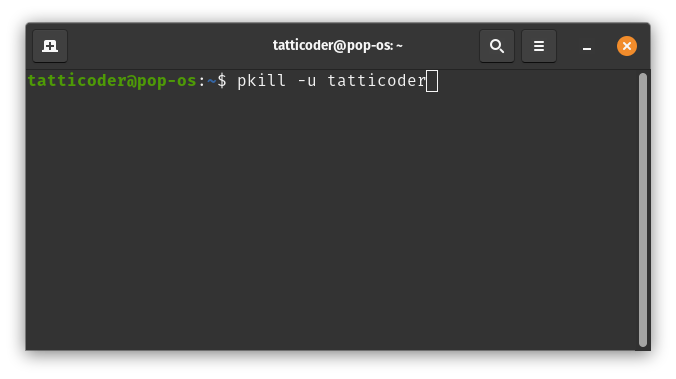
    1. Killing user processes: To kill all processes for a user, use pkill with the -u option:
      pkill -u username. For example: pkill -u john
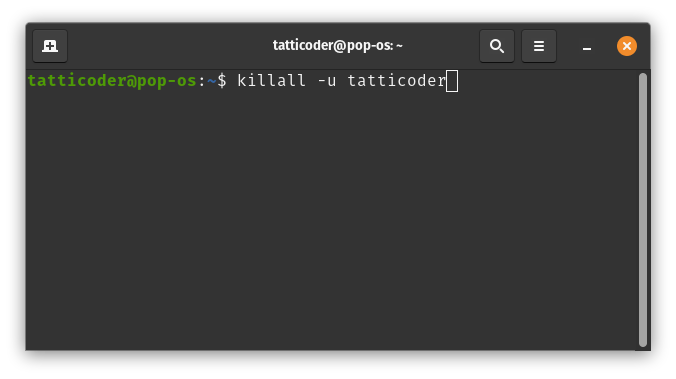
    1. Using killall for user processes: Alternatively, you can use the killall command to kill a particular user’s processes, as shown below.
    killall -u username
    Suggested read: What are Linux Logs? What Are They & How To Use Them

    How to Kill a Process in Linux by Name

    Killing processes by name is often more convenient than using PIDs. There are several ways to do this:

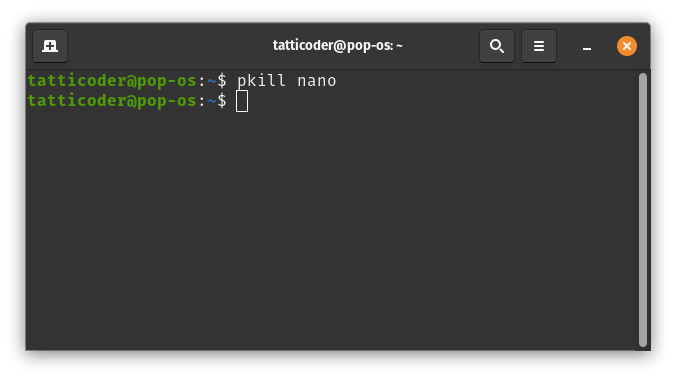
    1. Using pkill: The simplest method is by running the following command:
      pkill process_name. Don’t forget to replace process_name with the name of the process you are trying to kill.
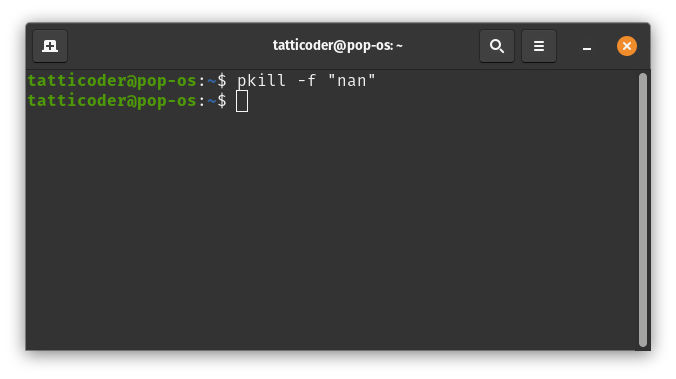
    1. Partial name matching: Use the -f option to match a substring in the process name for more flexible matching. This is useful for processes with long or complex names. The syntax of this command is as follows:
    pkill -f "partial_process_name"

    For example, pkill -f "firefox" would match any process with “firefox” anywhere in its command line.
    How to Kill a Process in Linux with Bash Script

    Creating a bash script for process termination can be helpful for repetitive tasks. Follow the steps below to avoid typing the long and complex commands:

    1. Create the script: Use a text editor to create a file named kill_process.sh. For example, you can use the nano editor to create the file using the following command:
      nano kill_process.sh.
    2. Add the script content: After creating the file, paste the following content into it:
    #!/bin/bash
    process_name=$1
    pid=$(pgrep -f "$process_name")
    if [ -z "$pid" ]; then
        echo "Process not found."
    else
        kill $pid
        echo "Process $process_name (PID: $pid) killed."
    fi
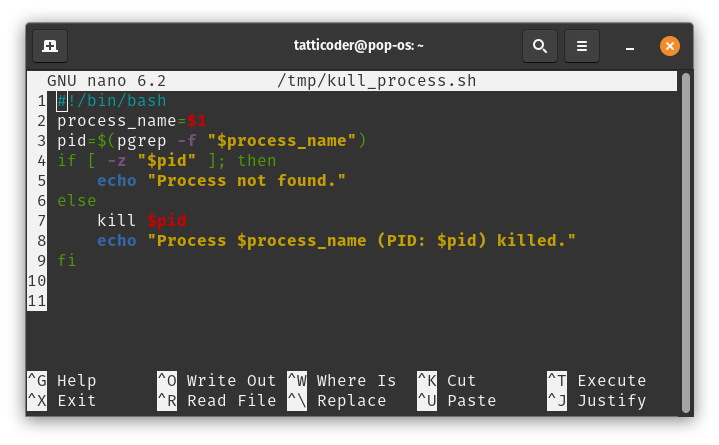
    Once you add the content, you can save it and exit it from the file editor. This script takes a process name as an argument, finds its PID, and terminates it.

    Before you can execute the script, you need to make it executable. Change the file permissions by executing the following command to make it executable:

    chmod +x kill_process.sh

    After changing the file permissions, you can run the script by simply typing its name in the command line, followed by the name of the process you want to kill. For example:

    ./kill_process.sh firefox

    The above command will attempt to kill a process named “firefox” on your computer.

    Linux Process Management: At a Glance

    This table provides a quick reference for common commands used to manage processes directly from the command line.

    Action / GoalBash Command ExampleWhen to Use It
    Kill a process by its PIDkill 1234The standard way to terminate a process when you know its exact PID. This sends a graceful shutdown signal (SIGTERM).
    Force-kill a process by PIDkill -9 1234A last resort to forcibly terminate a non-responsive process. This sends a SIGKILL signal that cannot be ignored.
    Kill multiple specific processeskill 1234 5678When you have a specific list of PIDs, you need to terminate all at once.
    Kill a process by partial namepkill 'node'To conveniently kill a process that matches a name or pattern, without needing to find the PID first.
    Kill all processes with an exact namekillall 'firefox'To terminate all instances of a specific program (e.g., all open Firefox windows). It’s safer than pkill if other processes have similar names.
    Kill all processes owned by a userpkill -u 'Alex'To terminate all processes running under a specific user account, often for administrative or security reasons.

    Wrapping Up

    In this post, we’ve explored various methods for killing processes in Linux from the command line. From using the kill command with a process ID to tools such as pkill and killall, you should now understand how to terminate unwanted or misbehaving processes on your Linux system.

    While a good understanding of the Linux command line helps manage your website, it is not a requirement.

    With the help of a hosting platform like RunCloud, you can easily manage your Linux server without getting bogged down in the technical details.

    RunCloud provides a user-friendly interface that simplifies server management, allowing you to focus on building and growing your online presence.

    Whether you’re a seasoned Linux user or just getting started, RunCloud makes it easy to deploy, monitor, and handle mundane tasks like performing regular backups.

    Ready to take your website to the next level? Sign up for RunCloud today and let us handle the Linux management so you can spend more time on what matters most – your business.

    FAQs on Killing Linux Processes

    How do you kill unnecessary processes in Linux?

    To kill unnecessary processes in Linux, you can use commands such as kill, pkill, or killall to terminate the unwanted processes based on their process ID (PID) or name.

    What command can you use to kill a process?

    The kill -9 PID command, which sends the SIGKILL signal, can be used to forcefully terminate a process that is not responding to a regular termination signal.

    How do you find the killed process in Linux?

    To find a killed process in Linux, you can use the ps command to list all running processes or the pgrep command to search for processes by name.

    How do I gracefully shut down a process in Linux?

    To gracefully shut down a process in Linux, you can use the kill command without any signal options, which will send the SIGTERM signal and allow the process to perform cleanup operations before exiting.

    How do you end a process by keystroke?

    In Linux, you can use the Ctrl+C keyboard shortcut to interrupt and terminate the currently running foreground process.

    How do you abort a run in Linux?

    To abort a running process in Linux, you can use the Ctrl+C keyboard shortcut. This will send the SIGINT signal and interrupt the process’s execution.

    Which key is used to cancel a process?

    The Ctrl+C keyboard shortcut is commonly used to cancel or interrupt the currently running process in Linux.

    How do I kill a high CPU process in Linux?

    In Linux, you can use the top command to identify a process that consumes a large amount of CPU resources and then use the kill command to terminate it.

    What’s the difference between a “job” and a “process” in Linux

    A process is any program that is currently running on the operating system. The Linux kernel manages all processes.
    A job is a shell-level concept that manages one or more processes within a single terminal session. Think of it as a label for a task you’re running. You can move a job to the background or foreground, but the kernel still manages it as a process.

    How can I see processes in a tree-like view?

    It’s useful to see which processes were started by other processes (parent-child relationships). The pstree command is perfect for this, as it gives you a visual map of everything running on your system, which can be very helpful for troubleshooting.

  • How to Fix Error Establishing a Database Connection in WordPress [SOLVED]

    How to Fix Error Establishing a Database Connection in WordPress [SOLVED]

    Few WordPress errors are as frustrating as seeing the message “Error Establishing a Database Connection.” It instantly takes your site offline, blocks both visitors and admins, and can cause serious downtime if not resolved quickly.

    This error occurs when WordPress cannot connect to your MySQL database, where all your posts, pages, and settings are stored. Without that connection, WordPress has nothing to display.

    The good news is that this issue is common and almost always fixable.

    In this guide, we’ll walk through exactly how to fix the error establishing a database connection in WordPress, step by step. From checking your wp-config.php file to repairing corrupted tables and optimizing your server, you’ll learn the proven fixes that quickly get your site back online.

    Let’s get started!

    What Causes ‘Error Establishing a Database Connection’ in WordPress?

    Before we dive into the fix, it’s helpful to understand what triggers this error.:

    • Incorrect Database Credentials: This is the most common reason for this error. The wp-config.php file contains the database name, username, password, and host. If any of these are wrong, the connection will be refused.
    • Corrupted WordPress Database: Your database can become corrupted due to a faulty plugin update, a theme installation gone wrong, or a server glitch.
    • Corrupted WordPress Core Files: Although less common for this specific error, a damaged core file related to the database functions can cause the connection to fail.
    • Unresponsive Database Server: The server where your database is hosted might be down, overloaded, or experiencing technical issues. This is a problem on your hosting provider’s end.
    • Sudden Traffic Spikes: A massive surge in traffic can overwhelm your hosting server and temporarily make the database unresponsive to new connection requests.

    Suggested Read: How to Create a Database for Your Web Application | RunCloud Docs

    Step-by-Step Checklist to Fix ‘Error Establishing a Database Connection‘

    Follow these steps in order, as they are arranged from the most common and easiest fix to the least common.

    1. Back Up WordPress Website Before Troubleshooting

    Before making any changes, always create a full backup of your website. This protects your files and database if something goes wrong. RunCloud users can do this in one click from the dashboard.

    If you’re not using RunCloud, you can:

    • Use your hosting control panel (cPanel, Plesk, etc.) to generate and download a backup.
    • Download your WordPress files via FTP and export your database through phpMyAdmin.

    Skipping this step risks turning a small fix into a much bigger problem.

    Suggested Read: How to Connect a MySQL Database to PHP (A Developer’s Guide)

    2. Check and Update wp-config.php Database Credentials

    Incorrect credentials are the most common cause of this error. To check and fix them:

    1. Connect to your site using FTP or your host’s File Manager. Open the wp-config.php file in the root WordPress folder. RunCloud users can edit this file directly from the dashboard.

    Look for these lines of code:

    // ** MySQL settings - You can get this info from your web host ** //
    /** The name of the database for WordPress */
    define( 'DB_NAME', 'your_database_name' );
    /** MySQL database username */
    define( 'DB_USER', 'your_username' );
    /** MySQL database password */
    define( 'DB_PASSWORD', 'your_password' );
    /** MySQL hostname */
    define( 'DB_HOST', 'localhost' );
    1. Find your database details in your hosting control panel (often under “MySQL Databases”).
    2. Make sure the DB_NAME, DB_USER, DB_PASSWORD, and DB_HOST values match exactly. Note: most hosts use “localhost” for DB_HOST, but some require a specific server name or IP.
    3. If anything doesn’t match, update wp-config.php, save the file, and reload your site.

    Suggested Read: SQLite vs MySQL vs PostgreSQL (Detailed Comparison)

    3. Repair WordPress Database via phpMyAdmin or WP-CLI

    If your database tables are corrupted, WordPress cannot read them. Luckily, WordPress includes a built-in repair tool. This process fixes errors without deleting your data.

    1. Open your wp-config.php file.

    Add this line just above /* That's all, stop editing! Happy publishing. */:

    define('WP_ALLOW_REPAIR', true);
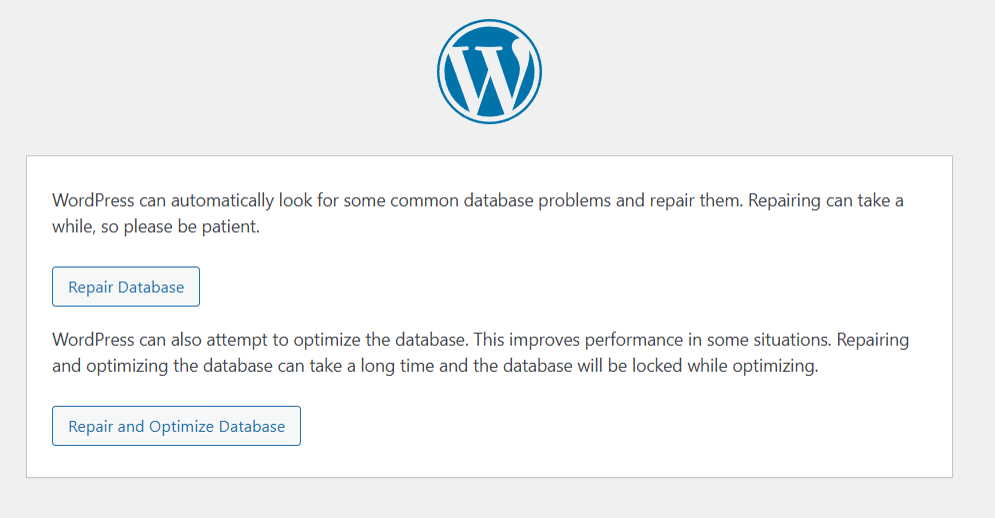
    1. Save the file, then go to: http://runcloud-demo.com/wp-admin/maint/repair.php.
    2. On that page, click “Repair Database.”
    Fix the error establishing a database connection
    1. When it finishes, delete the line you added in wp-config.php. Leaving it in place is a security risk.

    Suggested Read: How to Install phpMyAdmin Easily Using RunCloud

    4. Reset or Update WordPress Database User and Password

    Sometimes the database user loses permissions even if the credentials are correct. To fix this:

    1. Open the “MySQL Databases” section in your hosting control panel. RunCloud users can do this directly from the dashboard.
    1. Locate the database user for your WordPress site.
    2. Reset the password or create a new user with a strong password.
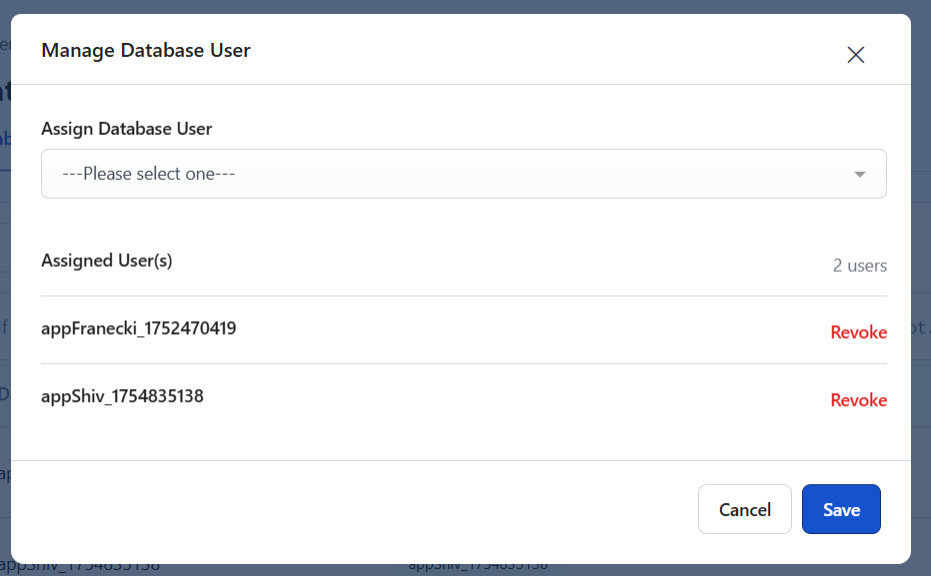
    1. Make sure this user has full privileges for your WordPress database. In RunCloud, use the “Assign and Revoke Users” option to manage this.
    1. Update the new password in your wp-config.php file under DB_PASSWORD.

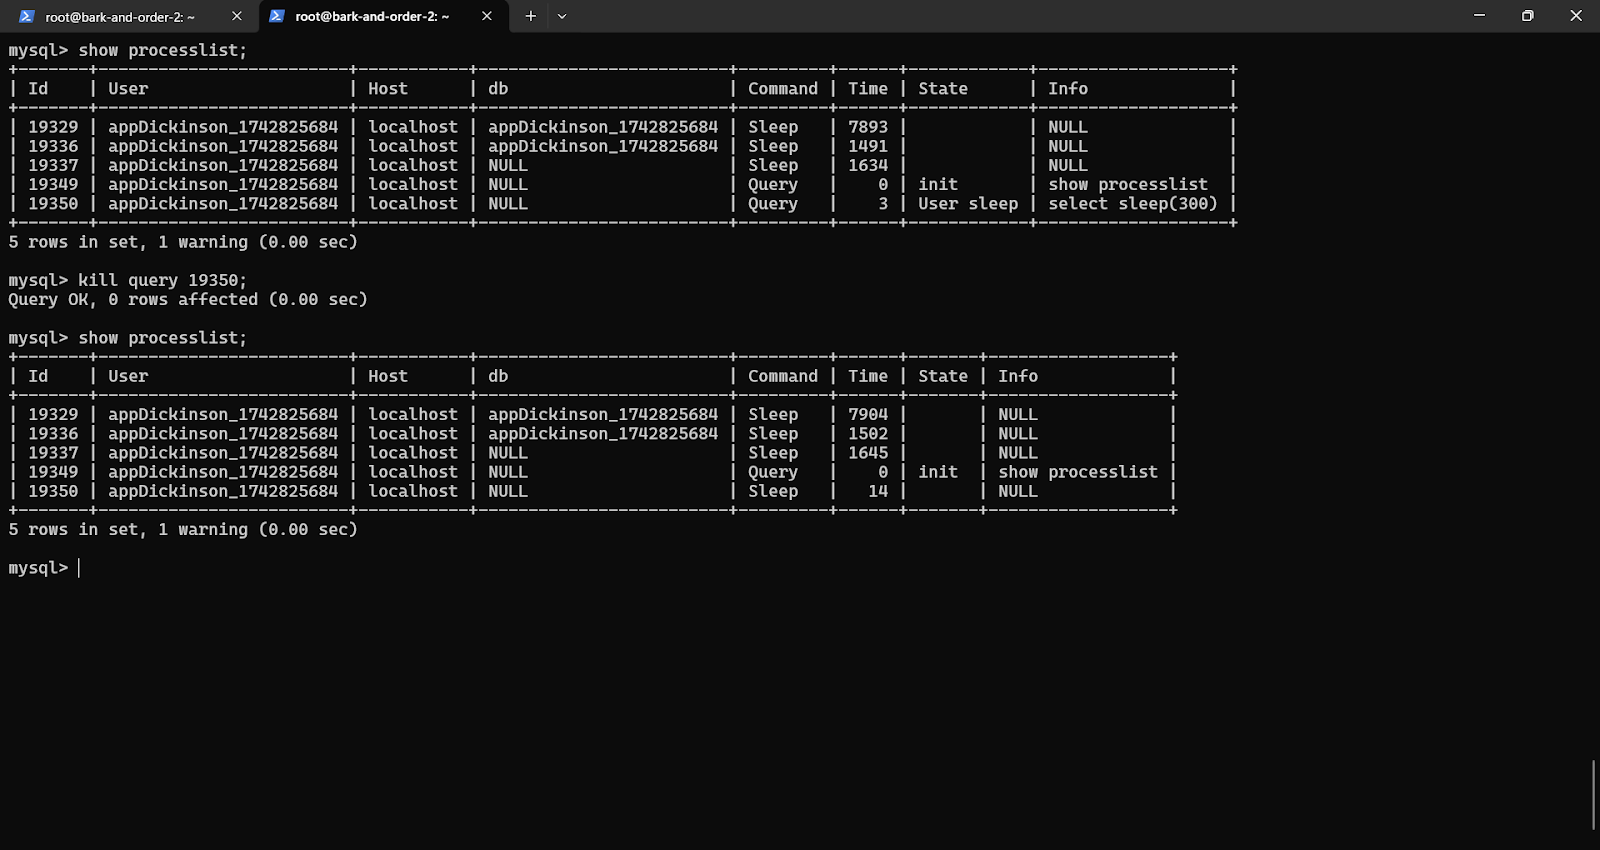
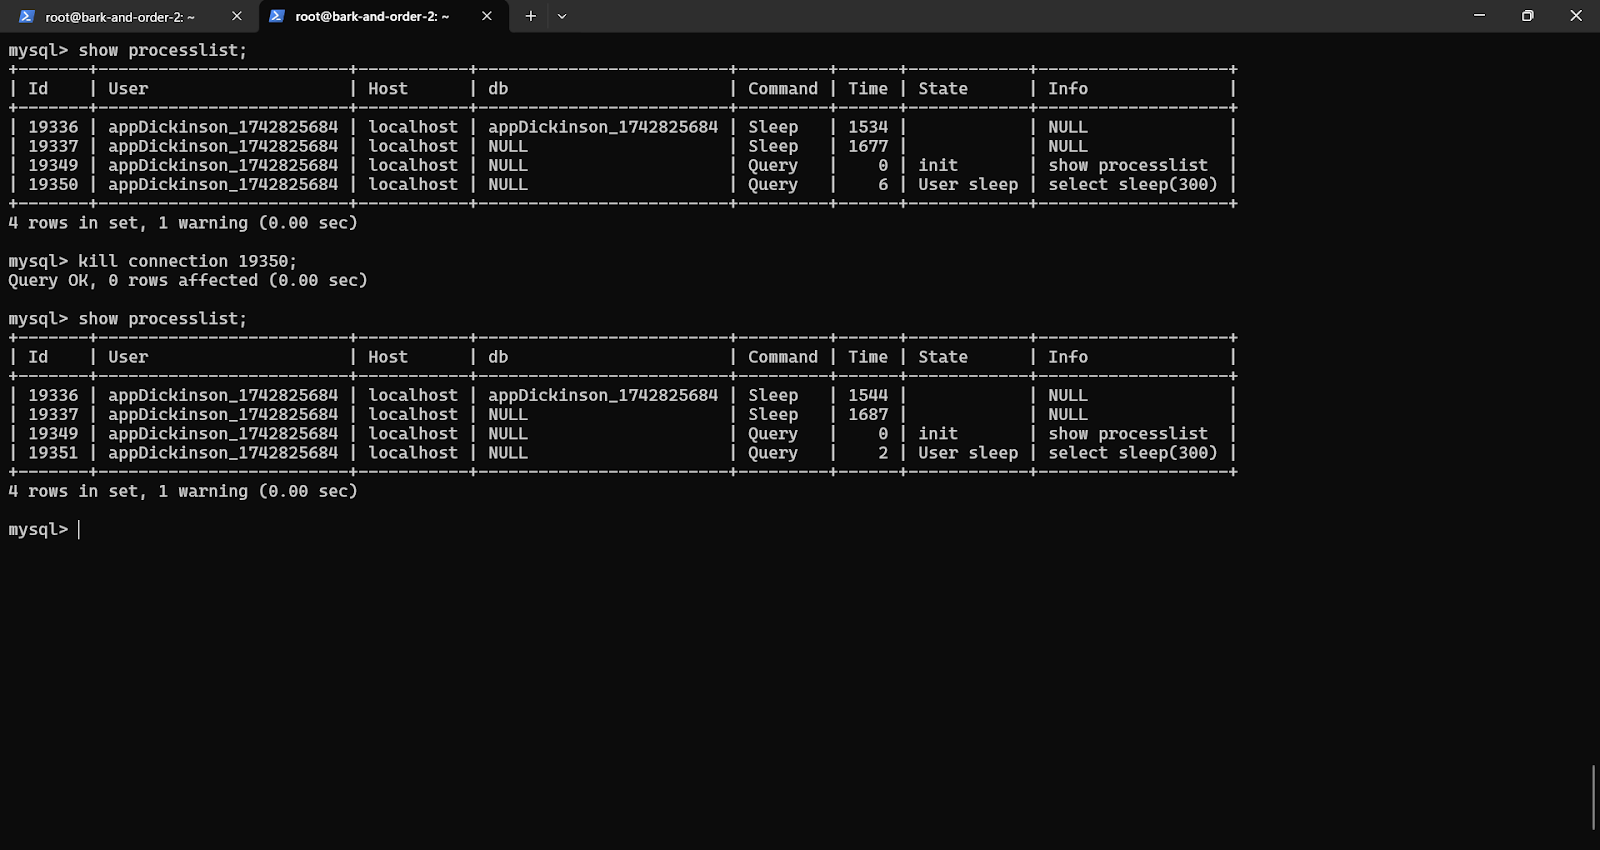
    Suggested Read: How to Identify and Kill Queries with the MySQL Command-Line Tool

    5. Reinstall or Replace Corrupted WordPress Core Files

    If a WordPress core file is corrupted, replacing it with a clean copy usually fixes the issue. Don’t worry – this won’t affect your themes, plugins, or content.

    1. Download the latest version of WordPress from WordPress.org.
    2. Unzip the file on your computer.
    3. Delete the wp-content folder and wp-config-sample.php file from the unzipped package.
    4. Connect to your site via FTP and upload the remaining files, overwriting the old ones.
    5. This refreshes all core files with clean copies without touching your content.

    Suggested Read: How to Migrate Your Server with (Near) Zero Downtime

    6. Check Hosting Server Health and MySQL Service

    If the error persists, the problem may be with your hosting server rather than WordPress.

    • Check Server Status: Most hosting providers publish updates about outages or maintenance. RunCloud does not provide server status updates, so check directly with your cloud provider (e.g., AWS, Vultr, DigitalOcean).
    • Test Other Sites: If you host multiple sites on the same account, check if they are also down. If they are, it’s likely a server-wide issue.
    • Contact Support: Open a ticket with your provider. Tell them you’re seeing an “Error Establishing a Database Connection” and that you’ve already confirmed your wp-config.php credentials. Ask them to confirm that the MySQL service is running.

    7. Optimize WordPress Database and Enable Caching

    If the error followed a sudden traffic spike, it may disappear once traffic drops. But this is a clear sign your site needs optimization.

    With RunCloud, you can enable NGINX FastCGI caching in one click, or add Redis or Memcached directly from the dashboard. This helps your site handle heavy database loads without needing command-line tools. For detailed guides, see:

    Advanced Troubleshooting for WordPress Database Connection Errors

    If you’ve worked through the standard checklist and are still facing the error, it’s time to investigate deeper server-level configurations and resource limitations. These advanced steps address less common but critical issues that often require more direct control over your hosting environment.

    1. Update DB_HOST in wp-config.php

    Most setups use localhost for DB_HOST, but some hosts run the database on a separate server. In those cases, you’ll need to replace localhost with the hostname or IP address your provider gives you (e.g., mysql.yourhost.com).

    2. Increase PHP memory

    Sometimes the error appears because PHP runs out of memory while processing a heavy query. To increase it, add this line to wp-config.php:

    define('WP_MEMORY_LIMIT', '256M');

    However, server-level settings can sometimes override this change. Manually editing the php.ini file via SSH is the most reliable method, but it can be intimidating for many users.

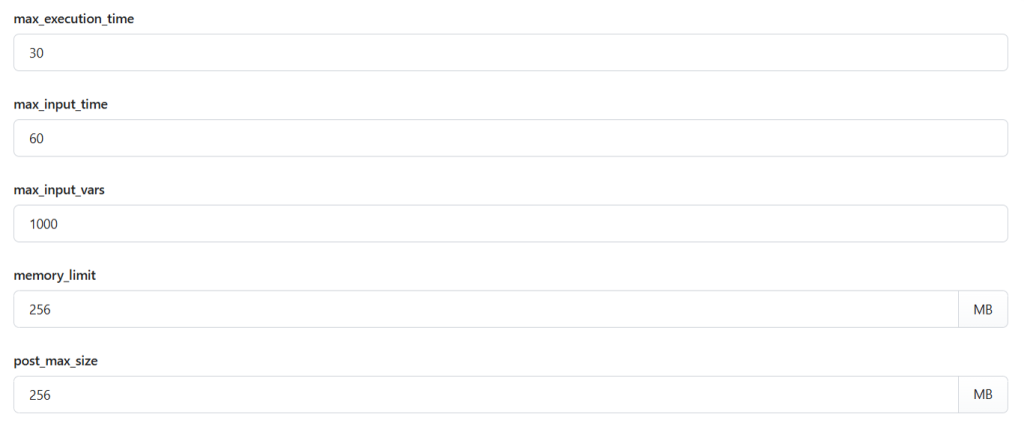
    RunCloud gives you direct, graphical control over your server’s PHP settings. From your web application’s dashboard, you can select a new memory_limit via a text box and other critical values like max_execution_time and upload_max_filesize. This removes the risk of syntax errors in configuration files and instantly applies the changes only to the selected application.

    3. Consider migrating to better hosting

    If you see this error often, the problem may be your hosting provider. Shared hosting, in particular, is prone to overloaded databases. Moving to a VPS (DigitalOcean, Vultr, AWS, etc.) provides more stability.

    The migration process can be daunting. It involves server provisioning, software installation (NGINX, PHP, MySQL), security configurations, and moving your site’s files and database.

    RunCloud is designed to make this transition seamless. You can connect it to any VPS provider, and it will automatically provision, optimize, and secure the server with a modern server stack in minutes. This makes managing and deploying a WordPress website and any web application easy.

    Wrapping Up: Preventing Database Connection Errors in WordPress

    Fixing the “Error Establishing a Database Connection” is one thing – making sure it doesn’t happen again is even more important. Regular backups, reliable hosting, proper caching, and a clean server setup reduce the chances of future downtime.

    That’s where RunCloud helps. Instead of juggling FTP clients, php.ini edits, and command-line fixes, you get a simple dashboard to manage everything – from database users to PHP settings and caching – in just a few clicks.

    If you want fewer headaches, faster performance, and a WordPress site that stays online even under heavy load, RunCloud is built for you.

    Take control of your server – start with RunCloud today and eliminate database errors for good.

    FAQs on ‘Error Establishing a Database Connection’ in WordPress

    Why is my WordPress site not connecting to the database?

    Your site cannot connect because the PHP code is blocked from accessing the MySQL database where your content is stored. This is most often due to incorrect database credentials in your wp-config.php file. 

    How do I fix database errors in cPanel?

    In cPanel, you can fix this by using the “MySQL Databases” tool to check the database username and reset its password. Then, you can use the integrated phpMyAdmin tool to select your database and run the “Repair table” command on any corrupted tables. Platforms like RunCloud offer a more modern interface for these tasks, making user management and phpMyAdmin access much quicker.

    What causes database issues on localhost XAMPP?

    MySQL is usually not running. Open the XAMPP control panel and check that the MySQL module is started (green status). Also, confirm that your wp-config.php settings match the XAMPP defaults – DB_USER is root, and DB_PASSWORD is blank.

    How do I repair a corrupted WordPress database?

    Add the define(‘WP_ALLOW_REPAIR’, true); line to your wp-config.php file to activate WordPress’s built-in database repair script. Alternatively, you can use phpMyAdmin to select all your database tables and choose the “Repair table” option. Server management panels like RunCloud provide one-click access to phpMyAdmin, simplifying the process of performing these database repairs.

    Why is my database error only happening on my iPhone?

    This is almost always a caching problem; your iPhone is likely viewing an old, cached version of the error page that no longer exists. Clear your mobile browser’s cache or purge your site’s caching plugin to resolve it. If you use server-level caching, a tool like RunCloud allows you to easily manage and purge the NGINX FastCGI cache directly from your dashboard.

    How can I check the MySQL server status in WordPress hosting?

    You’ll need to contact support on most shared hosting to confirm the MySQL server is operational. However, you can manage this using a VPS through a server panel. RunCloud provides a real-time server health monitoring dashboard that displays the status of essential services like MySQL, NGINX, and Redis.

    What should I do if database errors appear intermittently?

    Intermittent errors suggest your database server is temporarily overloaded, often due to high traffic spikes or slow database queries from a plugin. This is a resource issue, and you should enable an object caching solution to reduce the database load. With RunCloud’s server health monitoring, you can watch for spikes in CPU and memory usage to diagnose when your server is under strain.

  • How to Find Most Used Disk Space Directories and Files in Linux

    How to Find Most Used Disk Space Directories and Files in Linux

    On Linux, disk space can disappear fast. This guide shows you how to spot the biggest files and directories quickly, understand size mismatches, and free up space safely.

    How Do You Check Disk Usage With Built-In Linux Tools?

    In Linux Bash, you have several built-in utilities and commands that you can use to check and monitor disk usage. These utilities are readily available and don’t require any additional installations.

    Here are some of the commonly used built-in utilities for checking disk usage in Linux:

    How Do You Find Large Files in Linux?

    Most Linux systems include the du tool. Use it to see which files and folders use the most space.

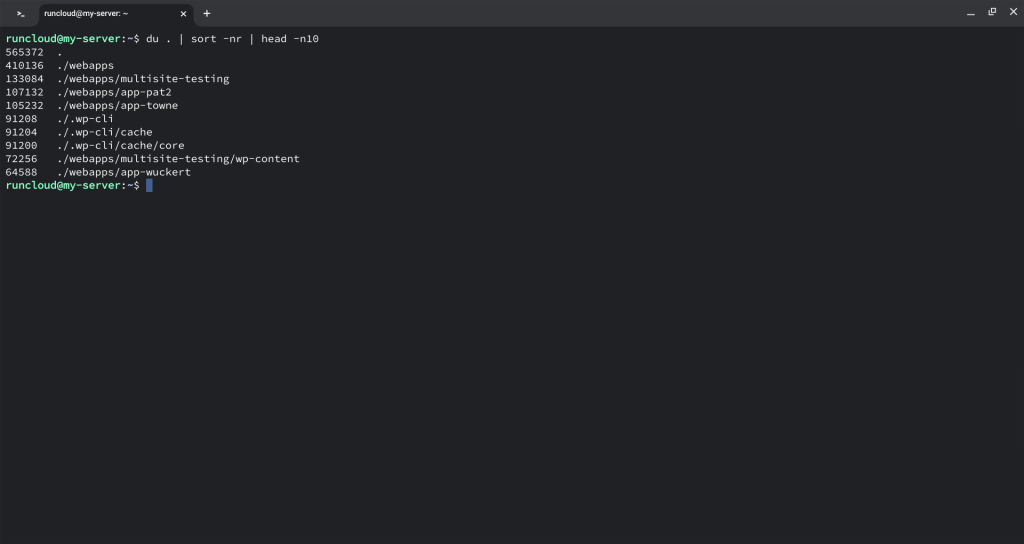
    To find the top 10 largest files from the current directory, run the following command in your Linux terminal:

    du . | sort -nr | head -n10
    Disk space in linux

    This command utilizes the du command to display disk usage, sort to sort the results in descending order, and head to display the top 10 largest files.

    How Do You Check the Largest Directories in Linux?

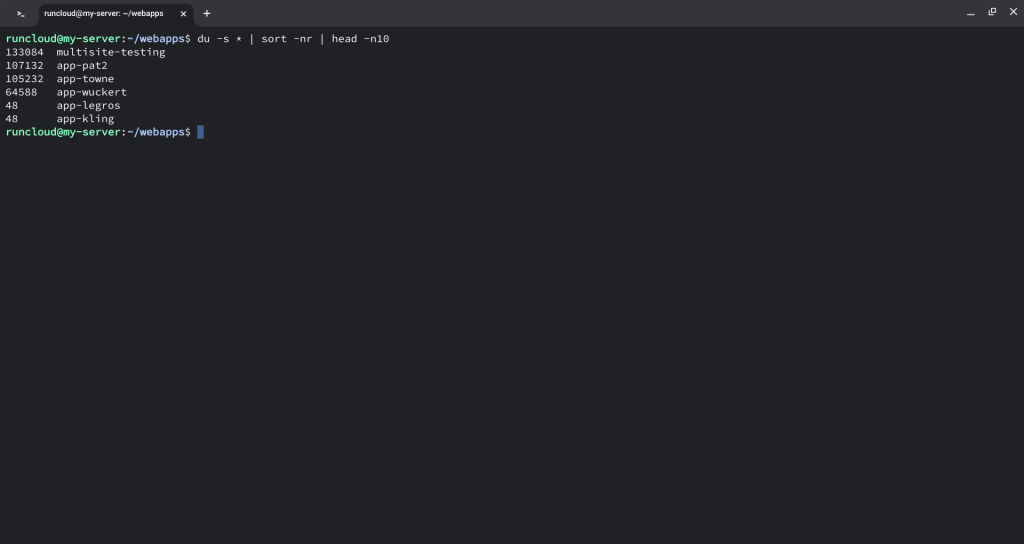
    Sometimes thousands of small files fill a disk faster than a few large ones. To list the largest directories in the current directory, you can run the following command in your terminal:

    du -s * | sort -nr | head -n10
    bask disk usage

    This command summarizes directory sizes, sorts them, and shows the top 10 largest directories in the current working directory.

    How Do You Find Large Files With GNU Tools in Linux?

    You can also use clever bash scripting with the find command to list the biggest files and directories.

    Method 1 – Identify Large Files With find

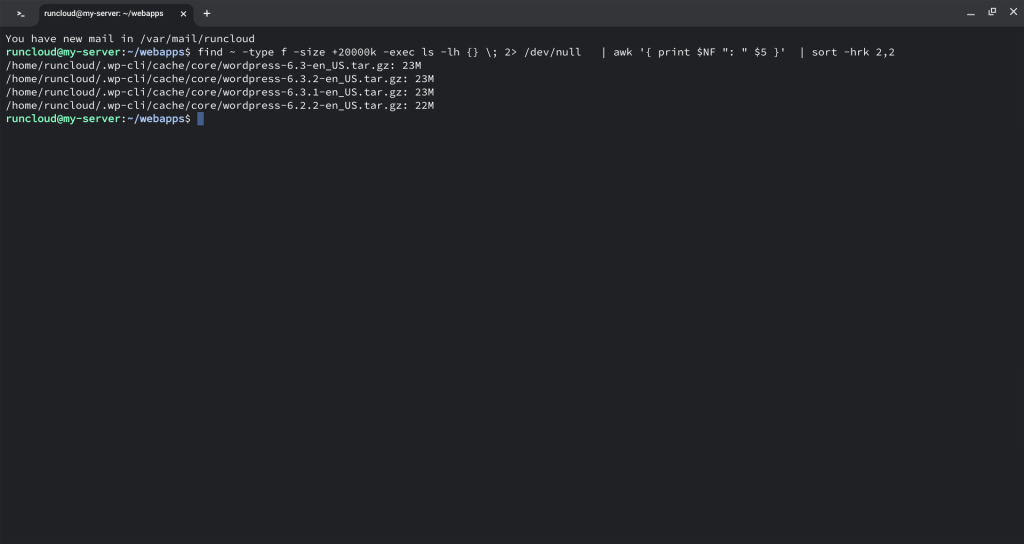
    The following command can be used to find and list files larger than 20,000 kilobytes (20 megabytes) in the user’s home directory (~). It then sorts these files by size in reverse order and displays the file names along with their respective sizes:

    find ~ -type f -size +20000k -exec ls -lh {} \; 2> /dev/null   | awk '{ print $NF ": " $5 }'  | sort -hrk 2,2

    Here’s a step-by-step explanation of how this command works:

    1. find ~ -type f -size +20000k: This part of the command initiates the search for files in the home directory (~). If you want to use a different directory, replace ~ with the path of your directory. The -type f option specifies that we are looking for regular files, and the -size +20000k option filters files larger than 20,000 kilobytes.
    2. -exec ls -lh {} \;: For each file that matches the criteria, the find command executes the ls -lh command, which lists detailed information about the file. The {} placeholder is replaced with the current file’s name during execution.
    3. 2> /dev/null: This part redirects any error messages (specifically, standard error) to /dev/null, effectively suppressing them. This is done to prevent error messages from being displayed in the terminal.
    4. | awk '{ print $NF ": " $5 }': The awk command processes the output from the previous command. It extracts the file name (represented as $NF) and the file size (represented as $5) and prints them in the format “filename: size”.
    5. | sort -hrk 2,2: The final part of the command uses sort to arrange the file entries. The options used are as follows:
      1. -h: This tells sort to perform a human-readable sort, which is useful for sizes with suffixes like “K” or “M”.
      2. -r: This specifies a reverse order sort, listing the largest files first.
      3. -k 2,2: This instructs sort to use the second field (the size) as the key for sorting.

    Method 2 – List the Biggest Files in Size Order

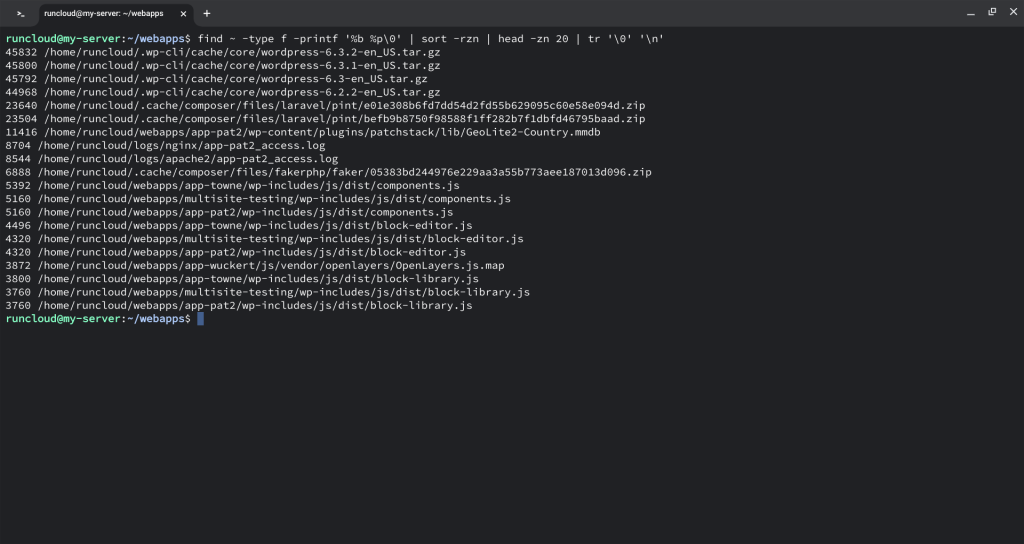
    Alternatively, you can use the following command to find and display information about the top 20 largest regular files in the user’s home directory (~). It reports the size of each file and its path, sorted in reverse order by size.

    find ~ -type f -printf '%b %p\0' | sort -rzn | head -zn 20 | tr '\0' '\n'

    Here’s a step-by-step explanation of how this command works:

    1. find ~ -type f -printf '%b %p\0': This part of the command initiates a search for regular files (-type f) in the home directory (~). For each file found, it uses the -printf option to format the output as follows:
      1. %b: Represents the number of 512-byte blocks allocated for the file.
      2. %p: Represents the file’s path.
      3. \0: Terminates each output entry with a null character (\0). The null character is used to separate file entries, and is especially important when dealing with file paths that contain spaces or special characters.
    2. | sort -rzn: The output from the find command is then piped (|) to the sort command for sorting. The following options are used with sort:
      1. -r: Performs a reverse order sort, arranging the entries from largest to smallest.
      2. -z: Informs sort that the input entries are null-terminated, which is why the null character (\0) was added at the end of each entry by the find command.
      3. -n: Specifies a numerical sort, ensuring that file sizes are sorted based on their numeric values rather than lexicographically.
    3. | head -zn 20: After the sorted list is generated by sort, the output is piped to the head command.
      1. -z: Informs head that the input entries are null-terminated.
      2. -n 20: Limits the output to the first 20 entries, which are the 20 largest files based on size.
    4. | tr '\0' '\n': Finally, the tr (translate) command is used to replace the null characters (\0) in the output with newline characters (\n). This is done to format the output in a more human-readable way, with each file and its size on a separate line.

    Note: You can also use the above bash script in conjunction with other bash commands such as numfmt to convert file sizes into human-readable formats. For example, you can do something like this:

    find ~ -type f -printf '%b %p\0' | sort -rzn | head -zn 20 | numfmt -z --from-unit=512 --to=iec | tr '\0' '\n'

    How Do You Check Directory Usage in Linux?

    To check how much storage memory each directory occupies, use the following commands:

    cd /
    du -sh * | grep G

    The above command shows memory usage by directories that occupy a volume measured in Gigabytes. It helps you decide which directories or files you may want to consider for deletion or optimization.

    Best Third-Party Tools for Disk Usage on Linux

    In addition to built-in utilities, there are many third party tools that you can use to assess disk usage in Linux Bash.

    How to Use iotop to Inspect Disk I/O

    iotop shows which processes are reading and writing to disk right now. It helps you spot I/O bottlenecks and noisy neighbours.

    Installation: You can use the apt package manager to install iotop-c:

    sudo apt update
    sudo apt install iotop-c

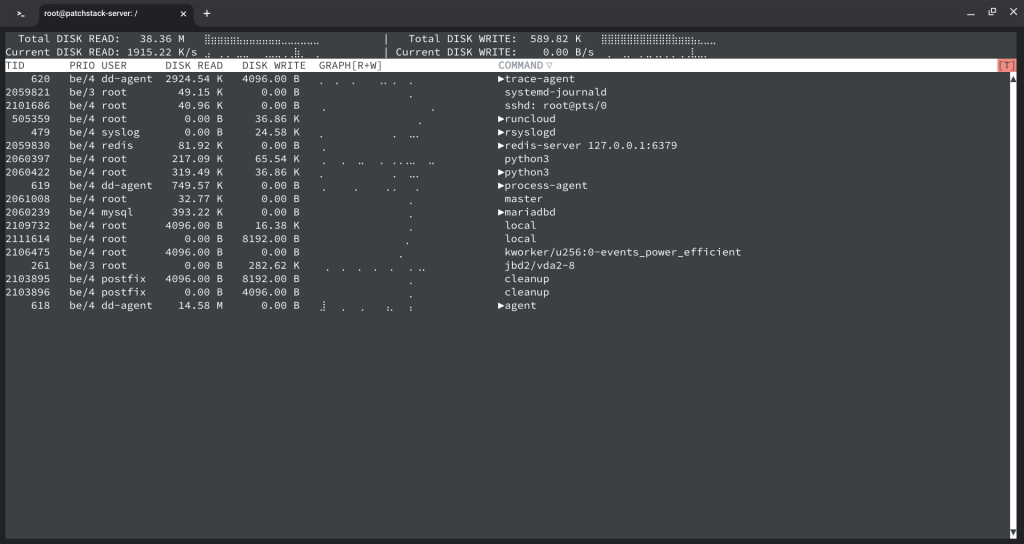
    Usage: After installation, you can run iotop to monitor and assess disk I/O usage. The -o option sorts the output by disk read or write, and -P displays paths. The -a option shows accumulated values, which can be useful for identifying processes with high disk I/O over time.

    Here’s an example of how to run iotop:

    iotop -oPa

    How to Use gdu to Scan Disk Usage

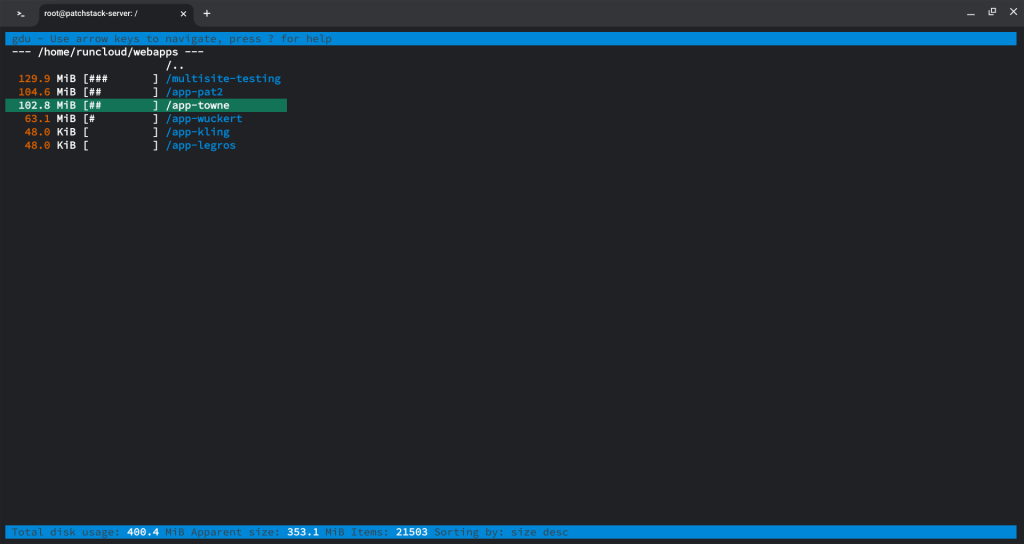
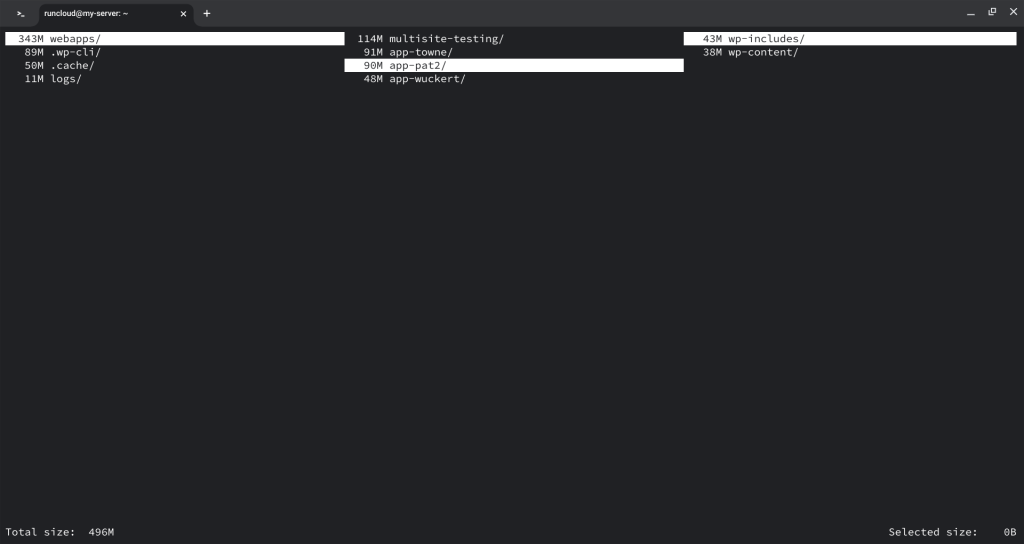
    gdu is a fast, terminal-based disk usage analyzer. Use it to scan a path and navigate heavy folders.

    Installation: You can download the binary from its GitHub repository and follow the installation steps in the official repository. For Debian/Ubuntu systems, you can run the following command to install the gdu utility:

    apt install gdu

    Usage: To analyze disk usage, run gdu with the desired directory as an argument. Use arrow keys on your keyboard to navigate different folders.

    How to Use dua for Disk Usage

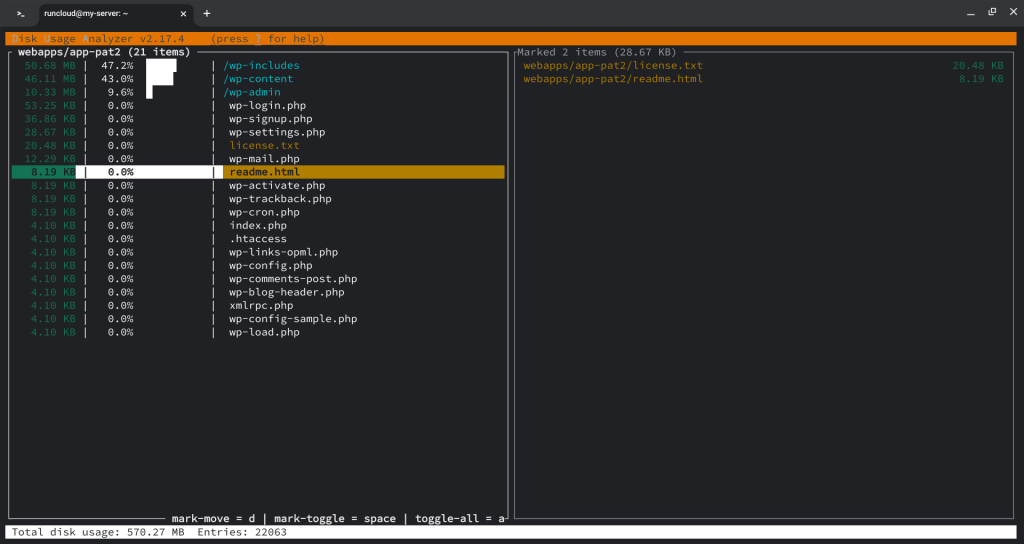
    dua helps you assess disk usage quickly and offers an interactive mode for safe cleanup.The dua command features an interactive mode in which you can explore your file system and choose to delete files and directories to free up disk space. It is designed to minimize the risk of accidental deletions by using a multi-stage process, making it safe for exploration.

    Installation: Dua can be installed by using the binary release for your specific system from the Dua repository.

    Usage:

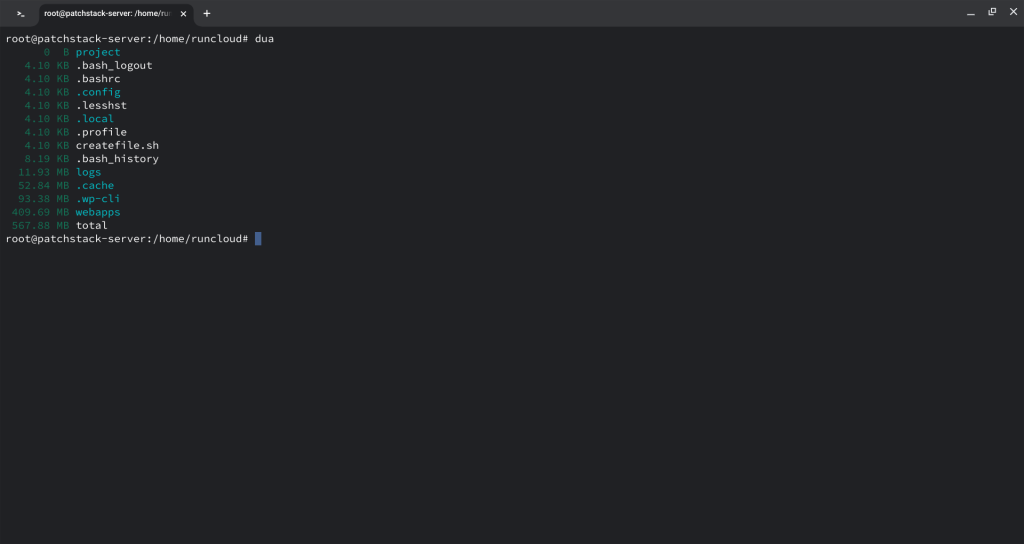
    • Run dua to count the space used in the current working directory.
    • Execute dua * to count the space used in all directories that are not hidden.
    • To learn about additional functionality such as the aggregate feature, use the dua aggregate --help command.
    • To launch into interactive mode, run dua i

    How to Use godu to Analyse Disk Usage

    godu identifies space-hungry files and directories with an interactive view.

    Installation: godu is another Go-based disk usage tool. You can download the binary from its GitHub repository, make it executable, and move it to a directory in your PATH.

    Usage: Run godu to analyze disk usage for a specific directory. Use the arrow keys on the keyboard to navigate through the file system.

    How to Use ncdu to Explore Disk Usage

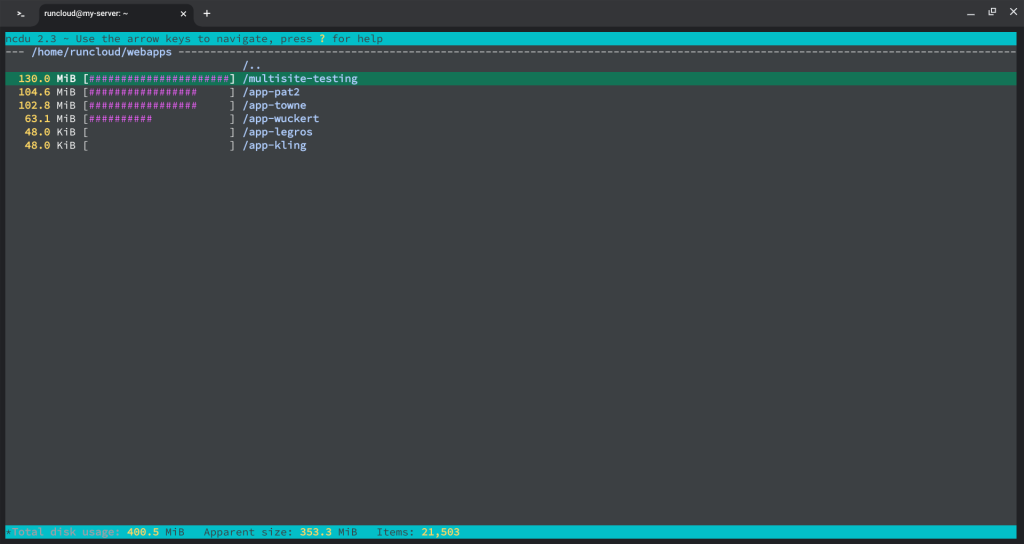
    ncdu is a terminal disk usage explorer. It scans quickly and lets you drill down and delete from the same screen.

    Installation: ncdu is an interactive disk usage analyzer that is available to most package managers. You can install it using apt on Debian-based systems:

    sudo apt update
    sudo apt install ncdu

    Usage: Run ncdu to analyze disk usage in an interactive text-based interface:

    These tools provide various ways to assess disk usage, and you can choose the one that best suits your needs and preferences. Some offer graphical interfaces, while others provide command-line-based analyses.

    Why Do ls and du Show Different Sizes?

    ls -l and du report different things, so sizes can look mismatched. Here’s what each one shows:

    Apparent Size

    This is the number of bytes that an application would read if it went from the beginning of the file to the end. It’s the “logical” size of the file. This is the value you see in the output of ls -l.

    Actual Disk Usage (Blocks)

    This is the amount of physical space the file actually occupies on the disk. Filesystems allocate space in fixed-size chunks called blocks (e.g., 4 Kilobytes). Even a file containing a single character will consume one full 4KB block. The du and quota commands report on this actual block usage.

    This difference is most dramatically illustrated with sparse files. A sparse file is a file with “holes” where data has never been written. The filesystem is smart and does not allocate any physical disk blocks for these empty holes.

    Compare Apparent vs. Actual Size on the CLI

    Let’s create a 1 Gigabyte sparse file using the following command.

    # Create a 1GB file instantly without writing any data to it
    truncate -s 1G /tmp/sparse-file.img

    Now, let’s measure it in two different ways:

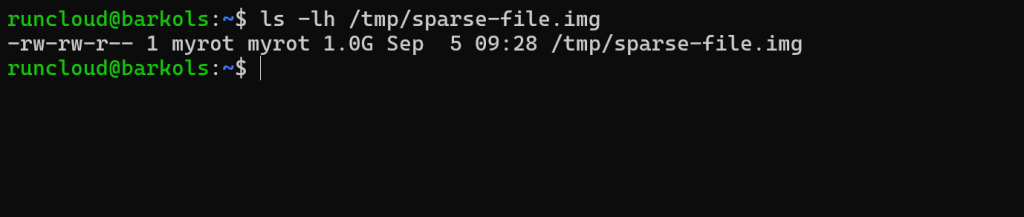
    Check the Apparent Size with ls:

    ls -lh /tmp/sparse-file.img

    The ls command reads the file’s metadata and reports its logical size: a full Gigabyte.

    Check the Actual Disk Usage with du:

    du -h /tmp/sparse-file.img

    The du command inspects the blocks allocated by the filesystem and reports that it is using zero blocks of physical disk space.

    This is an extreme example, but it perfectly illustrates that a file can appear to be very large while consuming very little of your quota. This is used heavily in virtual machine disk images, database files, and other applications that pre-allocate large files.

    How Do You Find Deleted but Open Files With lsof?

    In Linux, when you delete a file with rm, you are only removing its name from the directory. The actual data on the disk is not freed until every process that has the file open finally closes it. This is the most likely cause of the large discrepancy in your case.

    • The du utility can’t see the file because its name is gone from the directory tree.
    • However, its data blocks are still allocated to your user ID.

    The lsof (List Open Files) command is the perfect tool for finding these “phantom” files.

    How to Use lsof to Locate Deleted Files

    To find deleted files that are still open, use lsof with the link-count filter. The output is noisy, so filter by your user.

    # The +L1 flag filters for files with a link count less than 1 (i.e., deleted)
    # The grep command filters this system-wide list to only show your files
    lsof +L1 | grep 'runcloud'

    Replace runcloud with your actual username before running the above command.

    In the above example, we can clearly see that some files are still being identified by the lsof command even though they have been deleted and can not be accessed using the ls command.

    How to Free Space From Deleted Files in Linux

    If a deleted file is still open, stop the process holding it to release the space. Before you terminate the process, make sure you understand why it’s open.

    kill <process ID>

    After you run the kill command, the operating system will clean up the process, close the open file descriptor, and the filesystem will finally be able to free the data blocks.

    Linux Disk Usage Tools – At a Glance

    Tool Name CLI Command to RunWhat it Displays
    Disk Freedf -hOverall usage and free space for all mounted filesystems.
    Disk Usagedu -sh *Summarized disk usage for each file and directory in the current location.
    Find Command (for large files)find . -type f -size +1GA list of all files larger than a specified size (e.g., 1 Gigabyte).
    Find and Sort Pipelinefind . -type f -exec du -h {} + | sort -rhA sorted list of all files by size, from largest to smallest.
    NCurses Disk UsagencduA very popular, interactive text-based analyzer to explore disk usage.
    Go Disk Usage (gdu)gduA fast, modern, and interactive disk usage analyzer.
    Disk Usage Analyzer (dua)dua interactive .An interactive tool to view disk usage and delete files from its interface.
    Go Disk Usage (godu)goduAn interactive disk usage tool that can display a treemap in the terminal.
    I/O Topsudo iotopReal-time disk read/write activity shows which processes are using the disk now.

    Key Takeaways

    You now know several ways to find which files and directories are using the most space in Linux — from built-in commands like du and find to interactive tools like ncdu and gdu. These methods help you act fast when disk space runs low, prevent downtime, and keep your systems healthy.

    But constantly logging in and running these commands isn’t always practical. That’s where RunCloud helps.

    With RunCloud, you get:

    • A clear dashboard showing disk usage, CPU, and memory in real time
    • Alerts before space runs out, so you can act early
    • A secure, browser-based file manager to clean up files without needing command-line access

    By combining Linux’s flexibility with RunCloud’s visibility, you can keep your servers lean and reliable.

    Start with RunCloud today and make disk management effortless.

  • How to Delete A Large Directory with Thousands of Files in Linux

    How to Delete A Large Directory with Thousands of Files in Linux

    Deleting a large directory with thousands of files in Linux can be slow or even fail with basic commands. Whether you’re cleaning up old logs, project files, or datasets, knowing the right commands makes the process faster and more reliable.

    In this guide, we’ll show you how to delete directories with thousands of files in Linux using several methods – from rm and find to faster alternatives like rsync. You’ll learn which approach is best for different scenarios, how to avoid common errors, and how to free up disk space safely.

    Why Would You Need to Delete Thousands of Files at Once in Linux?

    If you use a computer professionally, you may have stored many files on your hard drive over time. These files can include documents, photos, videos, music, and more. Some of these files may be important and useful, while others may be outdated and unnecessary.

    Here are some possible scenarios:

    • You are a web developer and you have a project folder that contains thousands of files, such as HTML, CSS, JavaScript, images, etc. You want to delete the project folder because you no longer need it or you want to start from scratch.
    • You are a data analyst and you have a directory that contains thousands of CSV files, each containing data that you have processed or analyzed. You want to delete the directory because you have finished your analysis, and you want to free up some disk space.
    • You are a system administrator and you have a directory that contains thousands of log files, each recording system events or errors. You want to delete the directory because you have resolved the issues. If you want to clear the logs periodically then you should also read our article on log-rotation.
    • You are a photographer and you have a directory that contains thousands of RAW images, each capturing moments that you have taken with your camera. You want to delete the directory because you have edited or backed up the images, or you want to make room for new photos.

    Having too many files can affect your computer’s performance and disk space. Therefore, it is advisable to periodically delete the files that you no longer need or want.

    How Do You Delete a Directory in Linux?

    There are multiple ways to delete a file or folder in Linux. Let’s take a look at some of these ways.

    However, be careful when using these commands, as they are irreversible and may delete important files if used incorrectly.

    Always double-check the path and the options before executing them.

    How to Delete a Large Directory in Linux with rm

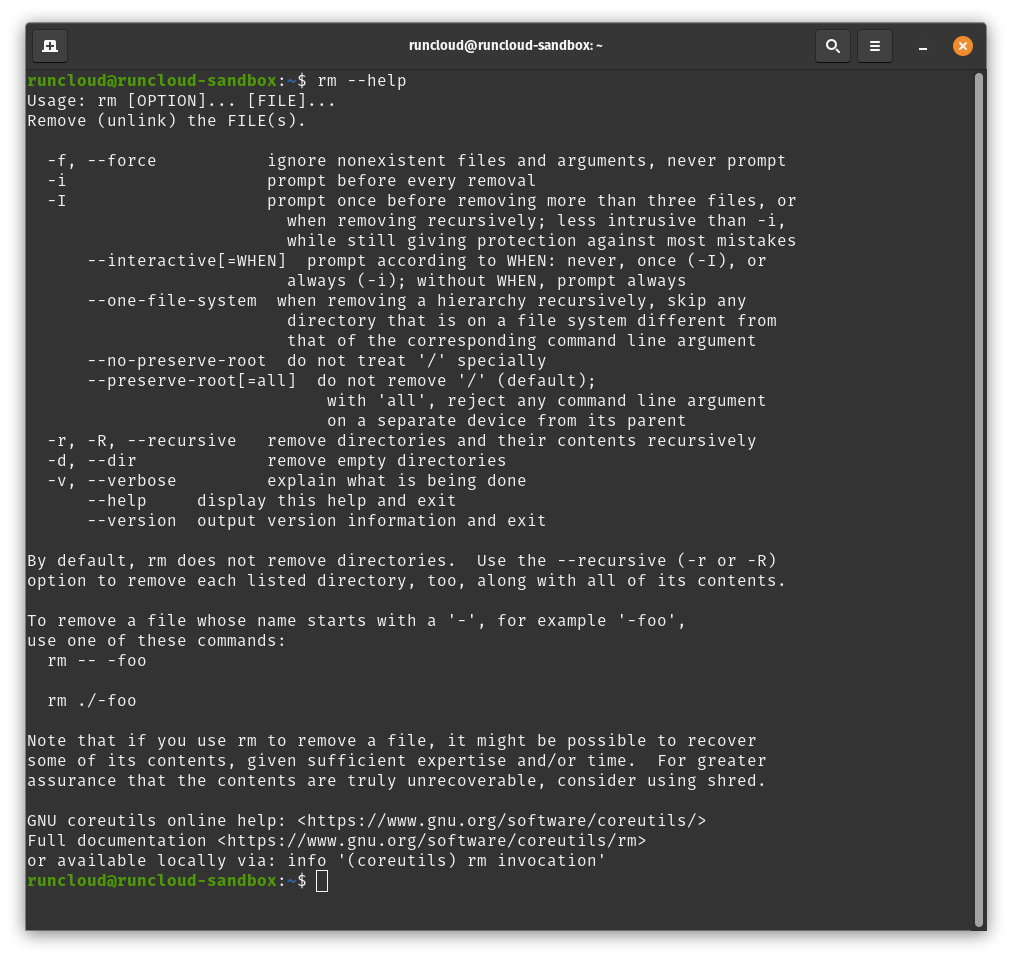
    The rm command is one of the most common and basic commands for deleting files and directories in Linux. To delete a directory and all its contents, you can use the -r option, which stands for recursive.

    For example, if you want to delete a directory named project, you can use the command:

    rm -r project
    how to use rm command linux

    However, this command may take a long time and generate a lot of output if there are too many files in the directory. To speed up the process and suppress the output, you can use the -f option, which stands for force.

    This option will delete the files and directories without prompting for confirmation or showing any messages.

    rm -rf project

    How to Delete Files and Directories in Linux with find

    Alternatively, you can use the find command, which is a powerful and flexible command for finding and manipulating files and directories in Linux.

    To delete a directory and all its contents, you can use the -delete option, which will find and delete all the files and directories under a given path. For example:

    find project -delete

    The find command also has many other options that allow you to selectively delete files based on different criteria, such as pattern, date, time, or size.

    How to Use rsync to Delete a Directory in Linux

    The rsync command is generally used to transfer and synchronize files between local and remote devices in an efficient way. It uses a special algorithm that only sends the differences between the source and destination files, which reduces the network usage and speeds up the transfers.

    This can be used for various scenarios, such as backup, mirroring, updating, copying, or even deleting files and directories. To delete a folder using rsync, you can use the following simple command:

    rsync -a --delete source/ destination/

    This command will sync the contents of the source folder to the destination folder, and delete any files or subfolders in the destination that do not exist in the source. The options used in this command are:

    • -a archive mode, which preserves almost everything (such as symbolic links, file permissions, user & group ownership, and timestamps).
    • --delete delete mode, which deletes extraneous files from the destination location.

    Note that you need to add a trailing slash (/) after the source and destination folder names, otherwise rsync will treat them as file names and create a subfolder in the destination.

    For example, if you use rsync -a --delete source destination, rsync will create a subfolder named source in the destination and sync the contents of the source folder to it.

    How to Securely Delete Files in Linux with shred

    Shred is used to permanently erase or destroy files so that no one can recover them. It is better than deleting normally, because a normal deletion only removes the reference to the file in the file system, but the actual data remains on the disk until it is overwritten by other data.

    A deleted file can be recovered using special software or hardware tools that can scan the disk for traces of data. Shred prevents this by overwriting the file multiple times with random data, making it impossible to reconstruct the original data.

    Shred also adds a final overwrite with zeros to hide the fact that the file was shredded. Therefore, shred is more secure and reliable than deleting normally, especially for sensitive or confidential files.

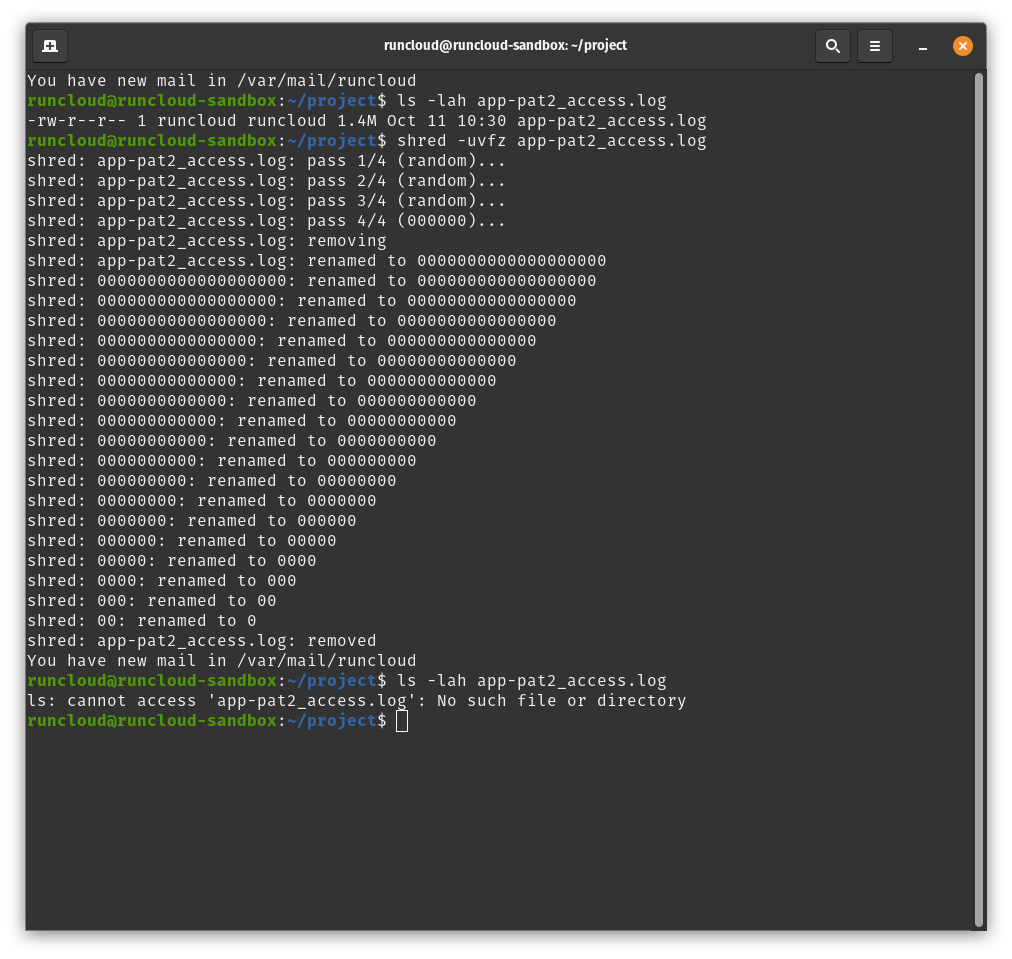
    To shred a document in Linux, you can use the following simple command:

    shred -uvfz document

    This command will overwrite the data in the document file several times, making it harder for third party software and hardware probing to recover the data. The options used in this command are:

    • -u flag will remove the file or directory after overwriting it with random data.
    • -v verbose mode, which shows information on shredded files.
    • -f force mode, which changes permissions to allow writing if necessary.
    • -z zero mode, which adds a final overwrite with zeros to hide shredding.
    Shred files to delete in linux

    The shred command can only be used to delete files and not directories. However, it is possible to use it in conjunction with other commands to create automated scripts that shred entire directories.

    For example, you can use the ‘find’ command with the -exec option to execute the shred command on each file found by ‘find’. Here is an example of how to shred and delete all the files in a directory named ‘secret’:

    find secret -type f -exec shred -u {} \;

    This command will find all the files in the secret directory and execute the shred command with the -u option on each of them.

    However, be aware that the shred command relies on the assumption that the underlying file system overwrites the same physical block when writing new data. Many newer file systems do not follow this assumption, and may use techniques such as journaling, copy-on-write, or wear leveling, which may prevent the shred command from effectively destroying the data. Therefore, shred may not work as expected on some file systems, such as ext3, ext4, btrfs, xfs, etc.

    How to Selectively Delete Files in Linux

    There are also a number of different ways in which it is possible to selectively delete files in Linux, depending on the criteria that you want to use. Here are some examples:

    How to Delete Files by Pattern in Linux

    You can use the rm command with a wildcard character (*), which matches any number of characters. This way, you can delete files that match a certain pattern, such as files with a specific extension, name, or prefix.

    For example, if you want to delete all the files that have the .txt extension in the current directory, you can use the command:

    rm *.txt

    If you want to delete all the files that start with the prefix test in the current directory, you can use the command:

    rm test*

    How to Delete Files by Date or Time in Linux

    You can use the find command with various options that locate files based on their modification (-mtime or -mmin), change (-ctime or -cmin), or access (-atime or -amin) time.

    These options take a number as an argument, which can be preceded by either a plus sign (+) or a minus sign (-). A plus sign means more than the given number, while a minus sign means less than the given number.

    The number can be either days (-mtime or -ctime) or minutes (-mmin, -cmin, or -amin).

    For example, if you want to delete all the files that were modified more than 10 days ago in the current directory, you can use the command:

    find . -mtime +10 -delete

    If you want to delete all the files that were accessed less than 30 minutes ago in the current directory, you can use the command:

    find . -amin -30 -delete

    How to Delete Files by Size in Linux

    You can use the find command with the -size option, which finds files based on their size.

    This option takes a number as an argument, which can be followed by a suffix that indicates the unit of measurement. The suffix can be either bytes (b), kilobytes (k), megabytes (M), gigabytes (G), or blocks (c).

    A plus sign (+) or a minus sign (-) before the number means larger than or smaller than respectively.

    For example, if you want to delete all the files that are larger than 100 MB in the current directory, you can use the command:

    find . -size +100M -delete

    If you want to delete all the files that are smaller than 1 KB in the current directory, you can use the command:

    find . -size -1k -delete

    Key Takeaways on Deleting Large Directories in Linux

    Deleting files in Linux may seem like a simple action, but there are lots of hidden nuances and challenges that you may encounter. In this article, we have explained how to delete directories with a large number of files in Linux using a variety of different commands and options.

    We have also shown you how to selectively delete files based on different criteria, such as pattern, date, time, or size. However, you need to be careful when using these commands, as they are irreversible and may delete important files if used incorrectly. Always double-check the path and the options before executing them.

    If you are struggling with the Linux command line, then you should take a look at RunCloud. RunCloud allows you to manage your sites effectively without needing to become a Linux system administrator. You can easily create, deploy, and update your websites with just a few clicks.

    RunCloud supports various web servers, such as Apache, Nginx, and LiteSpeed. You can also switch between different PHP versions with the click of a button. RunCloud works with any cloud provider, such as AWS, Google Cloud, DigitalOcean, and more. Sign up to RunCloud today and forget all the hassle!

    FAQs on Deleting Large Directories and Files in Linux

    What Does the “Argument List Too Long” Error Mean in Linux?

    This error occurs when a command like rm * expands to more filenames than the system can handle at once. You must use a more robust method, like the find or rsync commands, which process files individually or in batches.

    Why Is rm -r Slow in Linux and How Can I See Progress?

    rm can be slow because it has to process the metadata for every single file before deleting it. To see progress, you can add the verbose flag (rm -rv), which will print each file name as it’s deleted, though this can slow the process further.

    What Is the Difference Between rm -r and rm -rf in Linux?

    The -r flag means “recursive” to delete a directory and everything inside it. The -f flag means “force,” which suppresses confirmation prompts and ignores non-existent files, making it much more dangerous if you make a typo.

    Can I Do a Dry Run Before Deleting Files in Linux?

    Yes, before running a delete command, you can first list the files you intend to target by using find /path/to/directory -type f -print to be sure you’re in the right place.

    What Is the Fastest Way to Delete a Large Directory in Linux?

    The rsync method is often the fastest as it is highly optimized for this task. It works by syncing an empty directory over your target directory, which efficiently removes the files with minimal overhead.

    How Do I Fix “Permission Denied” Errors When Deleting Files in Linux?

    This means your user doesn’t have the rights to delete those files. You may need to run the command with sudo at the beginning, but be extremely careful as this grants root privileges and a mistake can damage your system.

    Can I Recover Files After Deleting Them in Linux?

    Unfortunately, no; command-line deletion in Linux is permanent and does not use a Trash or Recycle Bin. This is why you must always double-check your command and ensure you have reliable backups.

    What Happens If I Cancel a Deletion Mid-Process in Linux?

    The command will stop, but the files that were already deleted are gone forever. You will be left with a partially deleted directory that you can attempt to delete again later.


  • How to Check Your Ubuntu Version (Using the Command Line and Gui)

    How to Check Your Ubuntu Version (Using the Command Line and Gui)

    Whether installing new software, following an online tutorial, or troubleshooting an issue, one of the first questions you’ll face is, “What version of Ubuntu are you running?” Your operating system details are necessary for managing your system’s health and functionality.

    The version number of your operating system determines which applications and Personal Package Archives (PPAs) you can safely install, as many are built for specific releases. It also informs you about your system’s support lifecycle. For example, knowing you are on a Long-Term Support (LTS) version confirms that you will receive critical security updates for several years.

    Additionally, countless online guides tailor their instructions to a particular version, such as 22.04 or 24.04, so using the correct one prevents errors. Finally, when you ask for help on a forum or file a bug report, providing your version number is the first and most critical step toward getting a fast and accurate solution from the community.

    In this quick guide, we will show you two simple methods for finding your Ubuntu version: the graphical and command-line methods.

    Let’s get started!

    Method 1: The Graphical (GUI) Way

    If you prefer clicking over typing, Ubuntu’s graphical user interface (GUI) provides a straightforward path to find your system’s information. This method is ideal for desktop users and requires no command-line knowledge.

    Follow these simple steps:

    1. Open the Activities Overview. To do so, click the Activities button at the top-left corner of your screen. Alternatively, press your keyboard’s Super (Windows) key to open the same view.
    2. Find the Settings Application. Once the overview is open, begin typing the word Settings. An icon for the Settings application will appear in the search results. Click on this icon to launch the program.
    3. Navigate to the About Section. The Settings window will open. In the navigation panel on the left-hand side, scroll to the bottom and click on the About tab.

    This will open a screen dedicated to your system’s details. Look for the OS Name line. This line displays your Ubuntu version number and its release type, for example, Ubuntu 24.04 LTS.

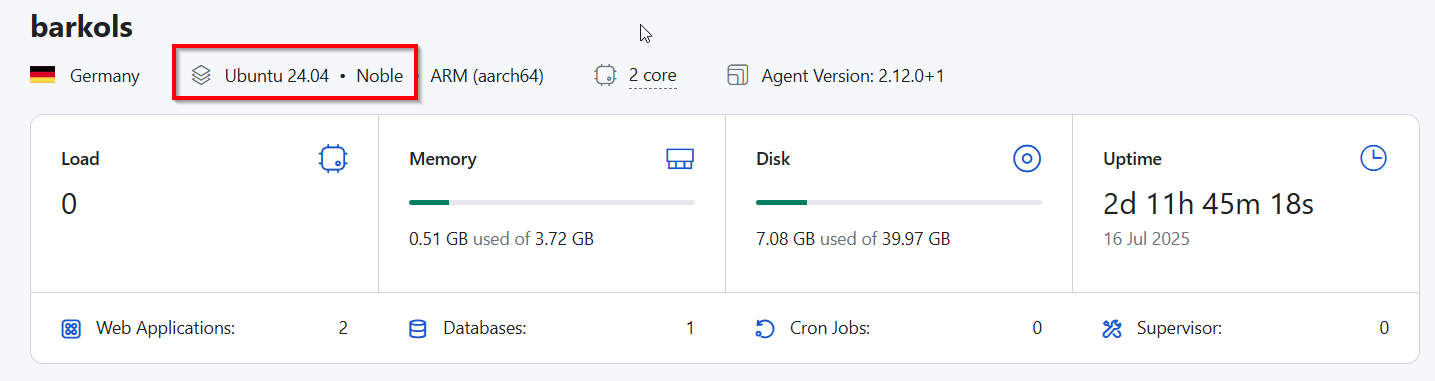
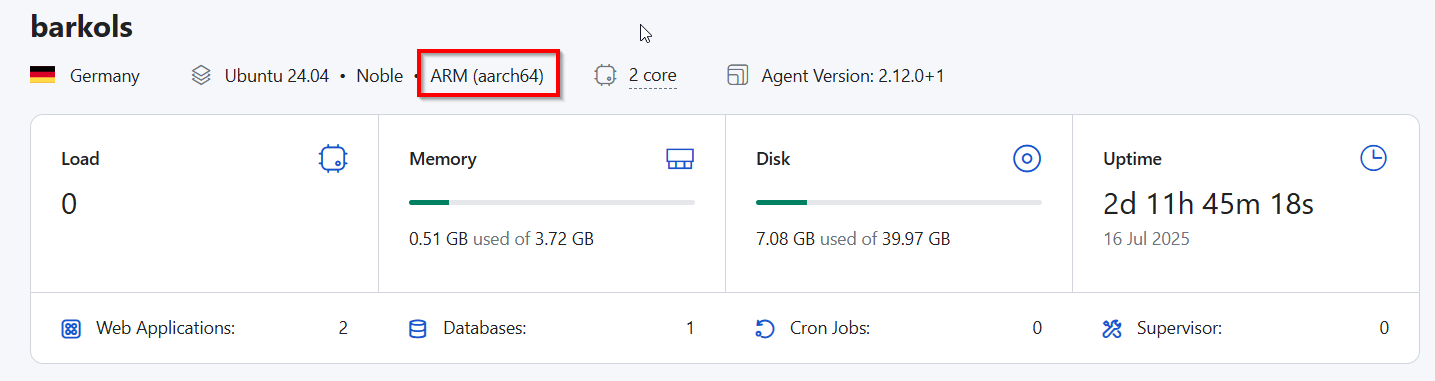
    If you are using RunCloud to manage your servers, then you can also see this information in the server dashboard summary section:

    Suggested read: How to Check OS version in Linux

    Method 2: The Command-Line (CLI) Way

    The terminal offers the fastest way to get system information if you are a server administrator, developer, or anyone who prefers working with text-based commands. The Command-Line Interface (CLI), or terminal, is a powerful tool that allows you to communicate directly with your computer.

    Even if you are not a server administrator, we recommend you try this out. These commands are simple, safe, and incredibly useful.

    To begin, open your terminal. The quickest way to do this on a desktop is by pressing the keyboard shortcut Ctrl+Alt+T.

    Option A: The Best All-Around Command (lsb_release)

    This is the standard and most recommended command for checking your Ubuntu version. lsb_release stands for Linux Standard Base, a standardized way for Linux systems to report their identity. Using this command ensures you get clear, well-formatted information.

    In your terminal, type the following command and press Enter:

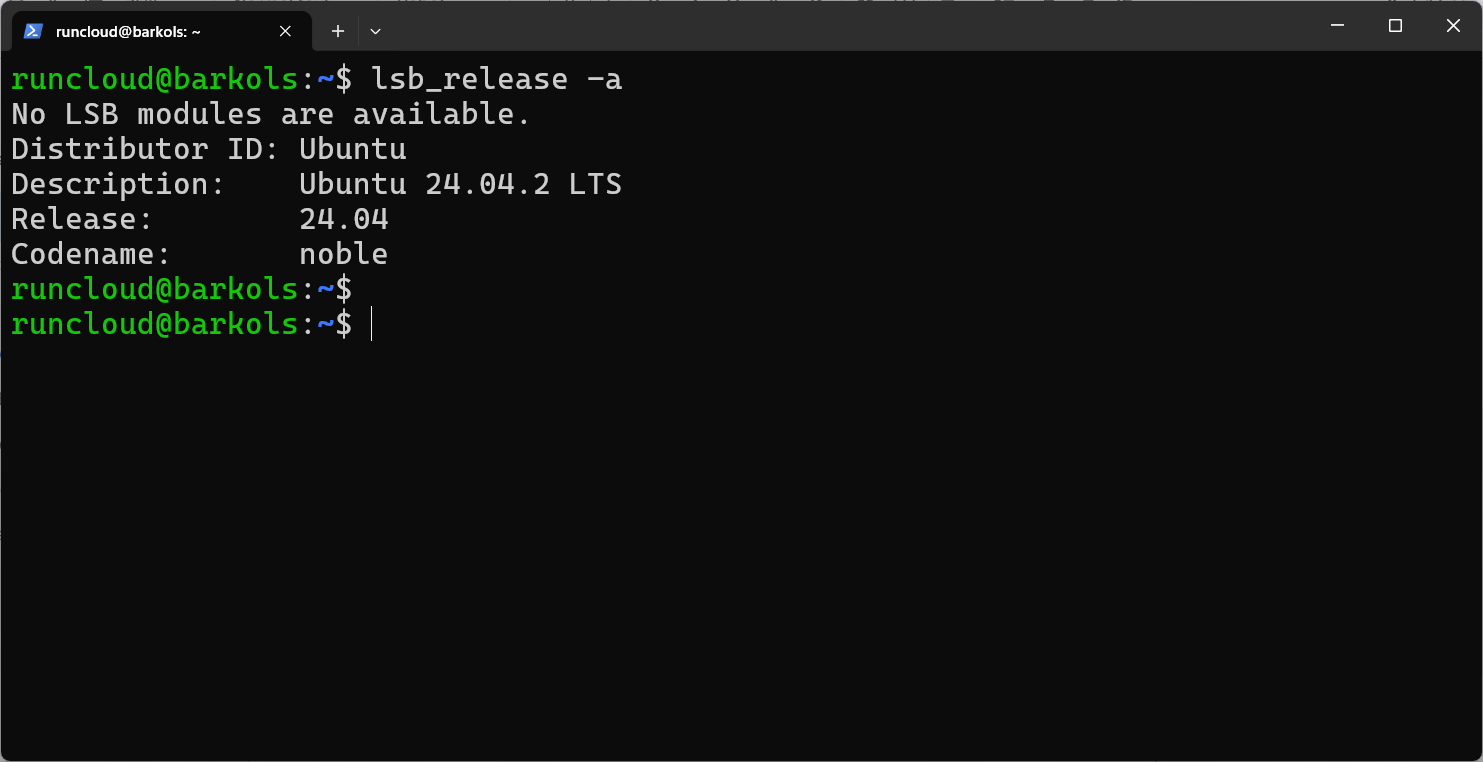
    lsb_release -a

    Your screen will display an output similar to this. Let’s break down what each line means:

    • Distributor ID: This simply confirms that your operating system is Ubuntu.
    • Description: This is the most important line for most users. It provides the full, human-readable version name, such as Ubuntu 24.04 LTS. The “LTS” signifies a Long-Term Support release, guaranteeing five-year security updates.
    • Release: This shows you just the version number (24.04), which can be useful for scripts or when a guide asks only for the number.
    • Codename: Every Ubuntu version has a unique, alliterative codename (such as “Noble Numbat” or “Jammy Jellyfish”).

    The Codename is more than just a name. You will often use it when adding new software sources, known as PPAs (Personal Package Archives), to your system. The codename ensures you download the correct package built specifically for your version of Ubuntu.

    Option B: Checking the /etc/os-release file

    This alternative method is wonderfully simple and works on nearly all modern Linux systems, not just Ubuntu. Instead of running a specific program, this command directly reads and displays the contents of a system configuration file.

    Type the following command into your terminal and press Enter:

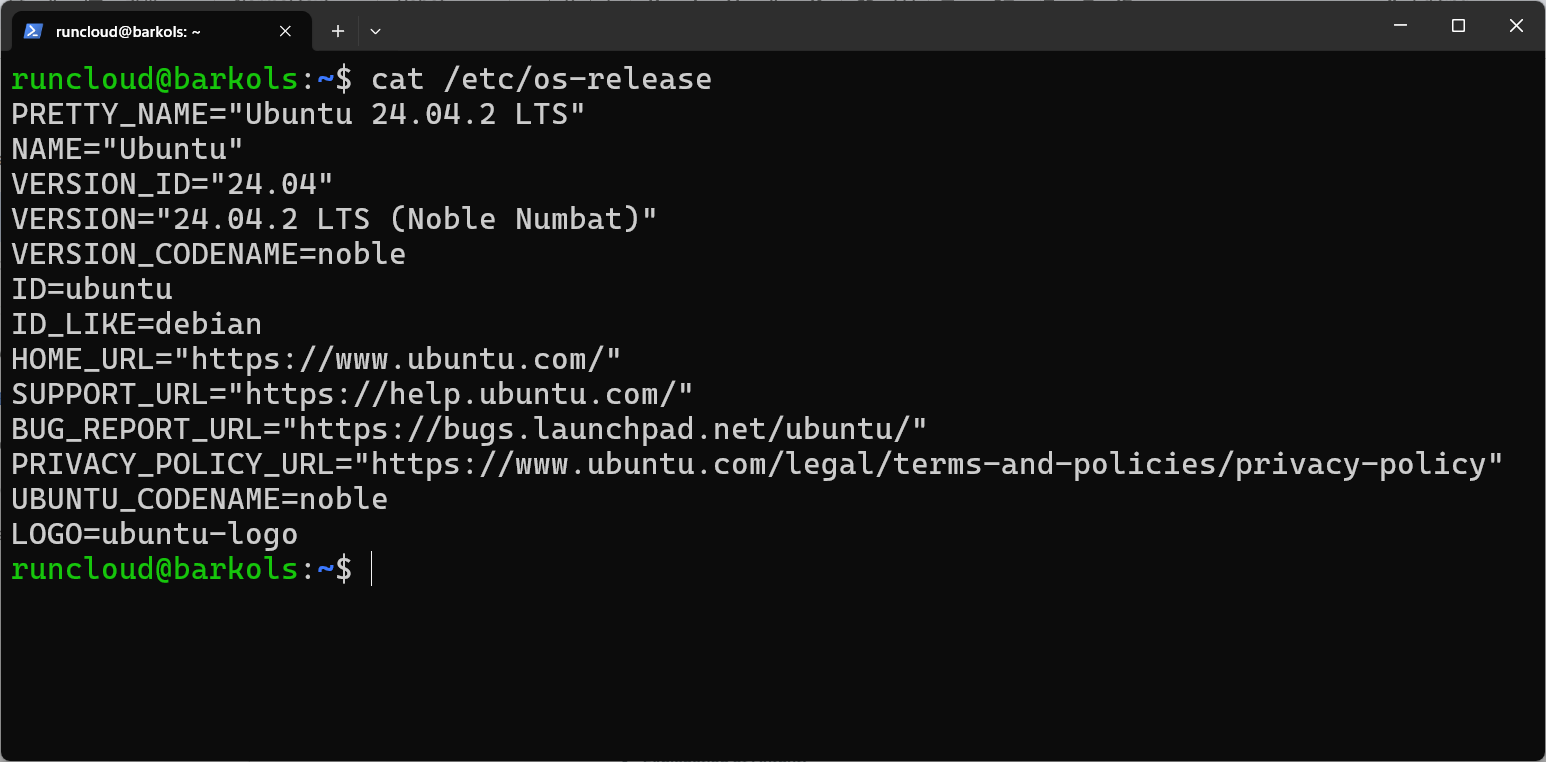
    cat /etc/os-release

    The cat command is a classic utility used to display the contents of files. Here, you are asking it to show you what’s inside the os-release file located in the /etc directory.

    While that looks like a lot of information, you only need to focus on one line. The PRETTY_NAME variable gives you exactly what you need in a clean, easy-to-read format: “Ubuntu 24.04 LTS”.

    Bonus Tip: Checking Your System Architecture (32-bit or 64-bit)

    Knowing your Ubuntu version is important, but sometimes it’s only half the story. When you visit a software download page, you will often see different files listed for the version and the architecture. This refers to the type of processor your computer uses. Installing software built for the wrong architecture will simply not work, so it’s an essential piece of information to have.

    Thankfully, finding your system’s architecture is as easy as finding its version. In your terminal, run the following command:

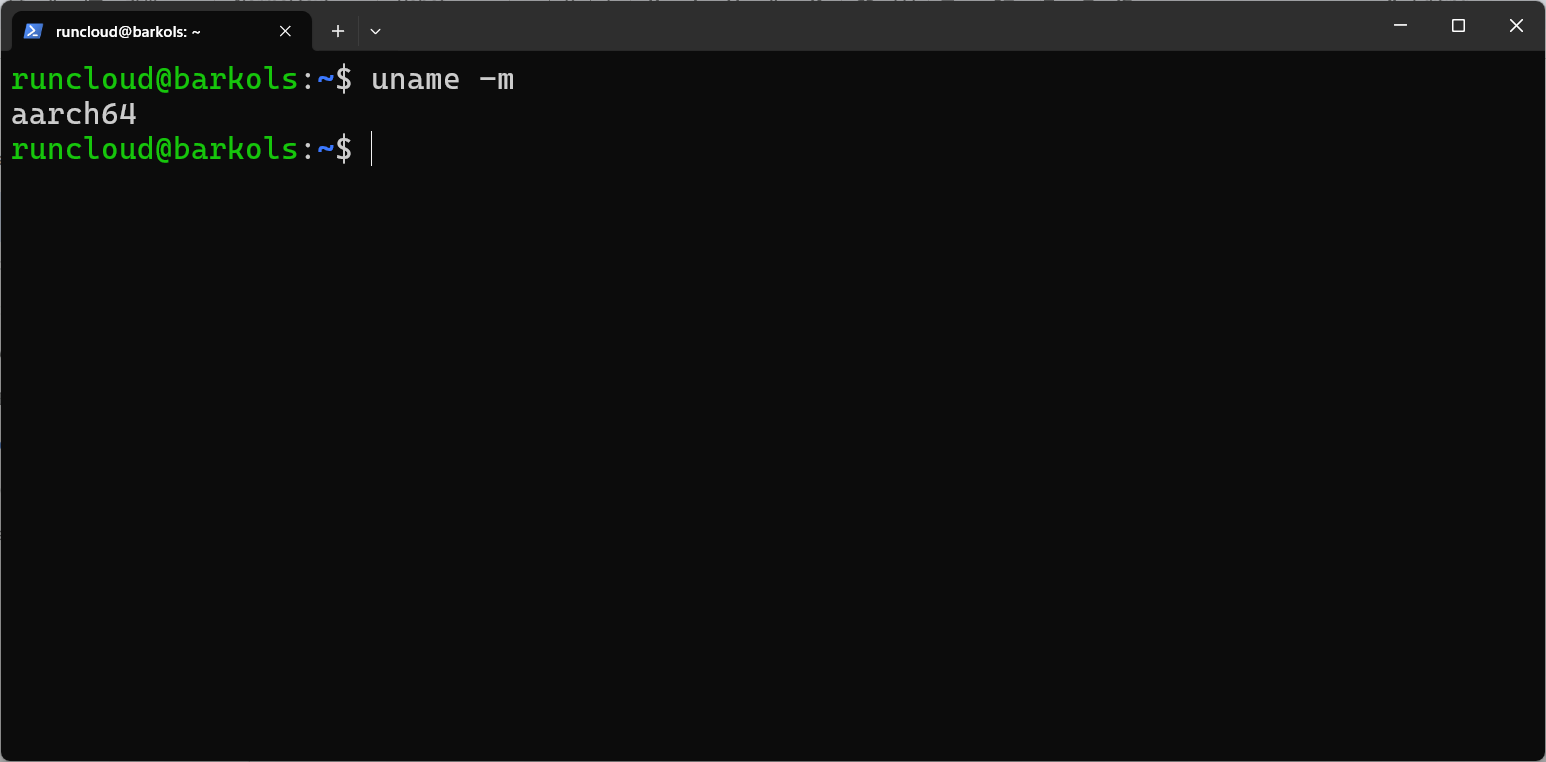
    uname -m

    On most modern desktop and laptop computers, the command will almost always output: x86_64. This indicates you are running a 64-bit system. You will often see this referred to as amd64 in software package names.

    However, you might encounter a different output, especially on cloud servers or single-board computers like the Raspberry Pi. For example, we see a different result when we run this command on our cloud server managed by RunCloud:

    An output of aarch64 (or sometimes arm64) indicates that the server uses an ARM-based processor. Many people and cloud providers now choose ARM because these processors are designed to be extremely power-efficient. This efficiency means they consume less electricity to perform their tasks, directly translating into lower operational and hosting costs.

    So, if you’re using a modern, cost-effective cloud server, don’t be surprised to find it’s running on an ARM architecture.

    Combining your version (24.04 LTS) with your architecture (x86_64 or aarch64) gives you all the information you need to download the correct software package every time.

    If you are a RunCloud user, you can get this information directly from your server dashboard summary:

    Ubuntu Version Reference Cheat Sheet

    What you want to knowThe command to use
    Full Version Detailslsb_release -a
    Human-Readable Versioncat /etc/os-release
    System Architectureuname -m

    Final Thoughts

    Whether you prefer the visual approach of clicking through the Settings panel or the speed of typing a quick command in the terminal, you can now instantly find both your Ubuntu version and system architecture.

    Knowing your system’s details is the first step to becoming a more confident and capable Ubuntu user.

    Do you have a favorite method or a useful tip we didn’t cover? Let us know in the comments below!

    If you manage one or more servers, there’s an even easier way. Constantly logging in to a terminal just to check basic stats can be time-consuming. RunCloud allows you to directly check the Ubuntu version of your server from the RunCloud dashboard, alongside other critical server health information. RunCloud makes it incredibly easy to manage your Linux servers by providing a clean, powerful interface for tasks that would otherwise require complex command-line work.

    Ready to take the complexity out of managing your Linux servers?

    Sign up for RunCloud today and see how effortless server management can be.

  • How to Migrate Your Server with (Near) Zero Downtime

    How to Migrate Your Server with (Near) Zero Downtime

    Server migration doesn’t have to be stressful. Whether you’re upgrading hardware, switching providers, or changing location, the process should be strategic, not risky.

    Server migrations are necessary for any growing application to move to more powerful hardware, a better network, or a more strategic geographic location. However, this migration often requires some downtime to move things over successfully.

    At RunCloud, we believe migrating your entire infrastructure shouldn’t be a gamble. It should be a strategic, controlled, and predictable process.

    In this guide, we’ll provide you with step-by-step instructions for moving your servers with minimal, and in many cases, virtually zero, user-facing downtime.

    Let’s get started!

    Phase 1: Preparing For Server Migration

    You might already know this, but the key to a successful migration is 90% preparation. Rushing this phase is the single most common cause of failure. Follow the steps below to start the migration process:

    Configure DNS TTL

    Your Domain Name System (DNS) records are the internet’s address book. When users type your-app.com, DNS tells their browser which server IP to connect to. Most computers store this information for an extended period to avoid making the same requests repeatedly. This isn’t a problem as these records are seldom updated. However, you will need to update these records when migration starts.

    Therefore, at least one week before your planned migration, you must lower the Time-To-Live (TTL) value on your relevant DNS records (typically the ‘A’ record for your domain and subdomains). The TTL tells resolvers how long to remember the IP address before asking for it again. A standard TTL might be 24 hours; you want it as low as possible for a migration.

    Set your TTL to the lowest value your provider allows. On platforms like Cloudflare, the minimum is 2 minutes (120 seconds). This ensures that when you finally “flip the switch,” the global change will propagate with incredible speed, minimizing the window where some users might still be directed to the old server.

    For more information, we recommend reading our blog post, “How to Speed Up DNS Propagation”.

    Exception for Cloudflare Proxy Users: It is important to note that if you are using Cloudflare’s orange-cloud proxy service (not the “DNS Only” grey-cloud mode), this step is unnecessary. Because all traffic is already routed through Cloudflare’s network, they control the IP change internally. When you update the IP in your Cloudflare dashboard, the change is virtually instantaneous for your users.

    Create New Server Environment

    Before you can move your data, you must build an identical environment on the new server. This can sometimes take significant effort as manually installing NGINX/Apache, multiple PHP versions, Redis, Supervisor, and editing configurations can be challenging.

    This is precisely where RunCloud transforms a multi-day headache into a few clicks.

    1. Provision Your New Server: Get a fresh server from your favorite provider (DigitalOcean, AWS, Vultr, etc.).
    2. Connect to RunCloud: Instead of SSH’ing in and running complex setup scripts, you simply connect your new server to your RunCloud account. RunCloud automatically installs and configures a highly optimized server stack (your choice of NGINX or OpenLiteSpeed, MariaDB, multiple PHP versions, Redis, Memcached, and more).

    If you want step-by-step instructions for this process, refer to our help documentation article that outlines the getting-started process. Once the core server is ready, you will need to recreate the application-specific environments on the server.

    If you have several web applications, manually creating each one, along with their specific PHP versions, system users, databases, and cron jobs, is tedious and prone to human error.

    Using RunCloud, you can compile a complete list of your web applications, database names, and cron jobs. You can then loop through that list and execute API calls to replicate the entire structure on your new server.

    If you want to learn more, refer to our official documentation, where we explore how to automate and build web applications with the RunCloud API.

    Phase 2: Copying Files and Databases to the New Server

    After creating a replica of your environment on the new server, it’s time to move the actual data.

    Syncing Web Application Files with rsync

    We have already written an in-depth article that explains 3 Free Ways To Migrate WordPress From Shared Hosting To Cloud Server, but if you are in a hurry, then you can use rsync, which is a powerful and versatile command-line utility designed for efficiently synchronizing files and directories between two locations.

    Initial Sync: You will perform an initial, comprehensive sync of your web application files from the old server (Server A) to the new one (Server B). A typical command looks like this:

    rsync -avz /old/path/ user@new-server-ip:/home/runcloud/webapps/my-app/

    Let’s understand the different options in the above command:

    • -a (archive mode): This option creates an archive of the source.
    • -v (verbose): This flag tells rsync to give you detailed output. As it runs, it will list every file being transferred, which is extremely helpful for monitoring progress and diagnosing issues. You might remove this flag for a cron job to keep logs clean.
    • -z (compress): This instructs rsync to compress the file data before sending it across the network. The destination server then uncompresses it. This significantly reduces network bandwidth usage and can dramatically speed up the transfer, especially for text-based files like code (PHP, HTML, CSS, JS).
    • --delete (optional): This option is useful for creating a perfect mirror. It tells rsync to delete any file from the destination directory if that file does not exist in the source directory. This is essential for a clean migration, as it removes old temporary files, logs, or user-uploaded content that has since been deleted from the live site.

    ⚠️ Word of Caution: Use the –delete flag with care. Always double-check that your source and destination paths are correct. If you accidentally reverse them, this flag would wipe out your source directory!

    • The destination path: user@new-server-ip:/home/runcloud/webapps/my-app/ specifies where the files should be sent. It’s composed of these parts:
      • user: The username on the new server that has permission to write to the destination directory.
      • new-server-ip: The IP address (or a resolvable hostname) of the new server you are migrating to.
      • The colon (:) is the separator that divides the remote user/host information from the file path on that remote machine.
      • /home/runcloud/webapps/my-app/: This is the absolute path on the destination server where the files will be placed.

    If your web application has frequent file uploads or changes, it is possible that its data will change by the time the migration is finished. In this case, you can set up a cron job on your old server to run this rsync command incrementally (e.g., every 5 or 10 minutes). rsync is incredibly efficient and will only transfer the files that have changed, keeping the new server’s content almost perfectly in sync with the old one.

    Database Migration

    This is the most sensitive part of the migration. A mistake here can lead to data loss. The goal is to get a live, real-time copy of the database running on the new server before the final cutover. The strategy you choose will depend entirely on the size of your database and how frequently it is updated.

    Method 1: The Classic Dump and Import (For Simple Sites)

    The simplest way is often the best for websites with minimal data or where content and user activity are infrequent. You can use the built-in mysqldump command to export your entire database into a single .sql file. You can then run the provided command on the new server to import this data.

    This method is very useful if you have minimal data. To transfer the exported file, you can even use rsync to make a fast and reliable copy. This approach is perfectly acceptable when the risk of new data being written between the time you export and import the database on the new server is very low.

    Method 2: Live Replication for Active, High-Traffic Sites

    If you are running a busy e-commerce store or an active community forum, then the classic dump-and-import method might not be suitable. The database might get updated several times in the window it takes to move the SQL dump to the new server and restore it. This gap will inevitably lead to lost transactions and customer data.

    A word of extreme caution: while you might be tempted to rsync your raw MySQL/MariaDB data directory, this is extremely dangerous for a live database and will almost certainly lead to corruption. Copying the core database files while the service is running will result in an inconsistent, broken state on the destination server.

    The recommended method to migrate the database is by establishing Master-Slave (or Primary-Replica) Replication. This process creates a live, continuously updating mirror of your database on the new server. Here’s how it works conceptually:

    1. Setup: Configure your old database server (Server A) as the “Master” and your new database server (Server B) as the “Slave”.
    2. Initial Data Dump: You’ll take a consistent snapshot of the master database that captures the precise replication position from the server’s binary log.
    3. Start Replicating: After importing this initial dump onto the slave server, you instruct it to connect to the master and begin replicating from the captured position. From this point forward, any change made to the database on Server A (new users, blog posts, sales orders) is automatically and instantly copied to the database on Server B.
    Master slave configuration for database migration

    This leaves you with a live, read-only, up-to-the-second copy of your production data on the new server.

    The complete, step-by-step process of setting up database replication is a detailed technical procedure and is out of scope for this article. However, we strongly recommend you read:

    Database Migration for AWS Users

    If your servers are within the AWS ecosystem, you can consider using the AWS Database Migration Service (DMS). It acts as an intermediary that connects to your source and destination databases. DMS handles the initial load and then captures ongoing changes (Change Data Capture – CDC) to keep the two in continuous sync.

    Migrating Custom Configurations

    After migrating the files, you need to check:

    • If you have added a custom NGINX include file to handle special redirects.
    • If you modified your php.ini file to increase memory limits or execution times for a demanding script

    These small, often-overlooked configuration files are the unique DNA of your server’s behavior; they are vital and must be moved to the new server to ensure your applications function correctly after the migration.

    This is where the benefit of a standardized environment provided by RunCloud becomes incredibly clear.

    On a manually configured server, these critical files can be scattered across numerous directories, making finding and backing them up a tedious and error-prone scavenger hunt.

    RunCloud eliminates this chaos by providing a user-friendly GUI-based dashboard for all your custom configurations. This standardization makes your custom files easy to locate, backup, and copy to the identical path on your new server, guaranteeing a consistent environment and ensuring that the nuanced rules that make your application work perfectly are never left behind.

    You can refer to the following documentation articles to quickly configure your new server environment and set custom configurations:

    1. Changing PHP Memory Limit
    2. Enable or Disable PHP Functions
    3. Set NGINX Reverse Proxy
    4. Configure CORS on NGINX
    5. How to Configure NGINX Log Rotation

    RunCloud empowers you with the flexibility to manage your server through either our intuitive graphical dashboard for individual tasks or our powerful API for mass automation.

    For example, changing a single site’s PHP version is a simple click in the dashboard, while using the API allows you to programmatically update the PHP version for all your applications at once, ensuring you always have the most efficient tool for the job.

    Phase 3: Flipping the Migration Switch for a Seamless Cutover

    If you have followed all the steps, the final switch should be simple and controlled if everything has been set up properly. Once you are ready to migrate, follow the steps below:

    1. Initiate Maintenance Mode (Optional, But Recommended): Briefly put your application on the old server in “maintenance mode”. This prevents new data from being written in the final minutes before the switch, ensuring 100% data integrity. Read our article on How to Temporarily Disable Your Web App or Show a Maintenance Page to learn more.
    2. Perform a Final Sync: Run your rsync command one last time to catch any last-second file changes.
    3. Promote the New Database: If replication is used, this is the most important step. You will stop the replication process and promote your “Slave” database on Server B to be the new “Master”. It is now the primary, writable database.
    4. Update Application Configurations: Point your application’s configuration file to the new server to use the local database (localhost). At this point, you will ensure that the applications on the new server can use the new database to make requests.
    5. The DNS Switch: Finally, you will need to go to your DNS provider (e.g., Cloudflare) and change the IP address in your ‘A’ record from the old server’s IP to the new server’s IP. After the DNS records are updated, your new website should be automatically visible to your visitors, as the new site’s maintenance mode was never enabled.
    6. Verify: Thanks to your low TTL, the change should occur within minutes. Start testing your domain. Check that it resolves to the new IP and that the application is fully functional.
    7. Decommission: Do not shut down the old server immediately! Leave it running for 24-48 hours as a safety net. Once you are confident that the new server is stable and handling all traffic, you can safely power down and delete the old server.

    After Action Report

    This article explains why server migration is a complex dance of DNS, environment replication, data synchronization, and precise timing. While the process requires careful planning, the right tools can eliminate most of the manual labor and risk.

    RunCloud is designed to make this process easier.

    We automate the most complex and error-prone aspects of server setup and configuration so that you can focus on your code. Here’s how:

    • We provide a powerful API that allows you to script the recreation of your entire application infrastructure.
    • We offer a stable, secure, and predictable environment in which you can confidently perform the sensitive data synchronization steps.
    • We make it easy to test changes by creating a WordPress staging environment with a single click.

    Want to make migrations less painful? Try RunCloud for easier, automated server management.

    Frequently Asked Questions (FAQ) for Server Migration

    Is a zero-downtime server migration possible?

    While achieving zero downtime is technically challenging, a “near-zero” downtime migration is achievable with proper planning. By synchronizing files and databases in real-time before the final DNS switch and using a very low DNS TTL, the cutover period can be reduced to just a few minutes.

    Why should I lower my DNS TTL before a server migration?

    Lowering your DNS Time-To-Live (TTL) value a week before migration is an important preparatory step. A low TTL, such as 2 minutes, tells web browsers and resolvers to check for your server’s IP address more frequently, ensuring that when you finally point your domain to the new server, the change spreads across the internet rapidly.

    How can I move a live MySQL database with minimal downtime?

    The safest and most effective method for moving a live MySQL or MariaDB database is establishing master-slave (or primary-replica) replication. This technique creates a perfect, real-time, synchronized copy of your database on the new server while the old one remains active. This allows you to instantly switch to a fully up-to-date database on migration day, preventing data loss.

    What is the safest way to copy website files to a new server?

    The industry-standard tool for safely copying website files is rsync, a command-line utility that efficiently synchronizes directories. For a minimal downtime migration, you should perform an initial full sync and then set up a cron job to run rsync incrementally. This ensures that any last-minute file changes on the old server are automatically copied to the new server right up until the final cutover.

    How does RunCloud make server migration easier?

    RunCloud dramatically simplifies server migrations by automating the most tedious and error-prone step: setting up the new server. Instead of manually installing and configuring NGINX, PHP, and databases, RunCloud provides an optimized, secure server that can be installed in minutes. Furthermore, its powerful API allows you to programmatically recreate all your web applications and cron jobs, saving dozens of hours of manual work.

    Do I need to change my DNS TTL if I use Cloudflare’s proxy (orange cloud)?

    No, you do not need to manually lower your DNS TTL if you use Cloudflare’s proxy service (the “orange cloud”). Because all your traffic is routed through Cloudflare’s network, they handle the IP address switch internally. When you update the IP in your Cloudflare dashboard, their system propagates the change to your users almost instantaneously.

  • How to Fix WordPress HTTP Error When Uploading Images (Quick Guide)

    How to Fix WordPress HTTP Error When Uploading Images (Quick Guide)

    Running into the “HTTP error” when uploading images to WordPress is frustrating, especially when everything else seems to be working fine.

    There’s no detail in the message, no hint at the cause, and no obvious fix. It could be a plugin conflict, a server setting, or something else entirely.

    This quick guide walks you through the most common causes and reliable fixes. Whether you’re a beginner or managing multiple sites, you’ll be able to get uploads working again in minutes.

    What is the WordPress HTTP Error When Uploading Images?

    The WordPress HTTP error is a common issue when uploading an image or video to the media library fails. Unfortunately, this error message is generic and doesn’t pinpoint the exact cause, making troubleshooting tricky.

    This error message signals that something went wrong during the upload process, but WordPress couldn’t determine the reason. When you’ve found the perfect image and are suddenly faced with a vague error message, it can be very frustrating to have your workflow interrupted.

    📖 Suggested read: How to Fix WordPress Revisions Not Showing [SOLVED]

    Common Causes of the WordPress HTTP Error

    Many things can trigger the WordPress HTTP error when uploading images. These errors can be caused by either client-side issues (like your browser or internet connection) or server-side problems (related to your hosting environment or WordPress configuration).

    One of the most common causes of this error is insufficient memory to handle the upload process. If you are using image optimization or security plugins, this can also cause plugin or theme conflicts and interfere with media uploads.

    Additionally, if you haven’t configured your WordPress settings correctly, you can encounter issues like incorrect file permissions for the uploads directory, an outdated PHP version, or problems with image processing libraries like Imagick. Sometimes, the problem can be as simple as a temporary glitch in your browser’s connection to WordPress or an expired login session.

    It is possible that the specific image file itself is causing the WordPress HTTP error. WordPress and web servers have limits on the maximum size of a file that can be uploaded; if your image exceeds this limit, the upload will fail. Depending on your hosting provider’s settings, this limit can range from a few megabytes to much larger. You can check your site’s current upload limit in your WordPress dashboard’s Media > Add New section.

    The type of file you’re trying to upload matters as well. WordPress has a default list of permitted file types for security reasons. If you attempt to upload a file format that isn’t on this allowed list (e.g., trying to upload a .tff font file or an .svg file without specific configuration), you’ll likely encounter an error.

    Finally, how you name your image files can also lead to upload failures. Depending on your WordPress instance, file names containing special characters (like $, *, &, #, %, @, !, etc.), accent marks, spaces, or unusual punctuation can cause issues with the WordPress media library. It’s always best to use simple, web-friendly file names consisting only of letters, numbers, and hyphens to avoid such problems. For instance, a filename like “my-awesome-image-1.jpg” is much less likely to cause an error than “My Awesome Image #{1}.jpg”.

    📖 Suggested read: How to Fix WordPress Stuck in Maintenance Mode? [100% WORKING]

    Step-by-Step Solutions to Fix the WordPress HTTP Error

    If you encounter the WordPress HTTP error while uploading images, you can try the following solutions to solve this problem:

    #1 – Refresh and Re-log in to WordPress

    Before diving into more complex fixes, it is a good idea to try the simplest one first. Refresh the page and try uploading the image again. Sometimes, temporary browser glitches or a brief loss of internet connectivity can cause the HTTP error.

    If refreshing doesn’t work, log out of your WordPress admin area and log back in, as your login session might have expired, leading to a security token mismatch that prevents uploads.

    #2 – Resize or Rename Your Image Files

    As we mentioned above, large image files can exceed your server’s upload limits, triggering the HTTP error. To solve this, you can try reducing the image’s dimensions or compressing its file size using an image editor before uploading.

    If you’re looking for WordPress plugins to do this, we recommend reading this excellent article from Patchstack on the best WordPress image optimization plugins.

    Additionally, ensure your image file names don’t contain special characters, spaces, or accents, as these can cause conflicts; rename files using only letters, numbers, and hyphens (e.g., my-new-image.jpg).

    In the past, we have also noticed that some poorly configured firewall rules block images with names that contain certain sensitive words. So, if your image name contains the phrase wp-login.php or wp-admin, you should consider renaming it to something else and trying again.

    #3 – Deactivate Plugins and Themes Temporarily

    Updating a plugin or theme in the background can easily cause a WordPress HTTP error. To check for this, temporarily deactivate all your plugins and try uploading the image; if it works, reactivate the plugins individually, testing after each, to find the problematic one.

    If plugins aren’t the issue, switch to a default WordPress theme like Twenty Twenty-Four to see if your current theme is causing the error.

    #4 – Increase PHP Memory Limit for WordPress

    WordPress and its plugins require a certain amount of server memory (RAM) to function correctly. If an image upload process demands more memory than allocated, it can result in an HTTP error.

    The exact step to modify this limit will vary depending on your hosting environment. Some hosting providers allow you to set this limit by defining the WP_MEMORY_LIMIT variable in the wp-config.php file, whereas others require you to modify the memory_limit directive in the php.ini file.

    However, if you are using RunCloud, this can be done with just a single button.

    Read the following documentation page to learn how RunCloud users can adjust PHP memory limits through their server management panel.

    #5 – Check and Fix Uploads Folder Permissions

    Linux servers assign specific permissions to each file and folder on your server. If you have configured incorrect file permissions on your wp-content/uploads folder, it can prevent WordPress from writing files to it.

    By default, the directory permissions should be 755 or 744, and individual file permissions should be 644. You can check and change these permissions using an FTP client or your hosting control panel’s file manager.

    If you are using RunCloud, you can resolve file permissions issues with a single click by going to Tools > Fix Ownership.

    #6 – Update PHP Version and Server Settings

    You might already know this, but running an outdated version of PHP can lead to various compatibility issues, including the HTTP error during image uploads. Ensure your server is using a recent, stable PHP version recommended by WordPress.

    The exact steps to change your PHP runtime will vary depending on your operating system and hosting provider. However, if you are using RunCloud, you can easily update the PHP runtime of your WordPress application by going to Settings > PHP Version and simply selecting from the dropdown list.

    Additionally, if you need to use an outdated version of PHP for your website, then RunCloud also provides a secure way to use EOL PHP runtimes without compromising the security of your other web applications.

    #7 – Temporarily Disable Security Modules

    If your web server uses security modules like mod_security (an Apache module) or Content-Security-Policy (CSP) to block suspicious activity, these can occasionally misinterpret legitimate image uploads as a threat and block them, resulting in an HTTP error.

    If you suspect this is the issue, you can temporarily disable the necessary security module and try again.

    However, disable security features cautiously and only temporarily for testing, as they are important for your site’s protection.

    We recommend consulting your host before making these changes, as they can have a lasting impact on your website.

    If you want to learn more about this, we recommend reading our previous post on using mod_security and OWASP for a web app firewall (WAF) to secure your website.

    #8 – Use FTP or Add From Server Plugin as a Last Resort

    Note: This is a workaround rather than a direct fix for the HTTP error, but it can be a lifesaver when you’re in a hurry.

    If all other troubleshooting steps fail and you urgently need to upload images, then you can bypass the WordPress media uploader by using an FTP client (like FileZilla) to upload images directly to a temporary folder on your server. Read our previous articles to learn how to do this effectively.

    After uploading via FTP, the images will not show up automatically in your WordPress dashboard, and you will need to run a specific WordPress command to register these images with the WordPress media library so they appear within your dashboard. ​

    After logging in to your server via SSH, you can run the wp media import ~/picture.jpg command from your WordPress installation directory. This command instructs WordPress to scan the specified path (in this example, a file named picture.jpg within the home directory) and import it into the Media Library.

    If you have uploaded the image to a different directory, you can simply replace the ~/picture.jpg with the path of your image file. You can specify the exact path to a single image file or use wildcards like * to match and import multiple images simultaneously.

    After executing the above command, you will receive a confirmation message for each image imported into the WordPress media library.

    📖 Suggested read: How to Fix the WordPress HTTP 500 Internal Server Error (Easy)

    Why Choose RunCloud for WordPress Hosting and Support?

    RunCloud is a powerful server management panel that simplifies WordPress hosting, development, and maintenance, especially when tackling issues such as the HTTP error during image uploads.

    RunCloud provides developers and agencies with the tools they need for efficient workflows. By offering a suite of specialized features, RunCloud ensures your WordPress sites run smoothly, securely, and are easy to manage. Here are a few reasons why you should use RunCloud to manage your servers:

    Reason 1: Expert WordPress Support for Troubleshooting Errors

    • Simplified Problem Isolation: RunCloud offers a clean and controlled server environment, which makes it easier to pinpoint the causes of WordPress errors, including the HTTP error.
    • Staging Environments: RunCloud allows you to easily create WordPress staging environments. These allow you to test solutions for errors like the HTTP upload issue, experiment with PHP versions, or try deactivating plugins without affecting your live site, significantly reducing the risk of breaking things.
    • Access to Logs: RunCloud provides straightforward access to server logs, which are invaluable for diagnosing complex WordPress errors that don’t provide much information on the front end.

    Reason 2: Optimized Server Performance for Seamless Image Uploads

    • Optimized Stack: RunCloud configures your server with an optimized stack (e.g., NGINX, Apache, various caching options like Redis or Memcached) out of the box. This ensures your WordPress site has the resources and speed needed for smooth operations, including handling image uploads efficiently and reducing the likelihood of HTTP errors caused by resource limitations.
    • Easy Resource Scaling: If insufficient server resources are causing upload errors, RunCloud makes it simpler to manage your server resources or to guide you if you need to upgrade your server plan with your chosen cloud provider (like DigitalOcean, Vultr, AWS, Google Cloud, etc.).
    • PHP Version Management: The RunCloud dashboard makes it easy to switch and manage multiple PHP versions. This is important for ensuring compatibility with the latest WordPress versions and for resolving HTTP errors that might stem from outdated or problematic PHP versions.

    Reason 3: Easy Management and Advanced Security for WordPress Sites

    • User-Friendly Interface: RunCloud provides an intuitive dashboard that simplifies complex server management tasks, such as setting up new WordPress sites, managing databases, and configuring SSL certificates, even for non-Linux experts.
    • Git Integration and Deployment: For developers, RunCloud supports WordPress deployment via Git. This means you can version control your WordPress projects, including themes and plugins, and deploy changes systematically from your Git repository to your staging or production environments, streamlining your development workflow and making rollbacks easier.
    • Team Collaboration and Permissions: RunCloud facilitates teamwork by allowing you to assign specific permissions to team members for different servers and applications. This granular control ensures that colleagues or clients only have access to what they need, and changes can be tracked, enhancing security and accountability.
    • Security Features: RunCloud implements various security measures, including easy SSL certificate deployment (Let’s Encrypt), firewall management, and regular security updates for server packages. This proactive approach helps protect your WordPress sites from threats that could otherwise lead to errors or downtime.

    📖 Suggested read: The Complete WordPress Speed Optimization Guide

    Wrapping Up: Fixing WordPress HTTP Errors When Uploading Images

    In this post, we have provided you with several solutions to resolve the HTTP error in your WordPress installation. By working through the solutions above, you should be able to restore your site’s media uploading functionality and get back to creating engaging content.

    Your hosting environment plays a crucial role in ensuring that your WordPress site runs smoothly and that image handling is optimized. RunCloud significantly simplifies the management of these aspects.

    For instance, RunCloud supports Imagick, a powerful image processing library that WordPress can use to improve image manipulation and quality. RunCloud also uses various caching mechanisms (such as Redis or Memcached), dramatically speeding up your website’s loading times by serving optimized images and content more efficiently.

    One of RunCloud’s most valuable features for troubleshooting and development is its provision for WordPress staging environments.

    Before you apply any fix for the HTTP error, update PHP, or change critical settings on your live website, you can test everything in a safe, isolated staging copy. This allows you to confirm that your changes work as expected and don’t introduce new problems.

    Ready to take control of your WordPress hosting and eliminate frustrating errors for good?

    Sign up for RunCloud today and streamline your WordPress management.

    FAQs on the WordPress HTTP Error When Uploading Images

    Why does WordPress show HTTP errors when uploading images?

    WordPress displays a generic HTTP error when it encounters an issue during the image upload process that it can’t specifically identify. This could be due to insufficient server resources, such as memory limits, incorrect file permissions, or temporary server-side glitches.

    How do I increase the upload size limit in WordPress?

    You can increase this limit by modifying directives like upload_max_filesize and post_max_size in your server’s php.ini file or via .htaccess. With RunCloud, managing these PHP settings for your WordPress sites is straightforward through your control panel, simplifying the adjustment.

    Will changing my theme or plugins fix the HTTP error?

    Potentially, yes, if a theme or plugin is poorly coded and consumes excessive server resources or interferes with the upload process. Temporarily deactivating them can help isolate if one is the culprit behind the HTTP error.

    Can server issues cause the HTTP error in WordPress?

    Absolutely. Server-side problems such as insufficient PHP memory limits, low disk space, or outdated PHP versions are common culprits for the HTTP error. A platform like RunCloud helps you easily manage server configurations and resources to prevent such issues.

    What is the best way to optimize images for WordPress uploads?

    The best approach is to compress images before uploading using tools or plugins to reduce file size without significant quality loss. Choosing appropriate formats like WebP or JPEG for photos and ensuring dimensions are suitable for web display also significantly helps.

  • How to Identify and Kill Queries with MySQL Command-Line Tool

    How to Identify and Kill Queries with MySQL Command-Line Tool

    Is your application slow? Are users complaining about lag? This slowdown might be because your MySQL server is struggling under the weight of a long-running or problematic database query.

    When your WordPress site or web application relies heavily on its database (and most do!), a single poorly performing query can have a massive impact.

    Although many third-party tools are available to help with specific problems, in this article, we will use the built-in MySQL command-line tool, which offers a direct, powerful, and quick way to diagnose these issues.

    We’ll guide you through using the command line to:

    1. View currently running processes using SHOW PROCESSLIST.
    2. Identify the specific slow query or problematic process ID.
    3. Safely terminate (KILL) the query when required.

    Let’s get started!

    Prerequisites

    Before you can manage MySQL queries, you’ll need to ensure that you have the necessary access and permissions on your server. You’ll need the following:

    1. Shell access to your server
    2. MySQL user account with specific privileges. For administrative tasks like this, it is common to use the MySQL root user as it has all the necessary privileges.

    How to Kill MySQL Queries via Command Line

    Step 1: Connecting to Your MySQL Server via Command Line

    You can access the MySQL command-line interface via SSH once you’ve connected to your server. The most common way to connect locally is using the MySQL root user. Open your SSH terminal and execute the following command:

    mysql -u root -p   

    Let’s break this down:

    • mysql: Invokes the MySQL command-line client program.
    • -u root: Specifies that you want to log in as the MySQL user named root. Replace root if you are using a different administrative MySQL user.
    • -p: Tells the client to prompt you for the password. It’s more secure than typing the password directly in the command line.

    📖 Suggested read: How to Change/Reset MySQL Root Password on Ubuntu Linux?

    After running this command, you’ll be prompted to enter a password. Paste or type the MySQL root password you retrieved from your RunCloud dashboard. You’ll be greeted with the MySQL monitor prompt (mysql>) if the credentials are correct.

    Step 2: Viewing Running Processes in MySQL

    Now that you’re connected to your MySQL server via the command line, you can run the SHOW PROCESSLIST command to get a snapshot of all the active connections (threads) to your database server and what they are doing at that precise moment. Simply type the following at the mysql> prompt and press ‘Enter’:

    SHOW PROCESSLIST;

    While this command is useful, it truncates the actual SQL query being executed in the ‘Info’ column. For more effective troubleshooting, especially when dealing with complex or long queries, it’s highly recommended to use the extended version:

    SHOW FULL PROCESSLIST;

    The FULL keyword allows you to see the complete SQL statement, which is necessary for diagnosis.

    The output of either command presents a table with several columns, and understanding these columns is key to identifying problematic queries:

    • Id: This is the unique identifier for the connection thread. You will need this number later if you decide to terminate a query or connection using the KILL command.
    • User: Shows the MySQL username associated with the connection thread. This helps you trace the query back to a specific application user or system process.
    • Host: Displays the hostname or IP address (and port) from which the connection originates. This is useful for identifying queries coming from specific application servers, cron jobs, or even unexpected locations.
    • DB: This column indicates the thread’s current default database. If no database is selected, it will be NULL.
    • Command: Describes the type of command the thread is currently executing. For example, the query command means that the thread is actively executing an SQL statement.
    • Time: This is one of the most important columns for performance troubleshooting. It tells us the amount of time (in seconds) that the thread has spent in its current state. For ‘Query’ states, a high ‘Time’ value is a strong indicator of a long-running, potentially problematic query.
    • State: This column provides more granular details about what the thread is doing within its current command. Some states are benign (starting, checking permissions), but others often point towards bottlenecks or issues:
      • System lock: The query is waiting to acquire a lock on a table or row currently held by another thread. This is a common cause of application hangs.
      • Sending data: The thread is processing and sending results back to the client. If this state persists for a long time, it might indicate a query returning a huge result set or network latency.
      • Writing to net: Similar to sending data, indicates network transfer activity.
    • Info: This column displays the actual SQL statement being executed by the thread.

    📖 Suggested read: SQLite vs MySQL vs PostgreSQL (Detailed Comparison)

    If you are using RunCloud, you can use the Slow Script Monitoring functionality from your RunCloud dashboard to identify slow database operations over time. This method is ideal for less technical users as it doesn’t require connecting to your server via SSH or performing any other command-line operations.

    An alternative method offers more flexibility for users comfortable with SQL.

    MySQL provides the PROCESSLIST table within the information_schema database. You can query this table directly using standard SQL SELECT statements to create powerful filters.

    For instance, to find all actively running queries (Query command) that have been executing for more than 60 seconds, and order them by the longest running first, you could use:

    SELECT id, info FROM information_schema.PROCESSLIST
    WHERE COMMAND = 'Query' AND TIME > 60
    ORDER BY TIME DESC;

    This approach can be very helpful on busy servers where the output of SHOW PROCESSLIST is overwhelming. You can pinpoint the threads causing performance degradation or blocking by carefully examining the process list output. Similarly, you can filter visually by ‘User’ or ‘Host’ if you suspect a particular application or job is causing trouble.

    📖 Suggested read: How to Connect a MySQL Database to PHP (A Developer’s Guide)

    Step 3: Analyzing the Query (Optional but Recommended)

    Before killing a slow or seemingly stuck MySQL query, it’s important to investigate the underlying cause first to ensure it doesn’t happen again. You can begin by copying the complete query text from the ‘Info’ column associated with the problematic process.

    Once you have this query text, the next critical step is understanding its execution plan. In a separate MySQL session, execute EXPLAIN <query_text>; to get an overview of your SQL command. Replace the <query_text> with the SQL statement you retrieved.

    This EXPLAIN command provides insights into how MySQL intends to execute the query. This can reveal potential bottlenecks, such as full table scans, which would indicate potentially missing indexes on columns used in WHERE or JOIN clauses, inefficient join types, or an unexpectedly high number of rows being examined.

    Fixing the underlying issue leads to long-term performance gains. For example, let’s assume optimizing a frequent query saves just 20% of its CPU time. That could mean your current server can handle significantly more traffic, or you might even be able to downsize to a smaller, cheaper AWS instance, which would directly save money while providing a faster experience for your users.

    📖 Suggested read: MariaDB vs MySQL – A Detailed Comparison & How You Should Choose

    Step 4: Killing the Query or Connection (KILL)

    Once you’ve identified a suspicious query using the command described above, you can use the kill command to terminate the thread and manually restore server performance.

    ⚠️ Warning: Always double-check that you are using the correct process ID obtained from SHOW PROCESSLIST before executing any KILL command. Terminating the wrong process can lead to unexpected application errors or data inconsistencies.

    KILL QUERY <process_id>;

    This is generally the preferred first attempt. This command tries to terminate only the specific statement that the thread is currently executing, leaving the connection itself open. This is less disruptive to the connecting application.

    For example, if process ID 12345 is running a slow query, you would run:

    KILL QUERY 12345;

    Remember that KILL QUERY might not take effect instantly if the thread is performing an operation that cannot be safely interrupted (like writing to disk). In such cases, it will wait until the thread reaches a point where it can be safely terminated.

    KILL CONNECTION <process_id>;

    If the KILL QUERY command doesn’t work or if you need to terminate the entire connection associated with the thread, you can forcefully terminate the connection. This terminates the statement and drops the client connection.

    KILL CONNECTION 12345;

    In the following example, we can see that the database forcefully terminated the connection from the client. Therefore, you should always use this command with caution as it can lead to unexpected errors.

    Step 5: Verifying the Kill

    After issuing a KILL QUERY or KILL CONNECTION command, you must confirm that it worked.

    The most straightforward way to do this is to run SHOW PROCESSLIST; again immediately. If the kill was successful, the process ID you targeted should no longer be in the list.

    Occasionally, you might see the thread you attempted to kill still listed, but with ‘Killed’ appearing in the Command column. This usually means MySQL has registered the kill request but hasn’t terminated the thread yet. This can happen if the thread is engaged in an operation that cannot be interrupted instantly, such as waiting for disk I/O or performing cleanup tasks.

    The thread will disappear shortly after showing the ‘Killed’ state. However, if you used KILL QUERY and the thread persists, it might indicate the query itself is resistant to termination in its current state. In such scenarios, you can use the more forceful KILL CONNECTION command to terminate the connection and release its resources.

    Important Considerations and Best Practices for Killing MySQL Queries

    While the MySQL command-line tool provides a direct way to manage running queries, using the KILL command should always be done thoughtfully and with an understanding of the potential repercussions.

    • Kill with Caution: Terminating queries, especially KILL CONNECTION, isn’t always clean. Be aware of the potential consequences:
      • Transaction Rollbacks: If you kill a thread executing Data Manipulation Language (DML) statements like INSERT, UPDATE, or DELETE within a transaction (particularly with InnoDB), the entire transaction will typically be rolled back to ensure data consistency. This might be desirable, but it’s important to understand it will happen.
      • Application Errors: Applications are often not designed to handle unexpected database connection drops. Killing a connection might result in application-level errors, incomplete operations, or confusing states for end-users.
      • Resource Cleanup: While modern storage engines such as InnoDB are good at cleaning up, forcefully killing threads can sometimes, albeit rarely, leave behind temporary tables or orphaned locks that might require manual cleanup later.
    • Don’t Kill System Threads: Exercise extreme caution when viewing the process list. You might see threads run by internal system users (e.g., system user, event_scheduler) or replication users (often named repl or similar). Avoid killing these threads unless you have a deep understanding of MySQL internals and are sure it’s necessary and safe, as doing so can disrupt essential background processes, break replication, or even lead to server instability.
    • Focus on Root Cause Analysis: Killing a query is almost always a temporary band-aid, not a permanent solution. The most important step after resolving an immediate performance crisis is to investigate why the query was slow or problematic in the first place. Was it due to missing indexes? Poorly written SQL? Inefficient application logic? A bad schema design? It is always recommended that the application code be analyzed to identify and fix the underlying issue. Otherwise, the problem is likely to recur.
    • Proactive Prevention with max_execution_time: You can consider setting the max_execution_time system variable. This allows you to define a timeout (in milliseconds). The server will automatically abort queries exceeding this time limit, preventing runaway read queries from consuming excessive resources.

    Final Thoughts

    Identifying and killing problematic queries manually using MySQL’s command-line tool is an essential skill for any serious developer or server administrator. Knowing how to spot performance bottlenecks quickly can save your application from crashes, downtime, and user frustration.

    But even with the right techniques, managing servers directly through the terminal takes time, demands technical expertise, and leaves too much room for human error.

    That’s where RunCloud can transform your workflow.

    RunCloud provides a simple, powerful platform that handles the heavy lifting of server management for you. Instead of spending hours troubleshooting MySQL issues through command-line sessions, you can:

    • Monitor server performance and database health visually through an intuitive dashboard
    • Use built-in Slow Script Monitoring to proactively catch issues before they affect users
    • Automate backups, deployments, and SSH alerts – all without touching the command line
    • Easily manage MySQL databases, users, and permissions without memorizing commands

    Thousands of developers and businesses already trust RunCloud to manage their mission-critical servers – and for good reason. It saves time, reduces stress, and gives you peace of mind that your applications are running at their best.

    Ready to experience better server management? Sign up for RunCloud today.

    Stop putting out fires. Start focusing on building, growing, and delivering better results – with RunCloud by your side.

    Frequently Asked Questions About Managing MySQL Queries

    Managing a MySQL server often raises important questions, especially when diagnosing slow queries or optimizing database performance. Below, we answer the most common questions developers and administrators ask about viewing, analyzing, and safely killing MySQL queries.

    How can I list only queries that are running longer than a certain time in MySQL?

    You can filter the information_schema.PROCESSLIST table directly. For example: SELECT id, user, time, info FROM information_schema.PROCESSLIST
    WHERE command = 'Query' AND time > 60;
    This shows queries that have been active for more than 60 seconds, making it easier to detect slow or stuck queries.

    Is it better to kill a query manually or let MySQL’s timeout settings handle it?

    In emergencies, manually killing a slow query is faster. However, using server settings like max_execution_time provides automatic safeguards to prevent long-running queries from becoming a recurring problem without human intervention.

    How often should I monitor running MySQL queries?

    In production environments, continuous automated monitoring is ideal. RunCloud’s Slow Script Monitoring can alert you to persistent slow queries without constant manual checks. Manual investigation should be triggered whenever performance drops or after major deployment changes.

    Can killing queries help fix “Too many connections” MySQL errors?

    Yes, selectively killing idle or stuck queries can immediately free up connections. However, this is a temporary fix. For long-term stability, you should also optimize your database configuration and connection pooling.

    Will killing a query cause data loss or corruption?

    Killing a query mid-execution won’t typically cause corruption if you use transactional storage engines like InnoDB. However, it may cause the current transaction to roll back, potentially undoing changes made during that session. Always investigate and resolve the underlying issue afterward.

    What’s the safest way to kill a problematic query?

    Use KILL QUERY <process_id>; first, as it only attempts to stop the active SQL statement without closing the entire database connection. If that fails or the thread is unresponsive, escalate to KILL CONNECTION <process_id>; to terminate the session.

    How can I prevent long-running queries in the future?

    Analyze your slow queries using EXPLAIN plans and optimize indexing, query structure, or application code. Additionally, set reasonable limits like max_execution_time and actively monitor performance metrics using tools such as RunCloud’s dashboard.


    Ready to simplify server management and focus on what matters most? Sign up for RunCloud and see why thousands of developers and businesses trust it for fast, secure, and reliable server operations.

  • The Ultimate Guide To Install NextCloud Using RunCloud

    The Ultimate Guide To Install NextCloud Using RunCloud

    NextCloud is a self-hosted productivity platform that offers industry-leading, on-premise content collaboration functionality.

    It’s an alternative to Dropbox or Google Drive, but with the advantage that it can be installed on your own server, ensuring that your data remains under your control.

    You can use NextCloud to share and collaborate on documents, send and receive emails, manage your calendar, and have video chats – all without any possibility of data leaks.

    In this post, we will show you exactly how to install NextCloud using RunCloud.

    Prerequisites

    You will need a server that meets NextCloud’s system requirements. When you connect your server to RunCloud, it automatically installs all necessary dependencies, and updates them. If you have an existing server connected to RunCloud, you can use that as well – as long as it has the necessary capacity to handle additional load.

    1. Create A PHP Web Application In RunCloud

    Go to your RunCloud dashboard and click “Deploy New Web App”. Next, switch to the “Empty Web App” tab and give your application a descriptive name.

    Deploy a web app

    For “Domain name“, you can either use your own domain name or use RunCloud’s test domain. If you are using RunCloud’s Cloudflare integration, RunCloud will automatically create the necessary DNS records for your domain.

    Set domain name on RUnCloud

    Next, select PHP version 8.1 and click “Deploy” to create the web application.

    set PHP RunCloud

    2. Prepare NextCloud Installer

    After deploying the application you will need to download the NextCloud installation file to your server. There are two ways to do this.

    2.1 Using SSH

    If you are comfortable with SSH then you can run the following commands to download the installation file to your website’s root directory. Don’t forget to update the path to your web application’s root directory (displayed in RunCloud dashboard).

    cd <path to root>
    wget https://download.nextcloud.com/server/installer/setup-nextcloud.php

    2.2 Using RunCloud File Manager

    The second method is to use RunCloud’s file manager. RunCloud has a graphical user interface for editing files on your server, and you can use this to add or remove files from your server. Click on the “File Manager” option to browse the files.

    RunCloud file manager

    Once you have opened the file manager, you should only see one file – index.html. Click on “New” and create a new file with the name setup-nextcloud.php.

    After the file has been created it will be displayed in the file manager. Click on it to edit the file – it will open a file editor in a new browser tab.

    create a file using runcloud file manager

    Download the installation file from https://download.nextcloud.com/server/installer/setup-nextcloud.php and open it in any text editor such as Notepad or VS Code. Press Ctrl + a to select all of the text, and Ctrl + c to copy it.Now go back to the RunCloud file editor and paste the text using Ctrl + v. Make sure to save the file afterwards.

    saving file in RunCloud

    3. Run NextCloud Installer

    After preparing your NextCloud installer, open the URL of your website in a web browser. By default you will see the “Welcome to RunCloud” message present in the index.html file. Go to the address bar of your browser and append /setup-nextcloud.php to the end of the URL.

    For example, if your website is located at www.example.com, you need to go to www.example.com/setup-nextcloud.php to start the installation.

    If you followed the steps correctly, you will be greeted with the following screen. Click on “Next” to move forward with the installation.

    Start Nextcloud installation

    On the next screen you will be asked to specify the installation directory of your web application. Enter a single full stop to install the setup in the current location – i.e., where we added the “setup-nextcloud.php” file.

    set installation directory Nextcloud

    After you have configured the directory, the installation will begin. It will take 5-10 minutes, depending on the speed of your internet connection. Once the installation is complete you will be greeted with a success message.

    nextcloud installation successful

    4. Configure NextCloud

    After installation you will need to set up the administrator account, storage path, and the database that will be used by NextCloud.

    First, go to the RunCloud dashboard and create a new database user. After you have done this, create a new database and grant its access to the user that you just created. Once you have created the database, it should look like this:

    nextcloud database create

    After creating the database, return to the NextCloud installation and enter the login credentials of your administrator account. If you don’t want to use the default path to store data then you can change that as well.

    Finally, make sure to switch to the MySQL/MariaDB tab and enter the details of the new database and user that you created in the last step. Update the database host to localhost:3306 and click “Install”. If you are using a containerised server, then you will need to enter host:3306 instead; refer to our docs on networking in containerised servers on RunCloud for more information.

    Create Nextcloud admin account

    After installation, you will be asked if you want to install the recommended apps. You can skip this step if you wish, and install any apps at a later time from the dashboard.

    5. Troubleshooting NextCloud

    After installation, you will need to tweak a few settings to properly secure your server. Click on the user icon in the top right corner of your screen, and navigate to “Administration Settings”.

    setup Nextcloud installation

    Ideally, you should see the green “All check passed” in the security and setup warning section. However, after installing NextCloud it is possible that you might see messages in any of three different colors:

    • red (error)
    • yellow (warning)
    • black (notice)

    Fortunately, RunCloud makes it very easy to remove these messages. Let’s start with red ones first.

    Warnings on Nextcloud dashboard

    5.1 Fixing “PHP Memory Limit Is Below The Recommended Value”

    This can be easily fixed in the RunCloud dashboard. Go to “Settings” and scroll down to the PHP settings section. You will see the option to modify the memory limit. Update the value, and save the changes.

    setting memory limit on RunCloud

    5.2 Warning – PHP Function is Not Available

    NextCloud requires a number of PHP functions to run properly. If there are any unavailable PHP functions, you will probably see this warning message.

    If you see the message that the PHP function set_time_limit is not available, this could result in scripts being halted mid-execution, breaking your installation. Therefore, enabling this function is strongly recommended.

    To fix this issue, go to the RunCloud dashboard panel, select your server, click the Web Application menu, select your web application, and then click the “Settings” menu of this web app. Scroll to find the disable_functions option and remove the following functions from the text:

    • set_time_limit
    • ignore_user_abort
    • posix_getuid
    • posix_getpwuid

    After removing the functions from the list, click the “Update Web Application Settings” button. Refresh the NextCloud page – the warning message should disappear.

    disable php functions on RunCloud

    5.3 Fixing “Strict-Transport-Security HTTP Header…”

    Enabling HTTP Strict Transport Security policy on your server will fix multiple error messages. Go to your dashboard and click on “Domain Name”. You will see all of the domains that are associated with your application. Configure the TLS settings to enable the HSTS policy.

    Configure HSTS header on RunCloud

    Once there, pick the third option to enable the policy, and click “Update” to save the changes.

    Enable HSTS header on RunCloud

    5.4 Configure Redis Memory Cache (with Enhanced Security)

    Memory caching can significantly improve your Nextcloud server performance, as frequently requested objects are stored for faster retrieval. While Nextcloud displays a warning if a local memcache isn’t configured, it’s not strictly required. However, using a memcache is highly recommended for optimal performance.

    With RunCloud, you can use either Redis or Memcached. Follow the steps below to configure the Redis cache for your Nextcloud installation:

    Step 1: Enable Redis Service (RunCloud)

    1. Log in to your RunCloud dashboard and select the server where your Nextcloud instance is running.
    2. Navigate to the Services section.
    3. Locate the Redis service. If it’s not already running, start it. RunCloud pre-installs Redis, so you generally only need to enable it.
    Enable Redis on RunCloud

    Step 2: Choose Your Redis Authentication Strategy

    RunCloud sets a default Redis password for the default user. You have two primary options:

    • Option A (Simpler): Use the RunCloud Default Redis User: This is the easiest approach but less granular. You’ll use the existing default user and its password.
    • Option B (More Secure): Create a Dedicated Nextcloud Redis User: This is the best security practice. You’ll create a new Redis user with specific permissions tailored only for Nextcloud, minimizing the risk of unauthorized access.

    Step 3: Using the RunCloud Default Redis User (Option A)Retrieve the Default Password: You’ll need the default Redis password set by RunCloud. Go to your Server, click Settings, scroll down to the Redis Password tab, and copy the password from the Current Password field.

    Step 4: Creating a Dedicated Nextcloud Redis User (Option B – Recommended only for Advanced Users)

    Before we proceed further, you should note that this step is optional. Once you have the master password for your Redis server (as explained in step 3), you can use it to connect your Nextcloud instance to Redis. However, advanced users should consider creating a separate user account for Nextcloud using the following steps:

    Connect to Redis via SSH: Connect to your server via SSH and use the following redis-cli to connect to your local Redis instance:

    ## Command to connect to Redis CLI
    redis-cli -h 127.0.0.1 -p 6379 -a "your_runcloud_redis_password"

    In the above command, you will need to replace your_runcloud_redis_password with the RunCloud Redis password that you noted in step 3.

    Create the User: After this, use the ACL SETUSER command provided below to create a new user with the correct permissions. Make sure to replace nextcloud_redis_user and your_secure_password with your desired username and a strong password.

    ## Create user in Redis without Dangerous permissions
    ACL SETUSER nextcloud_redis_user >your_secure_password on ~* +@all -@dangerous

    In the above ACL Rule:

    • +@all: Grants both read and write access to your database.
    • -@dangerous: Denies dangerous commands that could harm your Redis instance.

    You can configure these parameters to add or remove specific permissions by consulting the official Redis documentation.

    Step 5: Configure Nextcloud (config.php)

    1. Access Your Nextcloud Files: In the RunCloud dashboard, go to your server, select your Nextcloud web application, and then click File Manager.
    2. Edit config/config.php: Locate and edit the config/config.php file within your Nextcloud installation directory.

    Add the Redis Configuration: Add the following lines inside the main configuration array (not at the end of the file). Make sure the syntax is correct PHP. The location within the array doesn’t matter as long as it’s within the main $CONFIG = array ( ... ); block.

    If you chose Option A (Default User):

    'memcache.local' => '\OC\Memcache\Redis',
      'memcache.distributed' => '\OC\Memcache\Redis',
      'memcache.locking' => '\OC\Memcache\Redis',
        'redis' => [
        'host' => '127.0.0.1',
        'port' => 6379,
        'password' => 'your_runcloud_redis_password'
      ],

    If you chose Option B (Dedicated Nextcloud User):

    'memcache.local' => '\OC\Memcache\Redis',
      'memcache.distributed' => '\OC\Memcache\Redis',
      'memcache.locking' => '\OC\Memcache\Redis',
        'redis' => [
        'host' => '127.0.0.1',
        'port' => 6379,
        'user' => 'nextcloud_redis_user',
        'password' => 'your_secure_password'
      ],
    1. Save the config.php file.

    Step 6: Verify and Test

    Log in to your Nextcloud admin interface. Go to Administration settings -> Security & setup warnings. The warning about missing memcache should be gone.

    5.5. Enable Imagick (ImageMagick PHP Extension)

    NextCloud uses Imagick for the preview generation process. When Imagick is not available, you will see a warning message in NextCloud’s automated checks.

    Imagick is optional – it’s not required, and you may safely ignore the warning if only a few users are using your NextCloud server. If you want to enable it, read our quick guide on how to install Imagick (ImageMagick PHP Extension) in RunCloud.

    5.6. WebDAV Interface Seems to be Broken

    If you are getting the WebDAV interface seems to be broken error in your Nextcloud installation then you will need to tweak your server settings to fix this error. The exact steps vary for different tech stacks on RunCloud. You can find your application stack under the “Web Application Stack” section on the Settings page for your application.

    For NGINX Hybrid Stack on RunCloud

    If you are using the default hybrid stack on RunCloud, then you will need to create a custom NGINX configuration file for your Nextcloud application. When creating the config, make sure to select the type as location.main-before and give it a descriptive name. Next, paste the following code snippet in the provided text box as shown below:

    location ~ /.well-known {
        try_files $uri @proxy;
    }

    Once you save the configuration file, you can go back to your Nextcloud applications and refresh the page to check if the error still persists.

    For Native NGINX Stack on RunCloud

    If you are using the native NGINX stack, then you will need to create a custom NGINX configuration file for your Nextcloud application. When creating the config, make sure to select the type as location.main-before and give it a descriptive name. Next, paste the following code snippet in the provided text box as shown below:

    index index.php index.html /index.php$request_uri;
    location = / {
        if ( $http_user_agent ~ ^DavClnt ) {
            return 302 /remote.php/webdav/$is_args$args;
        }
    }
    
    location = /robots.txt {
        allow all;
        log_not_found off;
        access_log off;
    }
    
    # Make a regex exception for `/.well-known` so that clients can still
    # access it despite the existence of the regex rule
    # `location ~ /(\.|autotest|...)` which would otherwise handle requests
    # for `/.well-known`.
    location ^~ /.well-known {
        # The rules in this block are an adaptation of the rules
        # in `.htaccess` that concern `/.well-known`.
    
        location = /.well-known/carddav { return 301 /remote.php/dav/; }
        location = /.well-known/caldav  { return 301 /remote.php/dav/; }
    
        location /.well-known/acme-challenge    { try_files $uri $uri/ =404; }
        location /.well-known/pki-validation    { try_files $uri $uri/ =404; }
    
        # Let Nextcloud's API for `/.well-known` URIs handle all other
        # requests by passing them to the front-end controller.
        return 301 /index.php$request_uri;
    }
    
    # Rules borrowed from `.htaccess` to hide certain paths from clients
    location ~ ^/(?:build|tests|config|lib|3rdparty|templates|data)(?:$|/)  { return 404; }
    location ~ ^/(?:\.|autotest|occ|issue|indie|db_|console)                { return 404; }
    
    # Ensure this block, which passes PHP files to the PHP process, is above the blocks
    # which handle static assets (as seen below). If this block is not declared first,
    # then Nginx will encounter an infinite rewriting loop when it prepends `/index.php`
    # to the URI, resulting in a HTTP 500 error response.
    location ~ \.php(?:$|/) {
        # Required for legacy support
        rewrite ^/(?!index|remote|public|cron|core\/ajax\/update|status|ocs\/v[12]|updater\/.+|ocs-provider\/.+|.+\/richdocumentscode(_arm64)?\/proxy) /index.php$request_uri;
    
        fastcgi_split_path_info ^(.+?\.php)(/.*)$;
        set $path_info $fastcgi_path_info;
    
        try_files $fastcgi_script_name =404;
    
        include fastcgi_params;
        fastcgi_param SCRIPT_FILENAME $document_root$fastcgi_script_name;
        fastcgi_param PATH_INFO $path_info;
        fastcgi_param HTTPS on;
    
        fastcgi_param modHeadersAvailable true;         # Avoid sending the security headers twice
        fastcgi_param front_controller_active true;     # Enable pretty urls
        fastcgi_pass unix:/var/run/<appname>.sock;
    
        fastcgi_intercept_errors on;
        fastcgi_request_buffering off;
    
        fastcgi_max_temp_file_size 0;
    }
    
    # Serve static files
    location ~ \.(?:css|js|mjs|svg|gif|png|jpg|ico|wasm|tflite|map|ogg|flac)$ {
        try_files $uri /index.php$request_uri;
        # HTTP response headers borrowed from Nextcloud `.htaccess`
        add_header Cache-Control                     "public, max-age=15778463,asset_immutable";
        add_header Referrer-Policy                   "no-referrer"       always;
        add_header X-Content-Type-Options            "nosniff"           always;
        add_header X-Frame-Options                   "SAMEORIGIN"        always;
        add_header X-Permitted-Cross-Domain-Policies "none"              always;
        add_header X-Robots-Tag                      "noindex, nofollow" always;
        add_header X-XSS-Protection                  "1; mode=block"     always;
        access_log off;     # Optional: Don't log access to assets
    }
    
    location ~ \.woff2?$ {
        try_files $uri /index.php$request_uri;
        expires 7d;         # Cache-Control policy borrowed from `.htaccess`
        access_log off;     # Optional: Don't log access to assets
    }
    
    # Rule borrowed from `.htaccess`
    location /remote {
        return 301 /remote.php$request_uri;
    }
    
    # location / {
    #     try_files $uri $uri/ /index.php$request_uri;
    # }

    After adding the above snippet to your configuration file, you need to modify the line which contains fastcgi_pass unix:/var/run/<appname>.sock;. In this line, you need to replace the <appname> with the name of your application that you entered in the step 1. Once you have saved this config file, you will need to create another NGINX config file for this application, but this time at the root location. Paste the following text in the text box and hit save:

    try_files $uri $uri/ /index.php$request_uri;

    Once you save the second config file, you can go back to your Nextcloud installation and verify that the error is gone.

    For Containerised NGINX Stack on RunCloud

    If you are using containerised Docker servers on RunCloud to run your Nextcloud installation, then you will need to create custom NGINX config to redirect web requests. The steps for creating the custom configuration for this stack are similar to the native NGINX stack on RunCloud (as described above), but there is one key distinction.

    When editing the fastcgi_pass unix:/var/run/<appname>.sock; line in your configuration, you will need to replace it with fastcgi_pass unix:/var/run/php/<appname>.sock;. After replacing the line, you can modify it to update <appname> with the name of your application and continue with the rest of the process.

    Summary

    NextCloud is an open source file manager that provides many additional features such as calendar management and file sharing. If you want to run your own version of Dropbox or Google Drive on your server for your own team or business, NextCloud is a great solution, allowing you to share and collaborate on documents, and have video chats without potential data leaks.

    RunCloud is a server management platform that makes it easy to manage and optimize your servers with an easy to use graphical user interface. Sign up for RunCloud today and see how it can save you time and money.

  • 8 Best GTmetrix Alternatives for Website Performance Testing (Includes Free)

    8 Best GTmetrix Alternatives for Website Performance Testing (Includes Free)

    Website speed matters – if your site loads slowly, people will leave.

    GTmetrix is a common tool for checking website performance, but it’s not the only one.

    This post examines different ways to test your website’s performance, including exploring several GTmetrix alternatives we recommend considering. We’ll also cover options if you’re looking for a free website performance evaluation tool or just want to find the best website performance analyzer for your specific needs.

    Let’s get started!

    What is GTmetrix?

    GTmetrix is a powerful and widely used online performance analysis tool for websites. It is a virtual performance auditor that examines your website’s loading behavior and provides you with a detailed breakdown of its strengths and weaknesses. It goes beyond a simple page load timer and dives deep into the mechanics of how your site interacts with a user’s browser.

    Here are a few reasons why people use GTmetrix to evaluate their web performance:

    • Simulated User Experience: GTmetrix simulates a real user accessing your website from various locations and using different browser configurations (Chrome, Firefox). This allows you to understand how your site performs under different conditions and for a global audience.
    • Performance Audits: GTmetrix runs a series of performance audits based on Google PageSpeed Insights and its own recommendations. These audits identify areas that need optimization and provide clear, actionable suggestions.
    • Historical Data Tracking: You can save and track reports over time to monitor the impact of code changes and server configurations on performance. This allows you to detect regressions and fine-tune your website over time.
    • Multiple Testing Options: GTmetrix allows you to run tests from different locations, simulating various user experiences. You can also specify connection speeds and devices.
    • Integration and Automation: GTmetrix provides API access for integration with other tools and for automating performance testing as part of your CI/CD pipeline. This allows for continuous and repeatable testing.

    GTmetrix provides a rich data set to help developers understand why a website is performing the way it is and guide them to specific areas for performance optimization, but it still has a few limitations.

    Suggested read: 15 Best Performance Testing Tools to Improve Your Site in 2021

    Limitations of GTmetrix

    While GTmetrix is incredibly useful, it’s essential to understand its limitations to ensure you interpret results accurately and use the tool effectively.

    • Synthetic Tests are Not Real: GTmetrix relies on synthetic testing, which simulates a user experience through a virtual browser. This is great for controlled experiments and consistent measurements but doesn’t always perfectly represent real user behavior. Factors like network conditions, device capabilities, and user interactions affecting page load vary significantly. To get a complete picture, you should complement GTmetrix data with RUM tools (Real User Monitoring) that capture actual usage data.
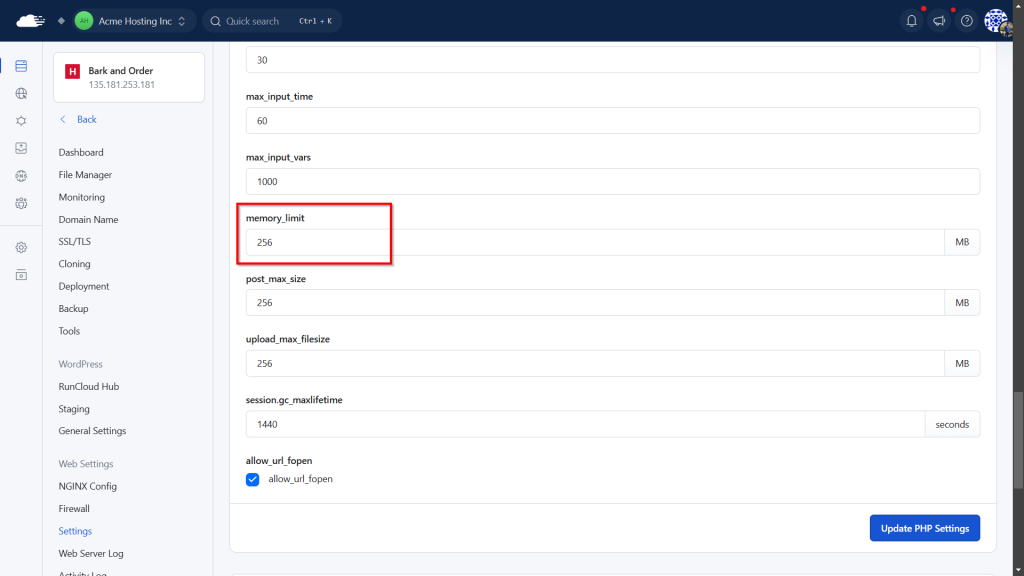
    • Focus on Front-End Performance: GTmetrix is heavily focused on front-end performance, which is how the browser delivers and renders the page. While it will identify server performance issues (like slow TTFB), it won’t provide insight into server-side bottlenecks, database performance, or application-specific code.
    • Test Server Variation: While the tests are controlled, variations in test server load or network conditions may occasionally affect results. Run tests multiple times to verify consistency. Having highly variable results might indicate an external problem with the test or the tested website’s server.
    • Limited Device Emulation: GTmetrix emulates a limited set of mobile devices and browsers. For in-depth testing on a wide range of devices, you still need to rely on other tools, such as browser device emulators and real device testing.

    Suggested read: The Complete WordPress Speed Optimization Guide

    Top 8 GTmetrix Alternatives

    Here are some of the most popular alternatives to GTmetrix, which can be used to evaluate the performance of websites and web applications.

    1 – DebugBear

    DebugBear is a performance auditing suite focusing on real-user data and lab-based tests. It can pinpoint areas where a website is underperforming by providing a multi-faceted view. First, it gathers data from Google’s Chrome User Experience Report (CrUX), which tests represent actual user experiences. It shows the distribution of core web vital metrics including First Contentful Paint (FCP), Largest Contentful Paint (LCP), Cumulative Layout Shift (CLS), and Interaction to Next Paint (INP).

    DebugBear is best for projects that require ongoing, in-depth performance analysis and tracking, and is especially well suited for sites that must keep up with Core Web Vitals and performance regressions. DebugBear excels at providing a more detailed and actionable approach to performance monitoring.

    It produces real-world data, which is vital for understanding how your site performs for actual users. For example, in the above report we can see metrics are categorized as “Good”, “Needs Improvement”, and “Poor”, with a percentage breakdown to show the distribution. It also provides a 25-week trend graph for these metrics.

    Why it’s a great alternative: While GTmetrix is more of a point-in-time audit, DebugBear is useful for continuous monitoring and offers a complementary approach to the same problem. DebugBear provides historical tracking data, allowing us to analyze site performance improvements over time.

    Suggested read: How To Optimize Laravel for Performance (8 Expert Tips)
    2 – SpeedVitals

    SpeedVitals is a performance testing tool that provides a user-friendly interface with in-depth performance analysis. It takes a visual approach to analyzing metrics such as FCP, LCP, and CLS. Additionally, it provides core web vitals and page speed scores. It also includes real user monitoring and continuous monitoring.

    It is well-suited for users who want a tool that offers a very rich visual representation of page performance and an easy-to-grasp summary of common metrics. The SpeedVitals report gives a good overview of how well a website performs, using a combination of easy-to-understand grades and numbers alongside technical analysis for those who want more details.

    Why it’s a great alternative: SpeedVitals combines GTmetrix’s performance tracking features with easier visual analytics and in-depth monitoring for real users. The report provides a visual timeline showing how the website appears to the user during load, which helps identify performance bottlenecks.

    It also uses data to measure specific metrics for elements on the page to further understand how the user experiences the site. For example, we can track how long it takes for the first piece of text or image to show up, how fast the page feels like it’s loading, and how long before the user can fully interact with the page. The report also breaks down the size of different types of files, like JavaScript, images, and CSS, to show which ones take up the most space and slow down the website.

    Experts can dive even deeper to analyze which part of the page is the last to load, and it even shows animations of where page elements might shift around to help pinpoint the root of the problem. One of the best sections of the report is the “Code Coverage” area, which shows parts of the website’s code that aren’t even being used. This is helpful because eliminating unused code can make the site much faster.

    Suggested read: Website Load Testing – How To Test Website Performance At Scale

    3 – Google PageSpeed Insights

    As the name suggests, PageSpeed Insights was developed by Google, and it uses the same technology as Google crawl bots to track your website. It offers scores, audits, and specific recommendations based on Google’s web performance best practices, particularly relevant for SEO.

    Google PageSpeed Insights provides both real-world user experience data and lab-based diagnostic information. At the top of the report, it presents a clear summary of “Core Web Vitals” based on real user data from the Chrome UX Report (CrUX). It also shows some additional user metrics, such as FCP and TTFB, which are useful in measuring the quality of user experience and provide a benchmark for performance improvements. It is important to note that this data is gathered from real Chrome users and will not be available for every website.

    Why it’s a great alternative:It provides a perspective on what impacts SEO rankings and offers actionable guidance. Although GTmetrix has PageSpeed Insights data, using it directly allows for more frequent updates.

    Suggested read: How to Optimize Your Site for Google’s Core Web Vitals

    4 – Firefox Profiler

    The Firefox Profiler is a remarkably powerful yet often overlooked performance auditing tool directly integrated into the Firefox browser. Unlike many other profiling solutions that require external installations or complex setups, it’s readily accessible, making it an incredibly convenient option for developers.

    What truly sets it apart is its ability to provide a holistic view of a website’s performance from your own network on your own computer. This is different from most other tools that use virtual machines on the cloud to test your website.

    By testing the website on your own computer, you can test not just network activity but also intricate details of JavaScript execution, rendering processes, and even interactions with the browser’s internal systems. The profiler’s data is presented across multiple interactive visualizations.

    The “Call Tree” provides a hierarchical breakdown of function calls, allowing developers to pinpoint exactly where the code spends its time. The “Flame Graph” visually represents these calls as stacked bars, making it easy to identify performance bottlenecks at a glance.

    The “Stack Chart” provides insight into the call stack and functions. The “Marker Chart” provides an overall timeline with specific markers for rendering, javascript execution, and other key processes, allowing developers to visualize how these different processes interact.

    Why it’s a great alternative:The depth of information offered by the Firefox Profiler goes beyond simple performance metrics. It captures low-level browser operations, which enable developers to diagnose issues that might not be apparent through other tools. This feature is especially useful for tracking how efficiently data is handled within a web application.

    Suggested read: Uptime Monitoring Tools: Why You Need Them, and What to Look for

    5 – WebPageTest

    Catchpoint’s WebPageTest is a customizable testing tool that allows deep control over test conditions such as geographic locations, connection speeds, and device types. It is also well known for its advanced waterfall charts and visual rendering metrics.

    A clean and concise interface provides developers insights into critical metrics such as TTFB, FCP, Speed Index, LCP, CLS, and TBT. These metrics are further enriched by an “Is it Quick?” assessment, which highlights key aspects like render-blocking requests and identifies if the largest content is rendered too late.

    This allows technical users to target specific performance challenges, such as optimizing resource loading, image delivery, and JavaScript processing. The platform also generates a detailed filmstrip showing page load progression, which lets developers visualize the website’s rendering over time.

    WebPageTest is best for developers who need highly granular control over testing environments and for in-depth debugging of performance issues. It presents both synthetic test results and real-user metrics. Furthermore, users can even inspect videos of each test run to identify any visual issues during page load. By breaking down the resources by type and size, WebPageTest makes it easy for developers to identify areas that need to be optimized. This powerful set of features gives developers all the tools they need to find performance bottlenecks.

    Why it’s a great alternative:It offers advanced configuration options for more complex testing requirements. Additionally, WebPageTest provides practical recommendations categorized into “Opportunities”, “Tips”, and “Pro” experiments. The “Is it Usable?” and “Is it Resilient?” sections give performance metrics for these key web factors often missed by other tools.

    6 – Lighthouse (Chrome DevTools)

    The Lighthouse analyzer is built into Chromium browsers and provides a comprehensive website performance audit. You can open it by navigating to the desired URL in your browser and switching to the Lighthouse tab in the Developer tools menu.

    The Lighthouse report breaks down the performance analysis into four key categories: Performance, Accessibility, Best Practices, and SEO. The report begins with an overall performance and individual scores for each performance metric. It provides both numeric values and a visual grade indicating whether the metric is considered good, needs improvement, or is poor.

    It also flags issues related to initial server response time, JavaScript execution, and network payloads, giving a full look at the site’s performance. For accessibility, the report identifies issues with names and labels, ARIA attributes, contrast, tables and lists, and navigation using headings, which developers can use to ensure a website is usable to everyone.

    Why it’s a great alternative: It is integrated directly into Google Chrome and provides instant performance audits without leaving the browser. This is especially useful during development for iterative feedback loops.

    7 – Calibre

    The Calibre website audit tool offers a compelling suite of features for web developers and comes with real-user data and long-term monitoring capabilities. You can use its Chrome User Experience Report (CrUX) functionality to accurately view how real users experience a website across different devices (desktop, tablet, and phone).

    It presents this data not just as a single data point but provides a view of how the metrics change over time. This long-term perspective allows developers to detect changes in performance over the long term and make informed optimization decisions. Additionally, a clear indication of whether the site is passing the core web vitals assessment provides a quick, high-level overview of the website’s status.

    By offering a 75th percentile view, Calibre reliably represents the user experience rather than relying on averages that outliers can skew. The histogram visualization gives developers a clear idea of the metric’s distribution, highlighting the range of user experiences.

    Why it’s a great alternative: Calibre offers granular data over time and alerts you to performance regressions. It’s designed for teams that need to integrate performance testing into their CI/CD pipelines. This allows developers to observe trends, identify regressions after updates, and ensure long-term site health. This long-term trend analysis is particularly valuable because it allows you to make strategic decisions based on real user data. This continuous monitoring and integration approach complements GTmetrix’s ad-hoc analysis.

    8 – SiteSpeed.io

    Sitespeed.io is a comprehensive, open-source web performance monitoring and testing platform that prioritizes user control and data ownership. Unlike many commercial offerings, it allows users to run their own performance tests, store their own data, and customize the analysis process. This commitment to transparency and flexibility is a core differentiator.

    The platform is not just a single tool but a collection of modular components, including Browsertime (for timing metrics), Coach (for best practice analysis), PageXray (for page resource analysis), and Throttle (for network emulation), all managed and unified by the primary sitespeed.io tool. This modular design enables users to assemble a performance analysis workflow that precisely meets their needs, making it suitable for both simple tests and complex, large-scale monitoring.

    Further, it emphasizes not being a “black box” solution by allowing the end user to configure different parameters through its command-line interface. This flexibility and control extend to deployment and integration – Sitespeed.io can be easily deployed using Docker, which provides a ready-to-go environment with necessary browsers and dependencies, drastically simplifying the setup process. It also offers traditional installation using npm, which opens up usage for many developers.

    It supports visualization integrations with time-series databases such as Graphite, InfluxDB, and Grafana. These are industry-standard tools that allow the creation of custom performance dashboards and long-term trend analysis. Additionally, the ability to run tests on Android phones and through custom scripting means sitespeed.io adapts to different testing needs.

    Why it’s a great alternative: Sitespeed.io provides a developer-friendly approach to performance monitoring, which makes it ideal for those who want the flexibility of an open-source tool and the ability to customize their performance testing pipelines. This dedication to privacy and open-source principles sets it apart from many commercial solutions, making it an attractive option for developers and organizations that value data security and transparency.

    Final Thoughts

    Throughout this post, we’ve discussed various web performance analysis tools and explored the strengths and unique benefits each offers. We have compared and evaluated various tools, and whether you are looking for a one-time audit, ongoing monitoring of site speed and core web vitals, or debugging locally with browser tools, you can find something that fits your needs.

    If you are building a website, good website performance isn’t just about using the right analysis tools – it begins with a solid foundation, and having a well-configured and responsive server is essential.

    A powerful hosting environment can significantly improve TTFB and reduce the time it takes for your site to begin loading.

    This is where RunCloud comes in.

    RunCloud gives you control over server configurations and optimizes your server-side processes. This can drastically reduce your site’s load time and improve the user’s experience.

    Ready to take your site’s performance to the next level?

    Start building lightning-fast websites today with RunCloud!

    FAQs on GTmetrix Alternatives

    Is GTmetrix now paid?

    While GTmetrix offers a free version with many features, it also offers paid plans that unlock more advanced capabilities, such as increased test limits, monitoring, and detailed historical analysis. The free version is still functional but has limitations compared to the paid versions.

    What is a good website loading speed?

    Generally, a good website loading speed is under 3 seconds for the initial page load, with under 2.5 seconds being optimal; however, Core Web Vitals metrics such as LCP should be under 2.5 seconds.

    Is PageSpeed Insights reliable?

    PageSpeed Insights is a reliable tool for measuring web performance because it is based on the same methodology Google uses to assess website performance. The provided data and recommendations align with Google’s SEO ranking factors and best practices, making it a key tool for SEO optimization.

    Is GTmetrix better than PageSpeed Insights?

    GTmetrix offers more granular detail with its waterfall analysis and is generally more flexible for testing various parameters. At the same time, PageSpeed Insights provides scores and recommendations directly relevant to Google’s ranking criteria. Which is better depends on your specific needs, such as deep performance debugging or general compliance with Google’s guidelines.

    Does GTmetrix use Lighthouse?

    Yes, GTmetrix incorporates Lighthouse data into its reports. It runs a Lighthouse audit to generate its PageSpeed and other associated performance scores. GTmetrix is a wrapper around Lighthouse and other performance analysis tools, providing additional metrics and functionality.

    What is the difference between DebugBear and GTmetrix?

    DebugBear focuses more on continuous monitoring and detailed performance tracking over time, making it excellent for catching performance regressions. GTmetrix is primarily used for point-in-time performance analysis, offering detailed waterfall charts and audits.